In this article, we’ll explore How to Install Grafana Using Helm Chart | how to deploy Grafana, a powerful open-source analytics and monitoring platform, using Helm on a Kubernetes cluster. Helm streamlines the installation process, allowing for quick and efficient deployment of Grafana, enabling seamless monitoring and visualization of your Kubernetes environment.
Table of Contents
Prerequisites
- AWS Account with Ubuntu 22.04 LTS EC2 Instance
- Minikube, kubectl and Helm Installed
Install Minikube and kubectl by following the official documentation for your operating system:
Install Minikube on Ubuntu 22.04 LTS
- Helm Installed:
Install Helm by following the official documentation:
Step #1:Adding Grafana Helm Repository
Integrate the official Grafana Helm repository into your Helm configuration by executing the following command.
helm repo add grafana https://grafana.github.io/helm-charts
Run the following command to verify the repository was added.
helm repo list
Step #2:Helm Repositories Update
Keep your local Helm repositories current to access the latest available charts. Execute the following command:
helm repo update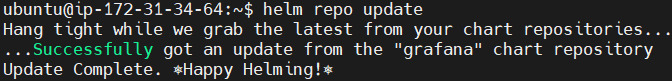
Step #3:Install Grafana using Helm Chart
Deploy Grafana onto your cluster with the default configuration by running the following command
helm install grafana grafana/grafana
Output:

Step #4:Get Grafana admin password
To get the Grafana admin password, run the command as follows
kubectl get secret --namespace default grafana -o jsonpath="{.data.admin-password}" | base64 --decode ; echo
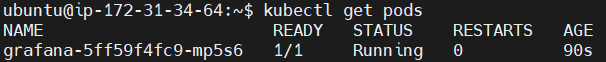
Step #5:Verification of Grafana Deployment
Ensure the Grafana deployment is success by running the following command
kubectl get podsConfirm that the Grafana pod is running and has reached the “Running” state.
Step #6:Grafana Service port forward
For checking services, run following command
kubectl get svc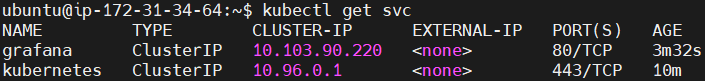
Expose the Grafana dashboard as a service using the kubectl port forward command.
kubectl port-forward --address 0.0.0.0 svc/grafana 3000:80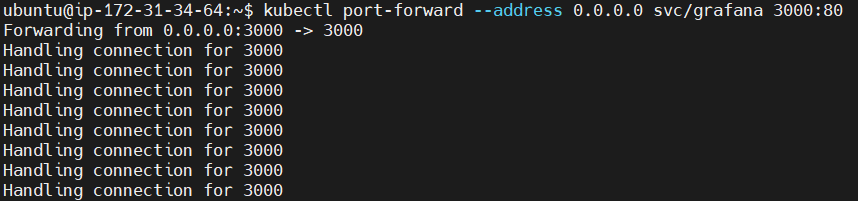
Step #7:Access Grafana on Browser
To access the application on Browser write the ip address:port number in url.
you van see the Grafana login page.
default username is admin and put the password which is got from step #4.

Now that Grafana is set up, you can start making charts and graphs with your data. You can configure data sources and create dashboards to visualize your data. Grafana supports various data sources, including databases, cloud services, and monitoring systems.

Conclusion:
By utilizing Helm for Grafana deployment on Kubernetes, you’ve simplified the installation process and gained flexibility in configuration management. This guide equips you with the knowledge to swiftly set up Grafana, empowering you to harness its robust monitoring and analytics capabilities within your Kubernetes infrastructure.
Related Articles:
How to Install Grafana on Windows
Reference: