In this article we are going to cover Open Source Monitoring Tools for Linux-Prometheus, Grafana, Elastic search, Nagios Core, Zabbix, Cacti, Icinga, MRTG, Netdata, Sensu, Pandora FMS
Table of Contents
Open Source Monitoring Tools for Linux
#1. Prometheus
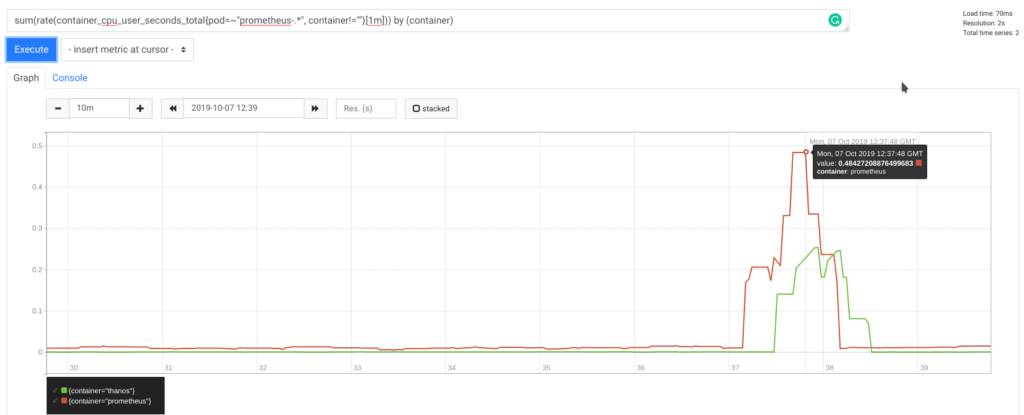
Key Features:-
- Prometheus is an open source tool used for event monitoring and altering.
- Prometheus has changed the way of monitoring systems and that is why it has become the Top-Level project of Cloud Native Computing Foundation (CNCF).
- Prometheus components are written in Go.
- Prometheus uses a powerful query language i.e. “PromQL”.
- The Prometheus servers are independent and able to gather time series by a pullover method over HTTP.
Advantages:-
- In Prometheus tabs are on and handles hundreds of services and micro services.
- Works as effectively one service to rule them all.
- Prometheus use multiple modes used for graphing and dashboarding support.
#2. Grafana
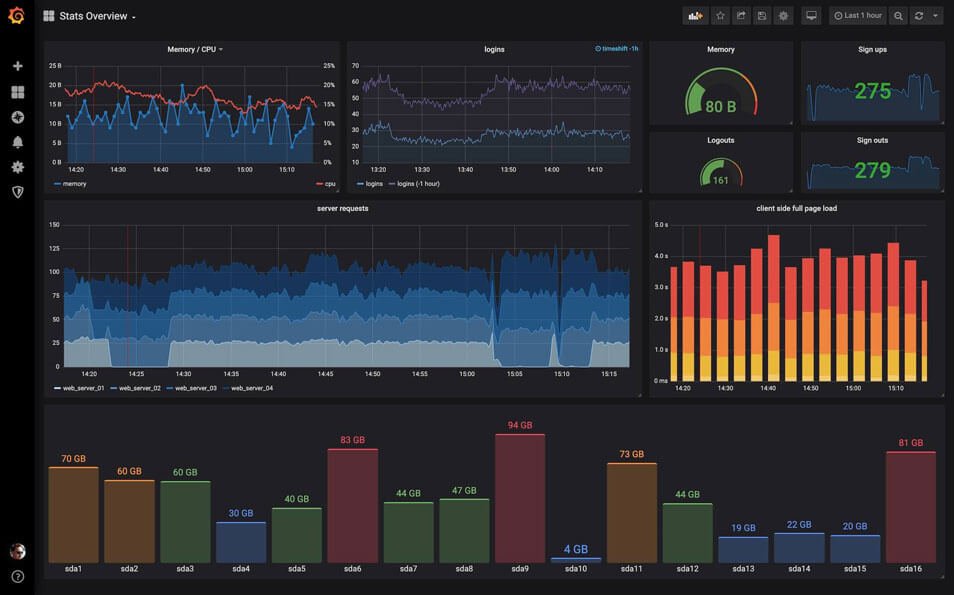
Key Features:-
- Grafana is an open source tool used for event monitoring.
- Grafana is a multi platform open source analytics and interactive visualization web application.
- Grafana provides i) Charts ii) Graphs iii) Alerts
- Grafana supports many databases and mix them together in the same dashboard.
In Grafana we can discover hundreds of dashboards and plugins in the official library of Grafana.
Advantages:-
- Grafana is a completely open source and backed by a vibrant community or Grafana cloud.
- Grafana cloud can be easily installed and used on any platform.
- Due to backed by vibrant community, new ones (plugins) are added to it almost every week.
#3. Elastic Stack
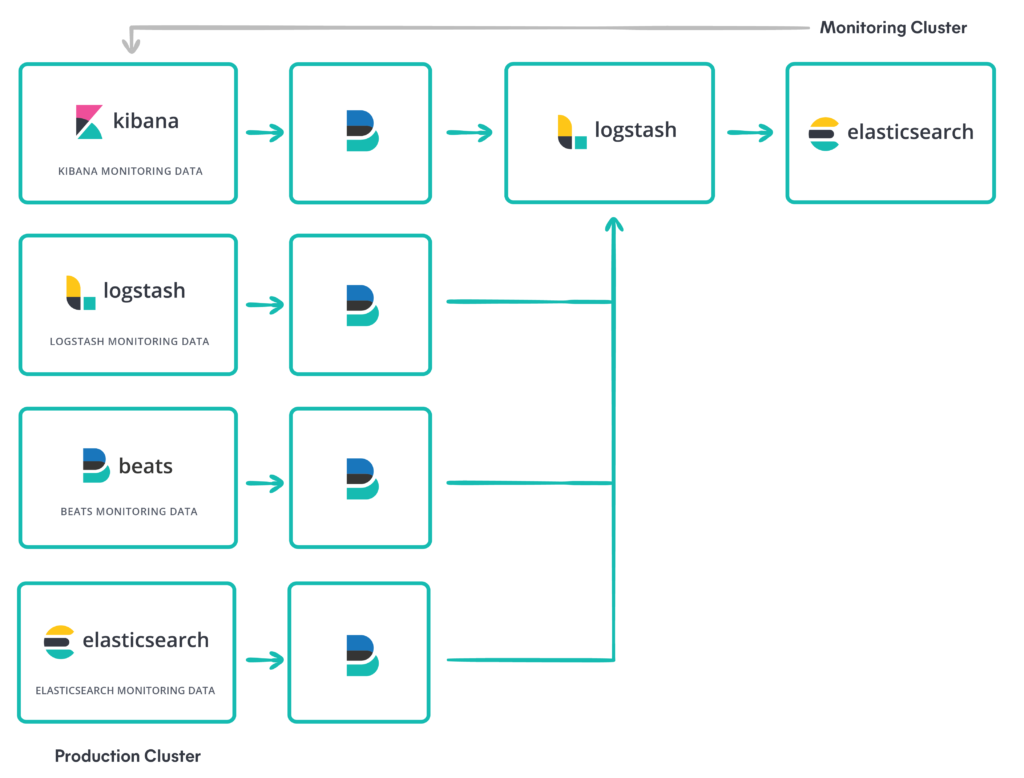
Key Features:-
- Elasticsearch is a open source search, distributed and analytics engine which is build on Apache Lucene and developed in Java.
- Elasticsearch allows you to store, search, and analyse huge volumes of data quickly
- Elasticsearch gives the result as per your searches on milliseconds.
- Elasticsearch is a server that can process JSON requests and give you back JSON data.
- Elasticsearch backend components includes
i) Cluster
ii) Nodes
iii) Shards
iv) Replicas
Advantages:-
- Elasticsearch searches an index, due to this it is able to achieve fast search response.
- Elasticsearch monitors the Cluster Health.
- In Elasticsearch we can enable Self-monitoring.
- We can also easily enable monitoring Elasticsearch nodes with Metric beat.
#4. Nagios Core
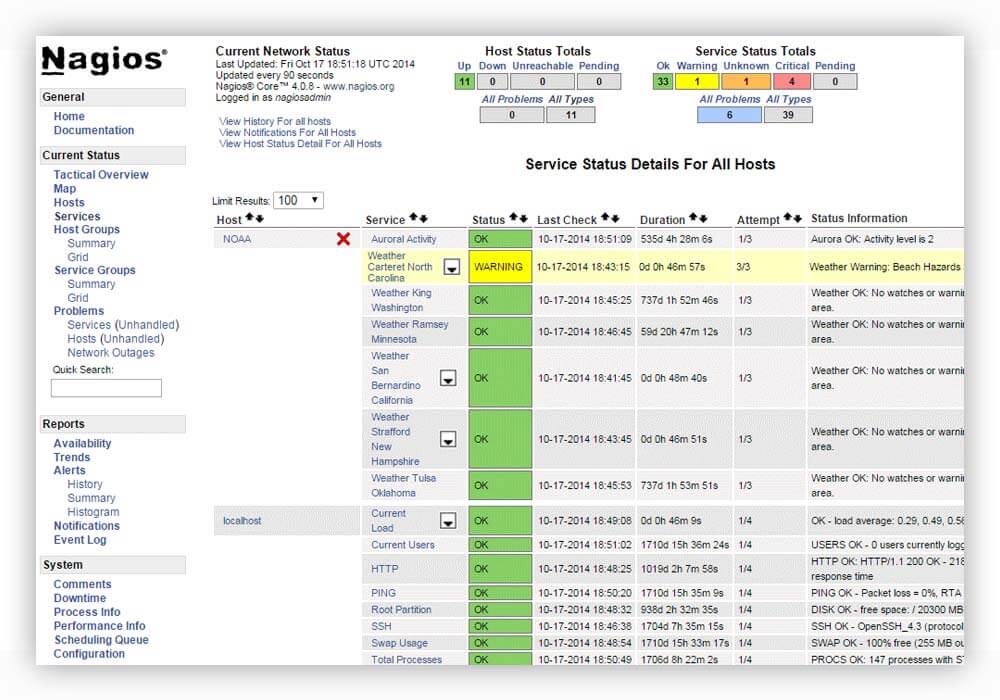
Key Features:-
- Nagios core is used for continuous monitoring of servers, network, applications, business processes and infrastructure.
- Nagios core is scalable, manageable and secure server monitoring tool.
- Nagios core detects network errors, server crashes and automatically sends the alerts.
- In Nagios issues occurred can also be fixed automatically.
Nagios uses the results from the plugins to determine the current status of the hosts and services on your network.
Advantages:-
- Nagios is built on a server/agents architecture which makes easy to communicate with servers.
- In Nagios core, fast detection of server and network protocol failures can be done.
- In Nagios core 3500 different addons available to monitor your servers.
- Using Nagios core, saves our time as monitoring everything is done at one single platform.
#5. Zabbix
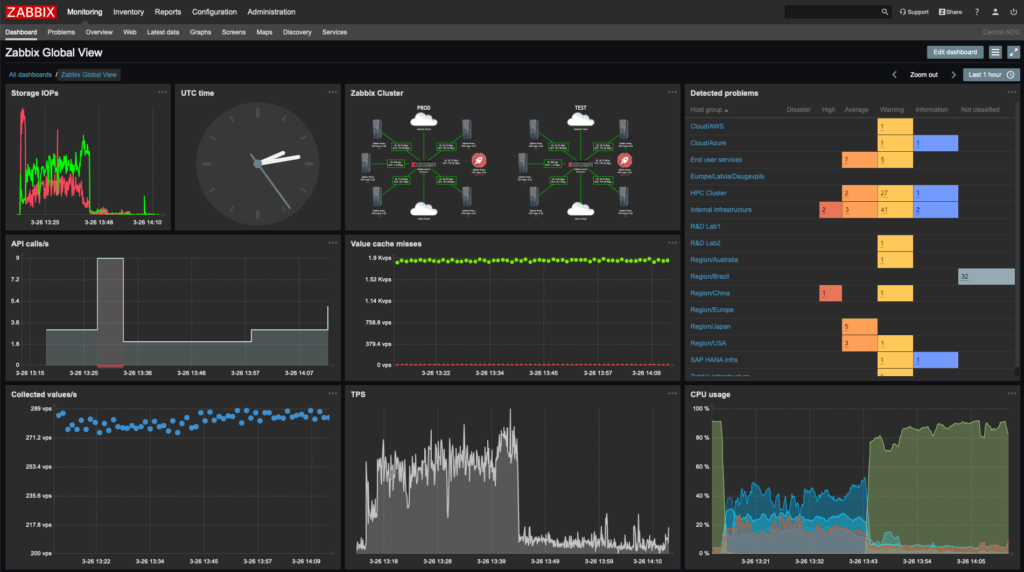
Key Features:-
- Zabbix is purely open source and free server monitoring tool.
- We can easily monitor severs, applications and network devices, which gives accurate statistics and performance data
- Data collected by Zabbix, it will be easy to analyze our infrastructure.
- Types of monitoring done by Zabbix-
i) Network monitoring
ii) Server monitoring
iii) Cloud monitoring
iv) Application monitoring
v) Services monitoring
- Zabbix has end to end encryption and well authentication, and due to this Zabbix has a strong security.
- In Zabbix there are multiple branches that is why distributed monitoring is possible at same time.
Advantages:-
- Zabbix is designed to scale from small environments to large environments.
- Zabbix is trusted by global brands worldwide like Dell, HP, Salesforce, T Systems, etc.
- Zabbix has high availability because it has multiple servers like proxy servers, so load is distributed.
#6. Cacti
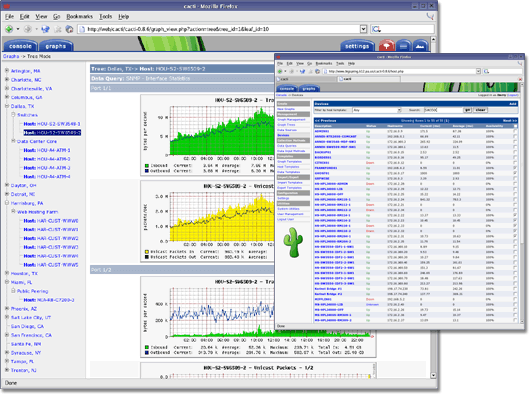
Key Features:-
- Cacti is a open source network monitoring tool which is developed by The Cacti Group, Inc
- Most useful feature of Cacti is its unlimited graph creation tool
- Hardware monitoring is possible in Cacti.
- We can also perform web server monitoring operations on Cacti.
- Cacti Is build in SNMP support.
- In Cacti we can graph network bandwidth utilization, ram usage, CPU load and other statistics.
Advantages:-
- Cacti is user based management due to which it allows administrators to create and assign users.
- Cacti can be extended to monitor any source via shell scripts.
- Cacti has flexible data sources.
- Remote data allocation can be done using Cacti.
#7. Icinga
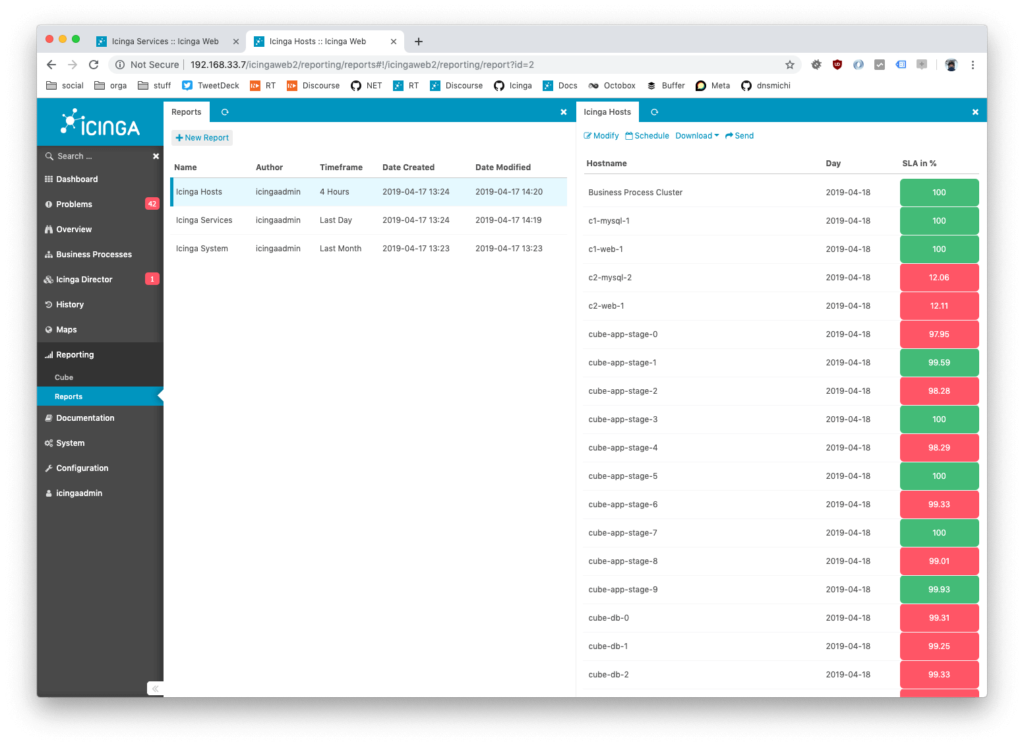
Key Features:-
- Icinga is completely open source and free monitoring tool.
- Icinga is a scalable and extensible server monitoring system.
- Icinga monitoring tool checks the availability of the resources and notifies you.
- High availability is maintained in Icinga monitoring tool.
- Distributed monitoring can be done in Icinga monitoring tool.
- Clusters are present in Icinga
Advantages:-
- Multithreaded design is implemented in Icinga that is why it runs thousands of check per second and due to this, Icinga is fast.
- Icninga is completely top to bottom object oriented designed.
- Icinga is flexible to use and to make hands on.
- Services Monitoring problem are easily detected in Icinga and also recently resolved problems are also displayed.
- Icinga monitoring tool also monitors the infrastructure health.
- Icinga is ease of use.
#8. MRTG
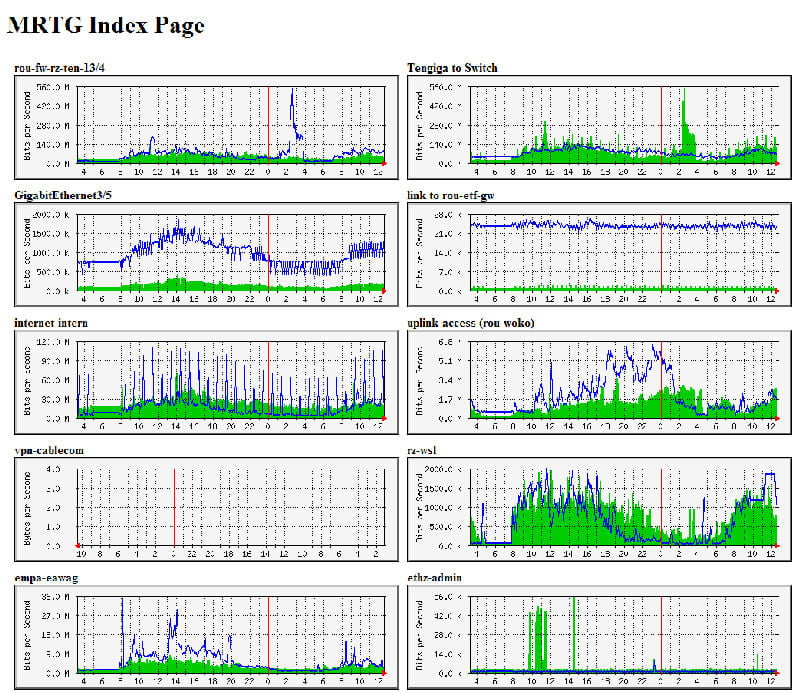
Key Features:-
- MRTG stands for Multi Router Traffic Grapher.
- MRTG monitoring tool is network monitoring tool.
- MRTG uses SNMP (Simple Network Management Protocol) to monitor network traffic.
- MRTG has Agent which has local knowledge of management information.
- NMS (Network Management System) is present in MRTG which runs applications that monitor and control managed device.
- In managed device it contain an SNMP agent and reside on a managed network.
Advantages:-
- MRTG provides resources required for network management.
- Agent makes the information available using SNMP.
- Network traffic is properly analyzed using MRTG.
- Live network traffic is analyzed in MRTG.
- Network traffic is also monitored on our network ports and links.
- MRTG is a open source monitoring tool.
- Well network optimization.
- Well network troubleshooting.
- Good network administration is obtained.
#9. Netdata
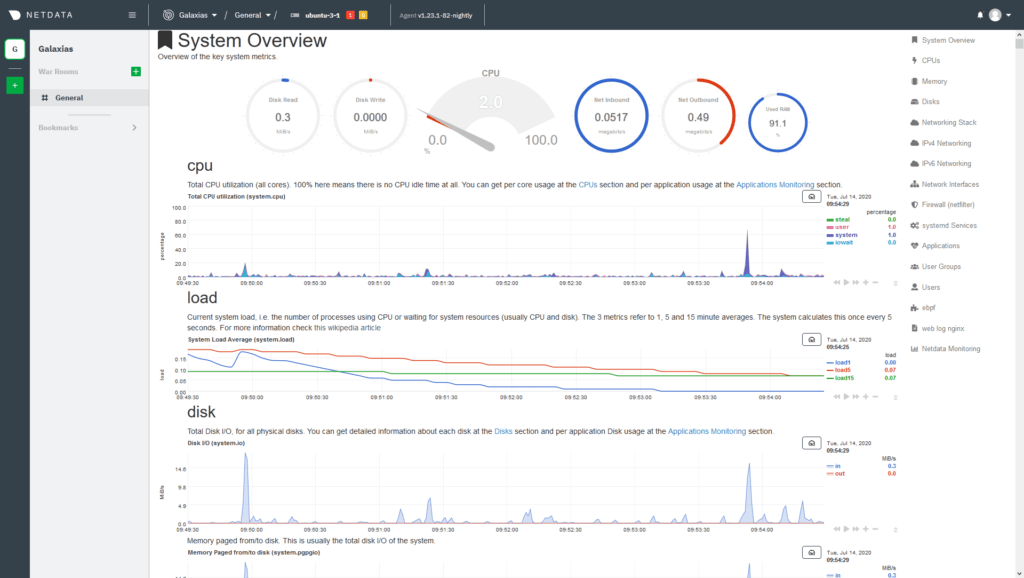
Key Features:-
- Netdata is a distributed, performance and health monitoring for systems.
- Netdata gives real time performance systems, applications.
- Using Netdata we can monitor:-
i) Server
ii) System Application
iii) Containers
iv) Web Applications
v) Virtual Machines
vi) Databases
vii) IOT Devices.
- We can monitor 1000 devices using Netdata.
- We will need to install a python plugin for monitoring PostgreSQL databases.
Advantages:-
- Netdata is mostly used tool which is an open source monitoring tool.
- Netdata can also monitor specific SNMP devices.
- Netdata has a good interactive web dashboards.
- Netdata is fast and efficient.
- Netdata is open source and platform independent.
- RAM usage, kernel optimization monitoring becomes very easy by using Netdata.
#10. Sensu
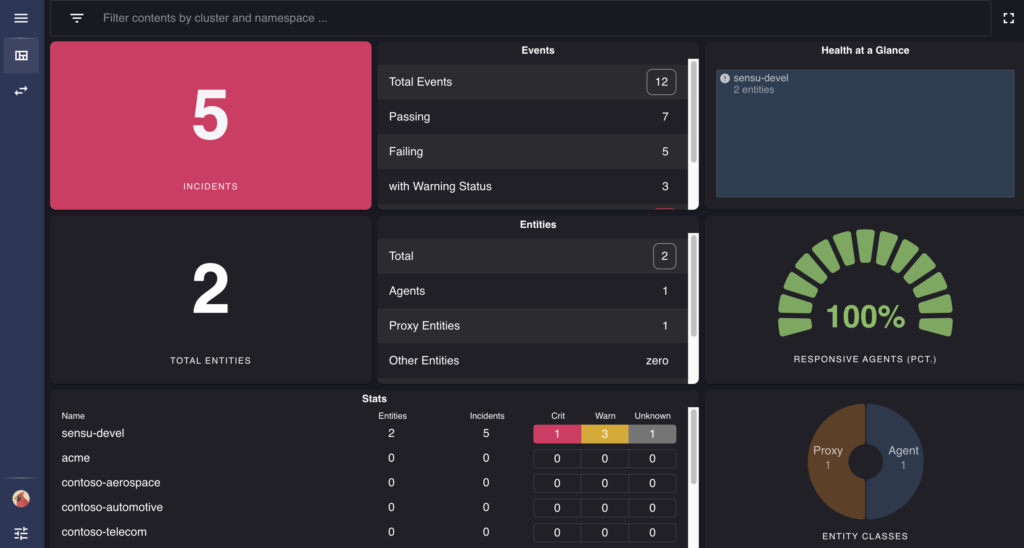
Key Features:-
- Sensu is an open source event monitoring tool.
- Sensu includes
i) Event
ii) Filter
iii) Mutator
iv) Handler
- Sensu monitors Servers, Services, Applications health, network.
- Sensu monitoring tool uses third-party integration.
- Sensu monitoring tool uses sensu agent for operating system checks and metrics.
- We can monitor cloud infrastructure using sensu monitoring tool.
- Sensu is written in Ruby.
Advantages:-
- Sensu monitoring tool is portable.
- Sensu monitoring tool is easier.
- Sensu monitoring tool fast.
- We can create
i) Checks
ii) Register entities
iii) Handlers
iv) Filters, etc
using API.
#11. Pandora FMS
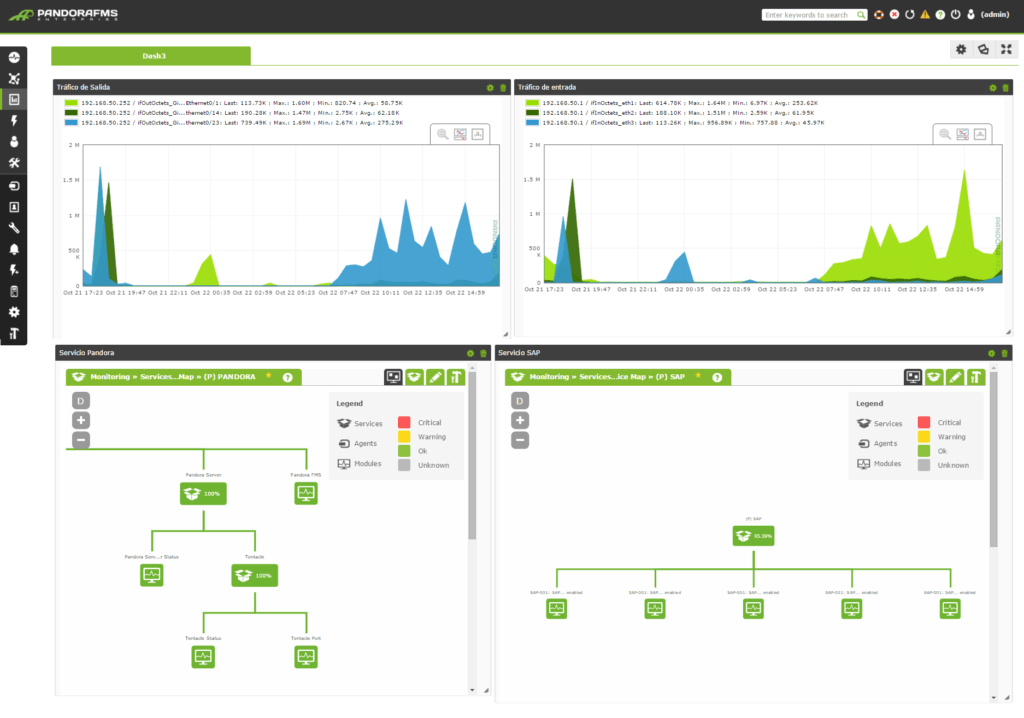
Key Features:-
- Pandora FMS stands for Pandora Flexible Monitoring Solution.
- Pandora FMS is a IT infrastructure monitoring tool in a single console.
- Pandora FMS elements consists of Console, database, Servers, Agents.
- By using Pandora FMS we can monitor:-
- Network
- Logs
- Database
- Cloud
- Applications
- User Experience
- Servers
- IPAM
- SAP
- IoT
- It can do both remote monitoring and monitoring based on agents installed on the servers.
Advantages:-
- Pandora FMS has an open source community edition.
- It also has a Enterprise version which is used by many IT companies.
- Pandora FMS’s both open source and enterprise versions are regularly updated every month.
- It has direct access from the console.
Conclusion:
We have covered Open Source Monitoring Tools for Linux-Prometheus, Grafana, Elastic search, Nagios Core, Zabbix, Cacti, Icinga, MRTG, Netdata, Sensu, Pandora FMS.
Related Articles:
Reference:
1 thought on “Top 11 Open Source Monitoring Tools for Linux”