In this article, we will learn, how to connect Grafana to a remote MySQL database. Grafana, a powerful open-source platform for data visualization and monitoring, supports various data sources, including MySQL, making it a popular choice for creating insightful dashboards. Connecting Grafana to a remote MySQL database allows you to leverage the power of data visualization for monitoring and analysis.
Table of Contents
Prerequisites
- AWS Account with Ubuntu 22.04 LTS EC2 Instance.
- Basic knowledge of AWS services and Grafana.
Step #1:Install Grafana on Ubuntu
First import the GPG key used by the Grafana package.
wget -q -O - https://packages.grafana.com/gpg.key | sudo apt-key add -
Add the Grafana repository to the APT sources.
sudo add-apt-repository "deb https://packages.grafana.com/oss/deb stable main"
Update the package lists
sudo apt update
then install the grafana
sudo apt install grafana
Start the Grafana service and then enable it.
sudo systemctl start grafana-server
sudo systemctl enable grafana-server
and if everything works fine and your service is running properly then run grafana by running your public ip address and port number 3000 which is default port of grafana in searchbar.
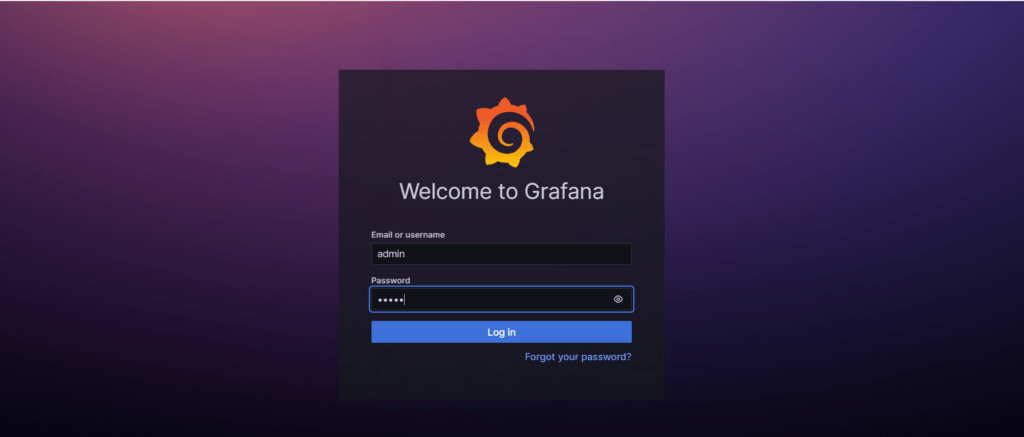
you will see the login page of grafana (UI) user interface
Grafana has admin as default username and password
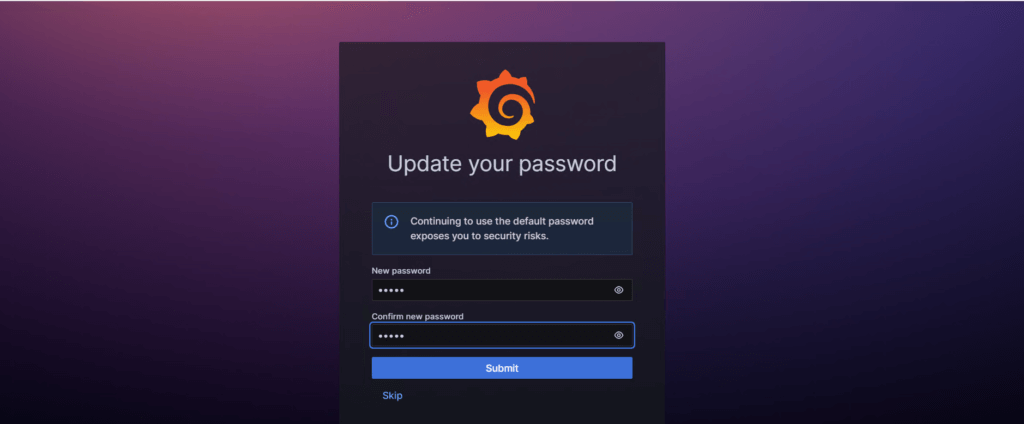
it will ask for changing the password you can change it or skip it.
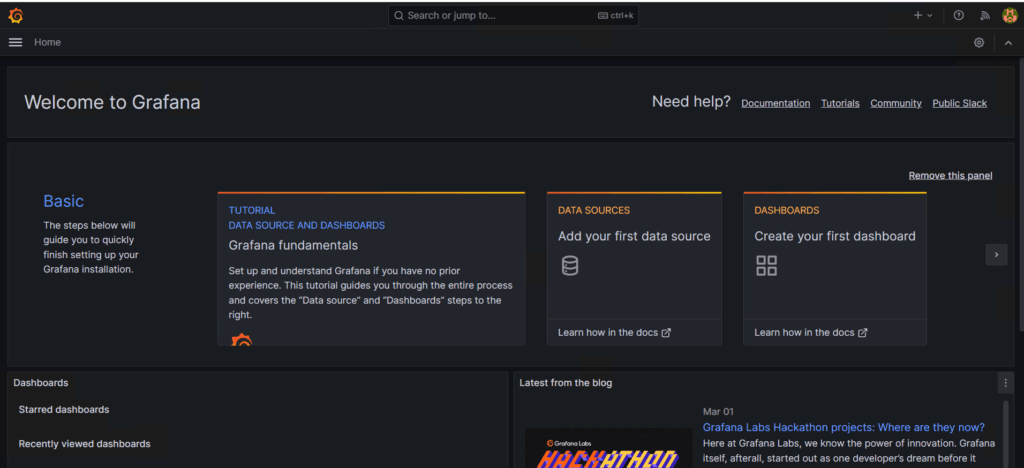
then you will see the welcome page of grafana.
Step #2:Install MySQL on Ubuntu
Update the system.
sudo apt update now install the mysql using following command.
sudo apt install mysql-server -y
check the status to verify the mysql is running properly on your system.
sudo systemctl status mysql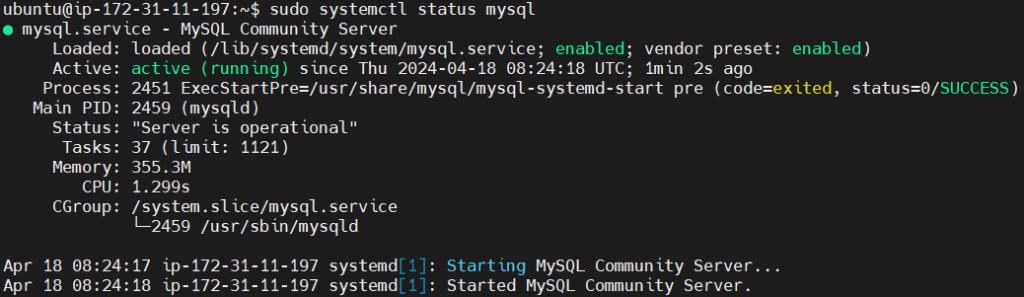
Step #3:Configure MySQL for remote access
Open the MySQL configuration file using the following command
sudo nano /etc/mysql/mysql.conf.d/mysqld.cnf
Adjust the Bind Address and change it to
bind-address = 0.0.0.0
This change allows MySQL to listen for connections from any IP address.
Save and close the file, then restart the MySQL service
sudo systemctl restart mysql
Now that MySQL is set up for remote connections. Lets create a Mysql database which we will visualize and monitor.
First log into the MySQL Console
sudo mysql -u root 
now create a database using following mysql commands.
Create the database
CREATE DATABASE sensor_data;Switch to the newly created database
USE sensor_data;Create the table for sensor readings
CREATE TABLE sensor_readings (
    id INT AUTO_INCREMENT PRIMARY KEY,
    timestamp DATETIME,
    temperature FLOAT,
    humidity FLOAT,
    location VARCHAR(50)
);
Now, let’s insert some example data into the sensor_readings table:
INSERT INTO sensor_readings (timestamp, temperature, humidity, location) VALUES
('2024-04-17 09:00:00', 25.5, 50.2, 'Living Room'),
('2024-04-17 09:05:00', 26.0, 49.8, 'Kitchen'),
('2024-04-17 09:10:00', 25.8, 51.0, 'Bedroom'),
('2024-04-17 09:15:00', 24.9, 52.3, 'Bathroom'),
('2024-04-17 09:20:00', 25.2, 48.7, 'Office');
View all the databases to see if our database is added or not.
show databases;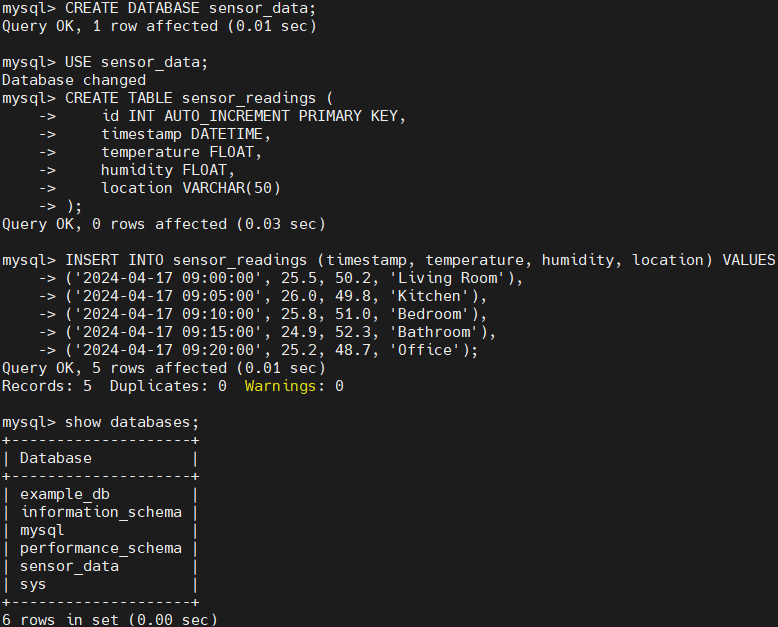
his will add some example sensor readings to the sensor_readings table, each with a timestamp, temperature, humidity, and location.
Create a new user with a unique, strong password
CREATE USER 'fosstechnix' IDENTIFIED BY 'devops';
Grant the new user (fosstechnix) the SELECT permission for the sensor_data database.
GRANT SELECT ON sensor_data.* TO 'fosstechnix';
Flush privileges to ensure the changes take effect, then exit the MySQL console.
flush privileges;

exit
Step #4:Configure the MySQL Database to grafana
Now go to the Grafana home page and select Connections > Add new connections.

search for Mysql in the search box and select it.

now click on Add new data source from up-right side.

Enter the host URL which your Publick IP address:3306 (default port number for Mysql) and Database name: sensor_data in Connection section.
In Authentication section Give the Username and Password which we have created.
Enable the Skip TLS Verify.
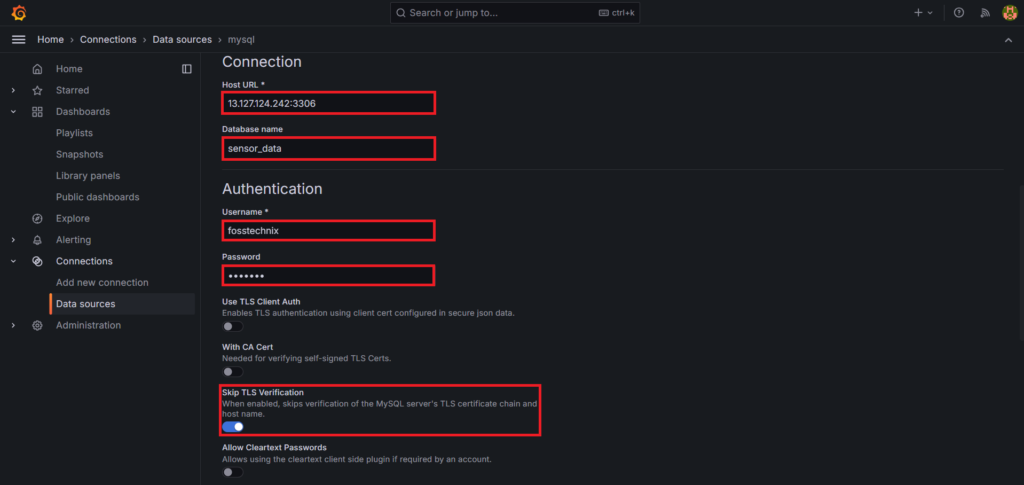
Now click on Save and test and you will receive the message our Mysql database connection is OK

Go to dashboards and click on Create Dashboard.

Click on Add visualization.

Select mysql as a data source.

Now in Query, Select sensor_data Dataset, sensor_readings as a Table and * as Column and click on Run query. Select Table as a visualization format.
This will show us the sensor_data from the Mysql database in table format.

Conclusion:
In this article, we’ve learned how to connect Grafana to a remote MySQL database. After setting up Grafana and MySQL, we configured MySQL for remote access, created a database with sample sensor data, and granted appropriate user permissions. Integrating MySQL Database with Grafana, we created a dashboard to visualize sensor readings, enabling efficient monitoring and analysis. By leveraging Grafana’s capabilities for data visualization and monitoring, we can gain valuable insights from our MySQL data. With Grafana’s powerful visualization tools and MySQL’s robust data storage capabilities, the possibilities for insights and optimizations are endless.
Related Articles:
How to Forward Logs to Grafana Loki using Promtail
Reference: