In this article we are going to cover Monitoring Linux Server with Splunk.
Why Monitor Linux with Splunk?
Monitoring your Linux/Ubuntu systems with Splunk offers several advantages:
- Performance Optimization: Gain insights into system performance, resource utilization, and application behavior. Detect and address performance bottlenecks.
- Security: Monitor logs for signs of security breaches, unauthorized access, and other suspicious activities. Quickly respond to security incidents.
- Troubleshooting: Easily identify and troubleshoot system issues, errors, and faults with detailed log analysis.
- Capacity Planning: Plan for resource scaling and optimization by tracking historical performance data.
- Compliance: Collect and retain logs required for compliance with regulatory standards, such as HIPAA.
What is Splunk Enterprise?
You can extend the Splunk Enterprise environment to fit the specific needs of your organization by using apps. An app is a collection of configurations, knowledge objects, views, and dashboards that runs on the Splunk platform.
Features of Splunk Enterprise
The following section highlights seven Splunk Enterprise features.
Indexing:
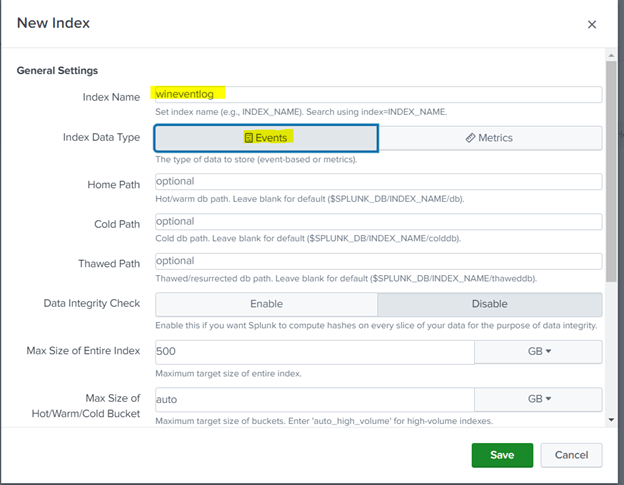
Splunk Enterprise processes and stores the data that represents your business and its infrastructure. Once the data is collected, the index segments, stores, compresses the data, and maintains the supporting metadata to accelerate searching.
- Go to “Settings” > “Indexes.”
- Create an index for your Unix and Linux data, specifying its retention policy.
Search:
Search is the primary way users navigate their data in Splunk Enterprise. You can save a search as a report and use it to power dashboard panels. Searches provide insight from your data, such as:
- Retrieving events from an index
- Calculating metrics
- Searching for specific conditions within a rolling time window
- Go to “Settings” > “Advanced search” > “Search macros.”
- Review the macros provided by the add-on and customize them to match your specific log formats and data.
Alerts:
Alerts notify you when search results for both historical and real-time searches meet configured conditions. You can configure alerts to trigger actions like sending alert information to designated email addresses, posting alert information to an RSS feed, and running a custom script, such as one that posts an alert event to syslog.
Dashboards:
Dashboards contain panels of modules like search boxes, fields, charts, and so on. Dashboard panels are usually connected to saved searches or pivots.
To create a dashboard, go to “Settings” > “User interface” > “Dashboards.” You can create a new dashboard and add panels with visualizations based on your search results.
Reports:
Splunk Enterprise allows you to save searches and pivots as reports, and then add reports to dashboards as dashboard panels. Run reports on an ad hoc basis, schedule them to run on a regular interval, or set a scheduled report to generate alerts when the result meets particular conditions.
To create a report, click “Save As” in the search results view and choose “Report.” Follow the prompts to save and name the report.
Data model:
Data models encode specialized domain knowledge about one or more sets of indexed data. They enable Pivot Editor users to create reports and dashboards without designing the searches that generate them.
Let’s Explore Splunk –


Click on start searching –


Indexes –


Events –

Report and Dashboard –

By above steps and experimenting with different search queries and commands, you can effectively search and analyze data collected by the “Splunk Add-on for Unix and Linux” to gain insights into your Unix and Linux systems.
Related Articles:
