In this article, we will explore how to monitor HTTP metrics for a .NET application using OpenTelemetry and Prometheus. Monitoring your application’s performance is critical for maintaining reliability, diagnosing issues, and optimizing performance. We’ll cover how to instrument your application using OpenTelemetry and expose metrics to Prometheus for detailed analysis.
Table of Contents
Prerequisites
Before you start, ensure you have the following installed on your system.
- AWS Account with Ubuntu 24.04 LTS EC2 Instance.
- .NET SDK installed.
Step #1:Set Up Ubuntu EC2 Instance
If you don’t have SDK installed on your system you can install it by using following commands.
First Update the package list.
sudo apt update
To install the .NET SDK on your Ubuntu server, use the following command
sudo apt install -y dotnet-sdk-8.0
Step #2:Setup Project Repository
For this example, we’ll use a sample .NET application from our GitHub repository.
Clone the below our Opentelemetry GitHub repository using following command.
git clone https://github.com/devopshint/opentelemetry-prometheus-for-dotnet-app.git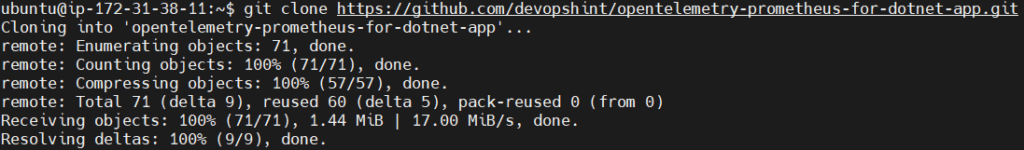
Navigate to the project directory.
cd opentelemetry-prometheus-for-dotnet-app
Step #3:Instrumenting the Application with OpenTelemetry
Open the Program.cs file
nano Program.cs
Add the following line to the top of your Program.cs file.
using System.Globalization; and using Microsoft.AspNetCore.Mvc;
using System.Globalization;
using System.Diagnostics.Metrics;
using Microsoft.AspNetCore.Mvc;
using OpenTelemetry.Logs;
using OpenTelemetry.Metrics;
using OpenTelemetry.Resources;
using OpenTelemetry.Trace;
using OpenTelemetry.Instrumentation.AspNetCore;
using OpenTelemetry.Instrumentation.Http;
using Prometheus;


var builder = WebApplication.CreateBuilder(args);

const string serviceName = "roll-dice";


// Add services to the container.
builder.Services.AddControllers();

// Create a custom meter for the API
var meter = new Meter("roll-dice.Metrics", "1.0");


var httpRequestCounter = meter.CreateCounter<long>("http_requests_total", description: "Total number of HTTP requests");


builder.Logging.AddOpenTelemetry(options =>
{
    options
        .SetResourceBuilder(
            ResourceBuilder.CreateDefault()
                .AddService(serviceName))
        .AddConsoleExporter();
});

// Configure OpenTelemetry
builder.Services.AddOpenTelemetry()
    .WithTracing(tracerProviderBuilder =>
    {
        tracerProviderBuilder
            .SetResourceBuilder(ResourceBuilder.CreateDefault().AddService("roll-dice"))
            .AddAspNetCoreInstrumentation() // Tracks incoming HTTP requests
            .AddHttpClientInstrumentation()
            .AddConsoleExporter(); // Optional: For debugging
    })
    .WithMetrics(meterProviderBuilder =>
    {
        meterProviderBuilder
            .SetResourceBuilder(ResourceBuilder.CreateDefault().AddService("roll-dice"))
            .AddAspNetCoreInstrumentation() // Tracks incoming HTTP request metrics
            .AddHttpClientInstrumentation()
            .AddPrometheusExporter(); // Expose metrics to Prometheus
    });

// Add middleware to count HTTP requests
var app = builder.Build();

// Use the Prometheus middleware to expose the /metrics endpoint.
app.UseRouting();

app.UseHttpMetrics(); // Middleware for collecting HTTP metrics

app.UseEndpoints(endpoints =>
{
    endpoints.MapControllers();
    endpoints.MapMetrics(); // Expose the /metrics endpoint for Prometheus scraping
});


string HandleRollDice([FromServices]ILogger<Program> logger, string? player)
{
    var result = RollDice();

    if (string.IsNullOrEmpty(player))
    {
        logger.LogInformation("Anonymous player is rolling the dice: {result}", result);
    }
    else
    {
        logger.LogInformation("{player} is rolling the dice: {result}", player, result);
    }

    return result.ToString(CultureInfo.InvariantCulture);
}

int RollDice()
{
    return Random.Shared.Next(1, 7);
}

app.MapGet("/rolldice/{player?}", HandleRollDice);

app.Run();
Explanation of the OpenTelemetry Instrumentation code for .Net Application
1. Imports
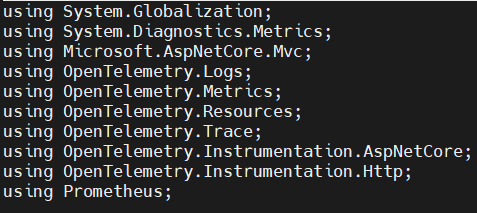
These lines import the necessary namespaces, including those for OpenTelemetry, ASP.NET Core, metrics, and Prometheus. Each namespace provides classes and methods for building the application’s telemetry and HTTP functionalities.
2. Creating the Web Application
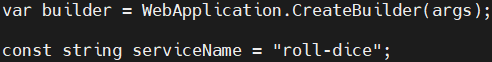
WebApplication.CreateBuilder(args) initializes the ASP.NET Core application builder.serviceName defines the name of the service, which is used later in telemetry to identify the source of traces and metrics.
3. Adding Services to the Container
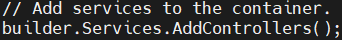
Adds support for controllers to the application, enabling the MVC framework and allowing you to handle HTTP requests using controller methods.
4. Creating a Custom Meter for Metrics

Creates a custom Meter named roll-dice.Metrics to track metrics for this application.
A counter metric called http_requests_total is defined to track the total number of HTTP requests.
5. Configuring OpenTelemetry for Logging

Configures OpenTelemetry to handle logging with the service name roll-dice.AddConsoleExporter() sets up console logging to output telemetry data, which is useful for debugging.
6. Configuring OpenTelemetry for Tracing and Metrics
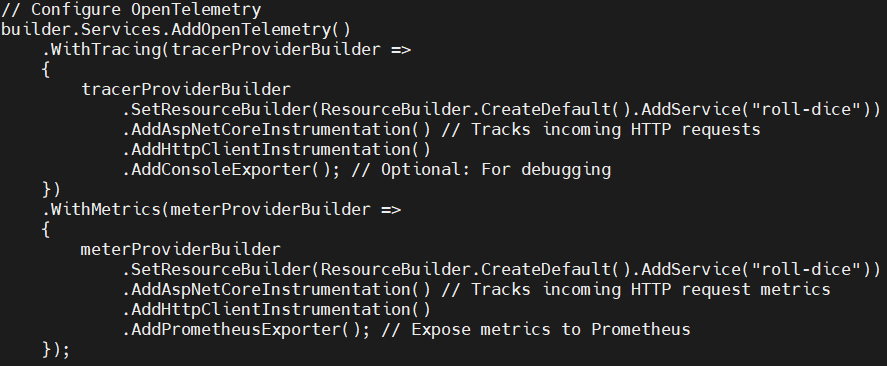
Configures OpenTelemetry tracing and http metrics:
- Tracing: Instruments HTTP requests, tracks HTTP client interactions, and exports trace data to the console.
- Metrics: Instruments HTTP request metrics and exposes them to Prometheus using the
AddPrometheusExporter()method.
7. Building the Application and Configuring Middleware

app.UseRouting() sets up request routing.app.UseHttpMetrics() integrates Prometheus HTTP metrics, which automatically tracks details about incoming HTTP requests.
8. Exposing the /metrics Endpoint

Maps endpoints for the controllers.MapMetrics() exposes the /metrics endpoint, allowing Prometheus to scrape metric data from the application.
9. Handling the /rolldice Endpoint
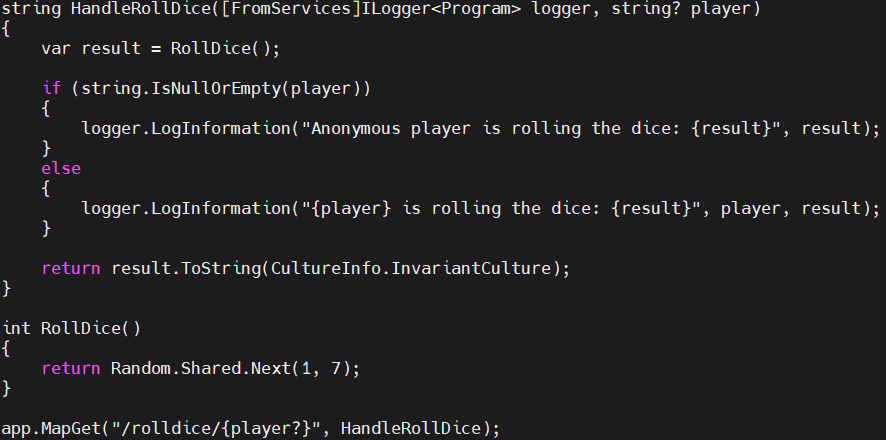
HandleRollDice method:
- Handles requests to the
/rolldiceendpoint. - Rolls a dice using the
RollDice()method and logs the result. - If a player name is provided, it logs the name; otherwise, it logs that an anonymous player is rolling the dice.
RollDice method:
- Generates a random number between 1 and 6, simulating a dice roll.
app.MapGet("/rolldice/{player?}", HandleRollDice);: Maps the /rolldice endpoint to the HandleRollDice method, making the dice-rolling logic accessible via HTTP requests.
10. Running the Application
Starts the web application and begins listening for incoming HTTP requests.
Next open the MyPrometheusApp.csproj file.
nano MyPrometheusApp.csproj
Update the packages to the latest versions.
“OpenTelemetry.Instrumentation.AspNetCore” Version=”1.7.0″ and “OpenTelemetry.Instrumentation.Http” Version=”1.7.0″
<Project Sdk="Microsoft.NET.Sdk.Web">

  <PropertyGroup>
    <TargetFramework>net8.0</TargetFramework>
    <Nullable>enable</Nullable>
    <ImplicitUsings>enable</ImplicitUsings>
  </PropertyGroup>

  <ItemGroup>
    <PackageReference Include="Microsoft.AspNetCore.OpenApi" Version="8.0.8" />
    <PackageReference Include="OpenTelemetry.Exporter.Console" Version="1.9.0" />
    <PackageReference Include="OpenTelemetry.Exporter.Prometheus.AspNetCore" Version="1.9.0-beta.2" />
    <PackageReference Include="OpenTelemetry.Extensions.Hosting" Version="1.6.0" />
    <PackageReference Include="OpenTelemetry.Instrumentation.AspNetCore" Version="1.7.0" />
    <PackageReference Include="OpenTelemetry.Instrumentation.Http" Version="1.7.0" />
    <PackageReference Include="prometheus-net.AspNetCore" Version="6.0.0" />
    <PackageReference Include="Swashbuckle.AspNetCore" Version="6.4.0" />
  </ItemGroup>

</Project>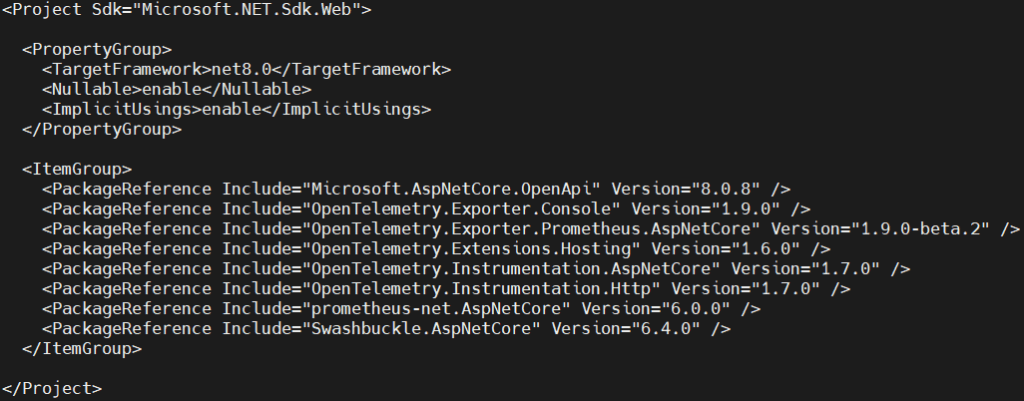
Explanation of the code:
This project file sets up the .NET web application to leverage modern observability tools and web standards.
- Project Definition: This part specifies that the project uses the Microsoft.NET.Sdk.Web SDK, which is specifically designed for building web applications using ASP.NET Core. It includes all the necessary tools and dependencies for web projects.
- PropertyGroup Section:
- TargetFramework: This property specifies the .NET version the application is targeting, which in this case is
.NET 8.0. It defines the version of the runtime and libraries that the application will use. - Nullable: Setting this to
enableenables nullable reference types in C#. It ensures that the code explicitly handlesnullvalues, reducing null reference errors and increasing code safety. - ImplicitUsings: When set to
enable, this feature automatically includes common using directives, so you don’t need to write them at the top of each file. This simplifies the code by implicitly including commonly used namespaces.
- TargetFramework: This property specifies the .NET version the application is targeting, which in this case is
- ItemGroup Section: This section lists all the external dependencies (NuGet packages) that the project requires.
Step #4:Build and Run the Application
To compile and run your application, use the following commands.
Build the application.
dotnet build
Run the application.
dotnet run
This will start the application, and it will expose the /metrics endpoint for Prometheus to scrape.
You can test your application by accessing the endpoint that returns the http metrics (e.g., http://<EC2-Instance-IP>:8080/metrics).
http://<EC2-Instance-IP>:8080/metrics
Conclusion:
By integrating OpenTelemetry and Prometheus with your .NET application, you can gain valuable insights into HTTP metrics, request counts, response times, and error rates. This observability setup helps ensure your application performs reliably and efficiently, making it easier to diagnose issues and improve its overall performance.
Related Articles:
How to Integrate OpenTelemetry for Java Project
Reference: