In this video, we deep dive into OpenTelemetry Collector — the backbone of modern observability systems.
Table of Contents
What is OpenTelemetry Collector?
•OpenTelemetry Collector is a standalone service for handling telemetry data.
•It receives, processes, and exports telemetry.
•Acts as a central pipeline between applications and observability backends.
•Can be deployed as:
–Agent
–Gateway
–Standalone service
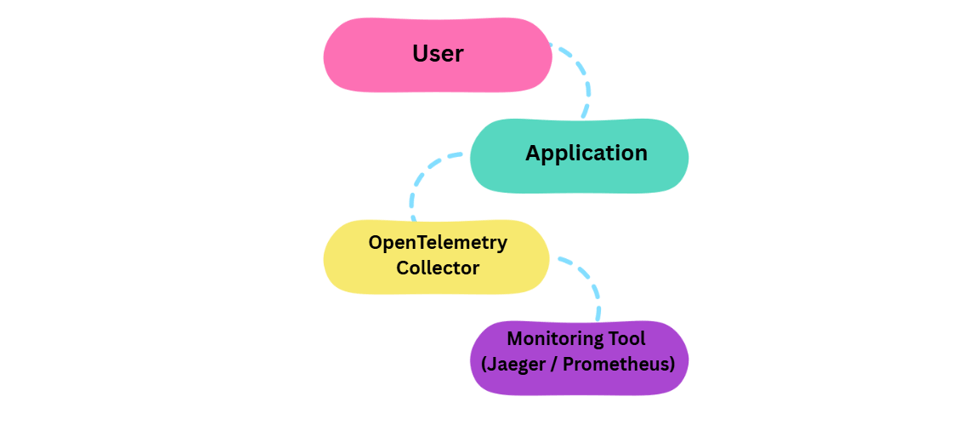
Real-Life Analogy
• App = Person sending letters
• Collector = Post Office
• Monitoring Tool = Final destination
• Instead of every app talking directly to tools:
– Apps send data to Collector
-Collector sends it to multiple tools
Why Do We Need a Collector?
• Avoids sending telemetry data directly from applications to vendors.
• Centralizes configuration and processing.
• Enables:
– Data filtering
– Enrichment
– Transformation
• Improves scalability and security.
• Makes backend changes easier without touching application code.
Collector Architecture
• Based on pipelines, separated by signal type.
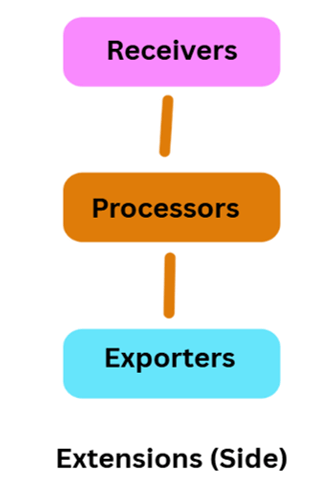
• Core components:
– Receivers
– Processors
– Exporters
– Extensions
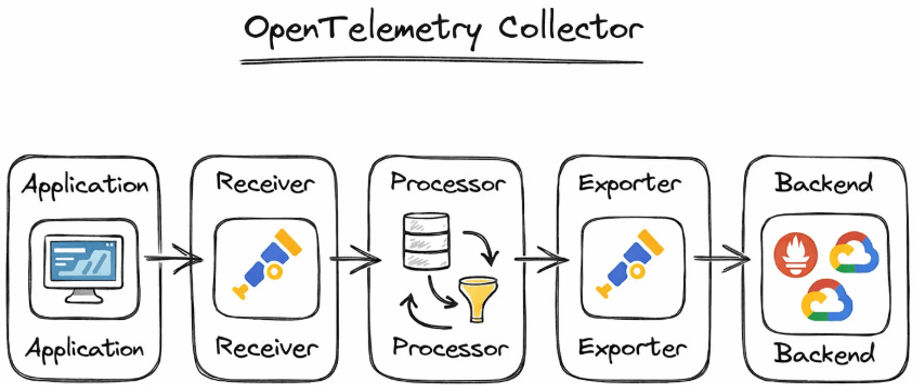
• Data flows in a defined order:
Receiver → Processor → Exporter
Optional connectors enable cross-signal transformation
Collector Architecture
Receivers
• Entry point for telemetry data in the OpenTelemetry Collector
• Receive data from applications, agents, or scrape sources
• Typically listen on network ports or actively collect data (scrapers)
• Support multiple protocols:
OTLP, Jaeger, Zipkin, Prometheus
• Accept data over HTTP, gRPC, and other transports
• A single receiver can send the same data to multiple pipelines
• Enable flexible and scalable data ingestion
Example Scenario (Conceptual)
• OTLP receiver receives traces from an application.
• The same trace data is sent to:
–One pipeline for long-term storage
–Another pipeline for real-time analysis
Note / Warning
• When a receiver is used in multiple pipelines, only one receiver instance is created.
• Data is fan-out to all attached pipelines synchronously.
• If one pipeline or processor blocks, it can:
–Delay other pipelines
–Stop the receiver from forwarding new data
• Careful pipeline design is required to avoid performance bottlenecks.
Processors
Processors in a Pipeline
• A pipeline contains processors connected sequentially
• The first processor receives data from one or more receivers
• The last processor sends data to one or more exporters
• Processors in between:
–Receive data from one preceding processor
–Send data to one succeeding processor
What Processors Can Do
• Batching: Groups telemetry data to reduce network calls and improve performance.
• Filtering: Removes unwanted or noisy data (e.g., health check traces).
• Sampling: Keeps only important traces to control data volume and reduce cost.
• Adding Metadata: Enriches telemetry with contextual information like environment, region, or service owner.
Processor Usage Across Pipelines
• The same processor name can be referenced in multiple pipelines
• Each pipeline gets its own processor instance
• Processor instances:
–Have independent state
–Are never shared across pipelines
• Configuration remains the same if the same processor key is used
Exporters
Send processed telemetry to observability backends
• Exporters are the final stage of the pipeline.
• They forward telemetry to monitoring and logging tools.
Examples (What each does)
🔸 Prometheus
• Stores and queries metrics.
• Used for dashboards and alerts.
🔸 Grafana Tempo
• Stores and visualizes traces.
• Enables distributed tracing.
🔸 Elasticsearch
• Stores logs and searchable data.
• Used with Kibana.
🔸 Datadog
• Full observability platform.
• Supports metrics, logs, and traces.
One pipeline can have multiple exporters
• Telemetry can be sent to more than one backend.
• Example:
–Metrics → Prometheus and Datadog
• Useful for:
–Migration
–Backup
–Multi-tool monitoring
Provide non-telemetry functionality
• Extensions support the Collector itself, not telemetry data.
• They improve how the Collector runs and is managed.
Do not process telemetry data directly
• Extensions do not modify, receive, or export data.
• They operate outside telemetry pipelines.
Improve Collector’s operability and security
Examples (Explained)
🔸 Authentication
• Adds security to incoming telemetry.
• Ensures only authorized clients send data.
🔸 Performance Monitoring
• Tracks Collector resource usage.
• Helps detect bottlenecks or failures.
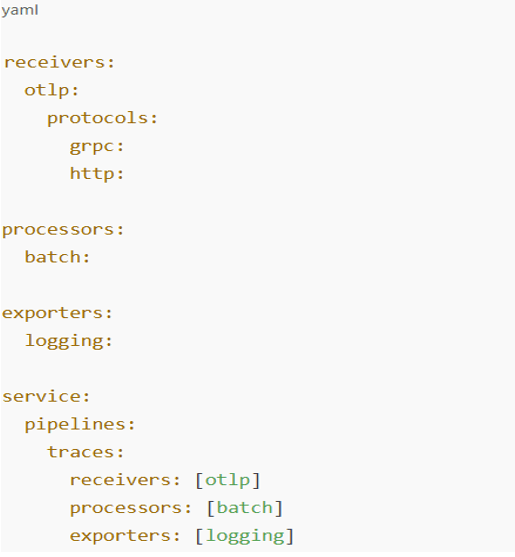
Simple Configuration Example
This YAML defines a simple trace pipeline where applications send data via OTLP, the Collector batches it, and outputs it to logs for debugging.
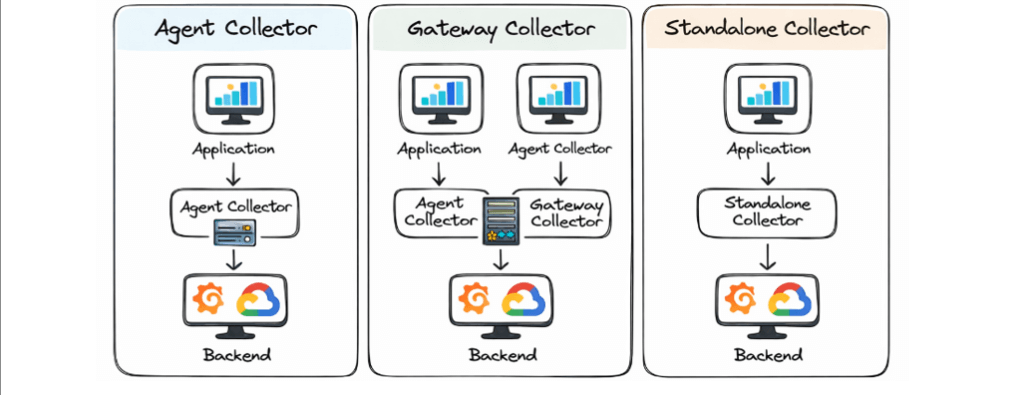
Types of Collectors
Agent Collector
• Runs alongside applications
• Collects local telemetry
Gateway Collector
• Centralized deployment
• Aggregates data from multiple agents
Standalone Collector
• Used in smaller or simpler setups
Data Flow Example
• Application generates traces and metrics.
• Data is sent to a Receiver.
• Processors batch and enrich data.
• Exporters send data to monitoring backend.
• Optional connectors generate derived signals.
Use Case
• Microservices-based application: Enables end-to-end observability across distributed services.
• Collect traces: Helps understand complete request flow across services.
• Generate metrics: Creates dashboards for performance and health monitoring.
• Export data: Sends telemetry to Grafana and Prometheus for visualization and alerts.
• Detect issues: Identifies performance bottlenecks and system failures quickly.
Benefits
• Centralized telemetry management: Manage all observability data in one place.
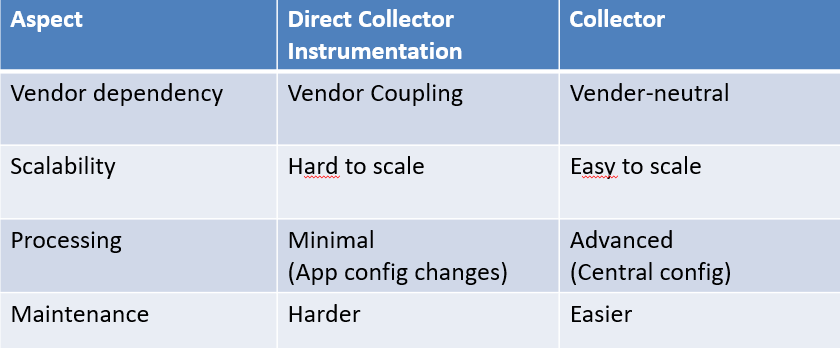
• Vendor-neutral observability: Avoid lock-in with any single monitoring tool.
• Scalability and performance: Handles high telemetry volumes efficiently.
• Reduced application complexity: Keeps observability logic out of application code.
• Flexible data processing: Customize telemetry before exporting.
Challenges
• Configuration complexity: Requires careful pipeline and component setup.
• Observability knowledge: Needs understanding of telemetry and system design.
• Resource usage: Consumes CPU and memory under heavy load.
• Pipeline debugging: Troubleshooting data flow can be challenging.
• Initial setup effort: Takes time to design and configure properly.
Collector vs Direct Instrumentation
Where is it used?
• Cloud-native applications: Provides observability for applications built on modern cloud platforms.
• Microservices architectures: Tracks and monitors interactions across multiple independent services.
• Kubernetes environments: Collects and manages telemetry from dynamic, containerized workloads.
• DevOps and SRE teams: Helps monitor system health, performance, and reliability.
• High-scale distributed systems: Ensures visibility and troubleshooting at a large scale.
Conclusion:
OpenTelemetry provides a standard, vendor-neutral approach to observability. The OpenTelemetry Collector acts as a central backbone for telemetry ingestion, processing, and export. Its modular architecture (Receivers, Processors, Exporters, Extensions) enables flexible and scalable pipelines. Supports modern cloud-native and microservices environments effectively. Helps teams gain deep visibility, improve performance, and ensure system reliability.