In this video, we deep dive into OpenTelemetry Exporters and explain how telemetry data flows from your application to observability backends in real-world production systems.
You’ll learn OpenTelemetry architecture, the role of exporters, OTLP exporter basics, and how exporters differ from collectors concepts that are frequently asked in DevOps, SRE, and Observability interviews.
Whether you’re a beginner, DevOps engineer, or backend developer, this video will help you confidently design scalable and production-ready observability pipelines.
Table of Contents
Why Do We Need Exporters?
OpenTelemetry can collect a lot of telemetry data, but collecting data alone has no value unless we can visualize and analyze it.
How Telemetry Works
- Instrumentation creates telemetry data
- SDK collects and manages this data
- Data remains inside the application
- Exporter sends data outside the application
Exporter = Courier Service
SDK packs the data → Exporter delivers it → Backend receives it
OpenTelemetry Architecture
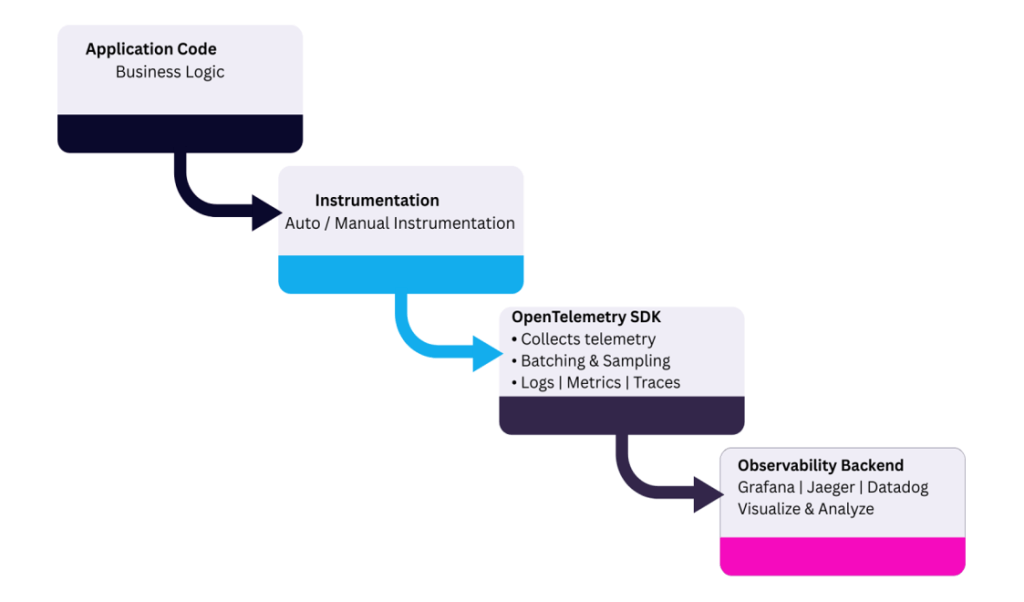
Role of Exporter in Opentelemetry Architecture
1. Last component inside the application
Exporter is the final stage of telemetry processing within the app
After this point, data leaves the application boundary
2. Sends processed telemetry data
Exports already processed data from the OpenTelemetry SDK
Works with batched, sampled, and formatted logs, metrics, and traces
3. Connects application with monitoring tools
Acts as a communication bridge between the app and observability backends
Enables integration with tools like Grafana, Jaeger, Prometheus, Datadog
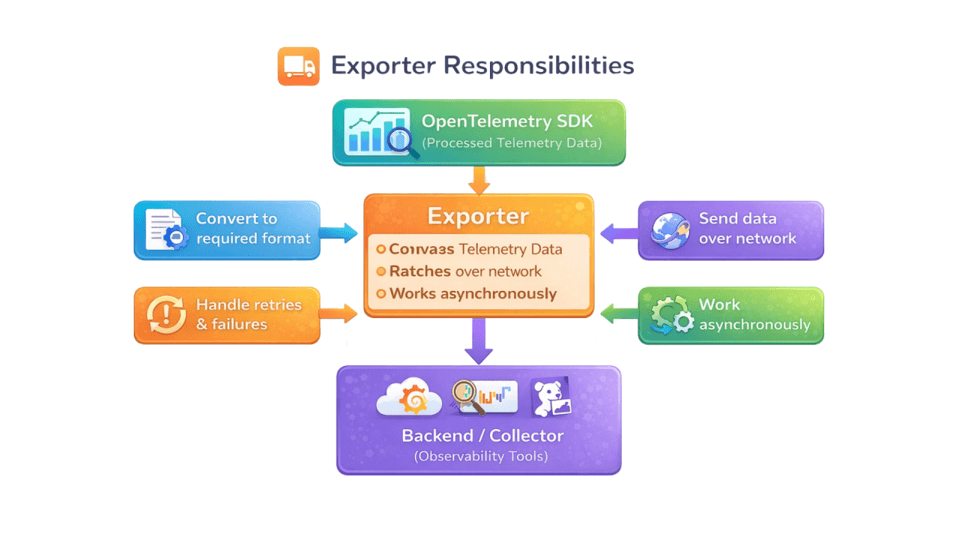
What Exactly Does an Exporter Do?
- Converts telemetry data format
- Sends data over network (HTTP/gRPC)
- Handles retries and failures
- Works asynchronously
What Exporter Does NOT Do?
- Does not create spans
- Does not decide sampling
- Does not store data
- Focuses only on delivery
Span created → SDK batches → Exporter sends every 5 seconds
Exporter is delivery-focused, not logic-focused
Types of Exporters in Opentelemetry
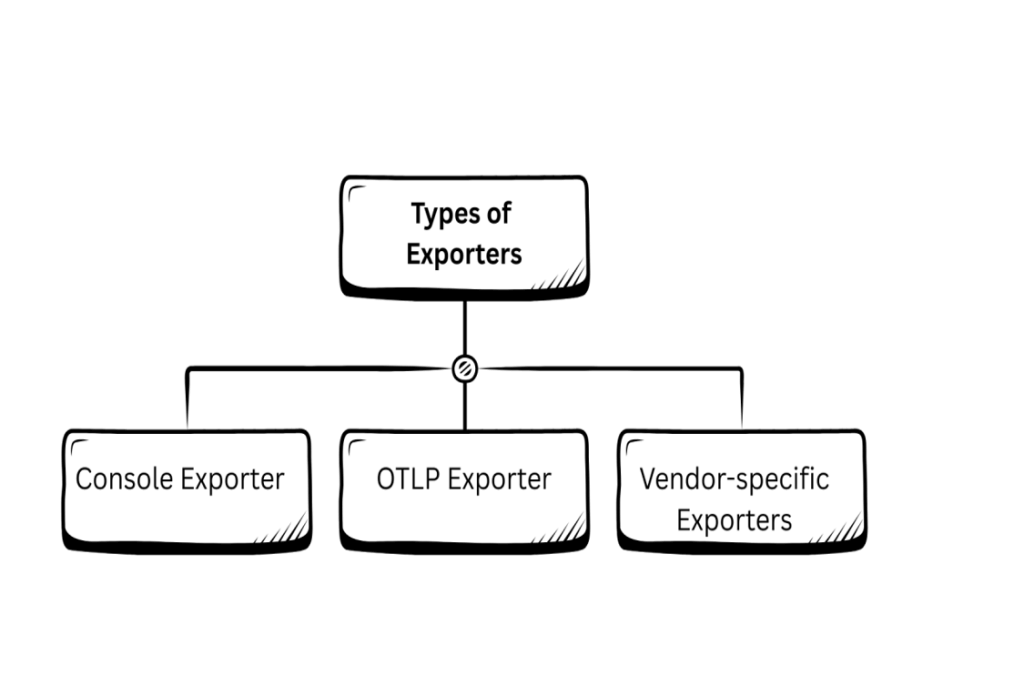
Console Exporter
- Prints telemetry to console
- Used for learning and debugging
- Not suitable for production
Example – Trace → printed on console
Instrumentation → SDK → Console Exporter → [Terminal Output]
Telemetry printed here:
Span ID: abc123
TraceID: xyz789
Duration: 200 ms
Attributes: {user=Alice}
OTLP Exporter (Recommended)
What is OTLP?
- OTLP (OpenTelemetry Protocol) is the native protocol of OpenTelemetry
- Designed specifically to export telemetry data efficiently
What does OTLP support?
- Traces – request flow and performance
- Metrics—system and application measurements
- Logs – application events
- Single protocol for all telemetry signal
Transport Options
- gRPC → Port 4317 (high performance, binary)
- HTTP → Port 4318 (simple and widely supported)
OTLP Exporter – Data Flow
App → OTLP Exporter → Collector → Backend
Why Is OTLP Preferred?
- Uses a standard OpenTelemetry format
- Backend-agnostic (no vendor lock-in)
- Supports all telemetry signals: Traces, metrics, and Logs
- Works seamlessly with OpenTelemetry Collector
- gRPC (4317)—high performance
- HTTP (4318)—easy setup
- Recommended approach in OpenTelemetry documentation
OTLP Exporter – Configuration
Exporter Requires:
- Endpoint:
-Address of Collector or Backend - Protocol:
– gRPC (default, high performance)
– HTTP (simple and flexible) - Timeout:
-Maximum wait time for export - Retry Policy:
-Handles temporary failures
-Helps prevent data loss
Vendor-Specific Exporters
What are Vendor-Specific Exporters?
- Exporters designed to send telemetry data to one specific backend
- Tightly coupled with a particular observability tool
Common Examples
- Jaeger Exporter → Jaeger backend
- Zipkin Exporter → Zipkin backend
- Prometheus Exporter → Prometheus backend
Drawbacks
- Vendor lock-in
- Exporter tied to a single tool
- Harder to switch backends
- Requires code/config changes when migrating tools
Exporter vs Collector
| Exporter | Collector |
| Runs inside app | Runs as service |
| Sends data | Receives + processes |
| Limited logic | Advanced pipelines |
Exporter sends data out, Collector decides what to do next
Exporters Inside Collector
Exporters exist at two levels in OpenTelemetry:
-SDK level
-Collector level
- SDK Exporter
-Runs inside the application
-Sends telemetry data out of the app
-Usually sends data to the Collector - Collector Exporter
-Runs inside the OpenTelemetry Collector
-Sends processed telemetry data to the final backend
End-to-End Data Flow
SDK Exporter → Collector → Collector Exporter → Backend
Best Practices for Exporter
Recommended Setup
Application → OTLP Exporter → Collector → Backend
Best Practices
- Avoid direct vendor exporters
- Use OTLP Exporter
- Always use Collector
- Use batching
- Use retry logic
- Never block app threads
Interview & Production Takeaways
- Exporter sends, Collector decides
- Always use OTLP + Collector
- Avoid vendor lock-in
- Observability = DevOps maturity
- Collector is mandatory in production