In this article we are going to cover Elastic Stack Tutorial for Beginners: A Complete Guide to ELK (Elasticsearch, Logstash, Kibana, Beats).
The Elastic Stack, also known as the ELK Stack, is a powerful set of open-source tools for real-time data ingestion, analysis, and visualization. It’s widely used for centralized logging, monitoring, and observability across applications and infrastructure.
Table of Contents
What Is the Elastic Stack?
The Elastic Stack is a suite of tools developed by Elastic to manage, search, and visualize log data from various sources in real time. It includes:
- Elasticsearch – A distributed search and analytics engine
- Logstash – A data collection and processing pipeline
- Kibana – A dashboard and visualization tool
- Beats – Lightweight shippers that send data from edge systems
Why Use the Elastic Stack?
- Real-Time Analysis: Quickly ingest and analyze large volumes of data
- Scalability: Handle high-throughput systems with horizontal scaling
- Flexibility: Works with structured, unstructured, and time-series data
- Security & Observability: Full-stack visibility with Elastic Security and APM
- Open Source: Freely available with enterprise-grade capabilities
Core Components of the Elastic Stack
Elasticsearch
Elasticsearch is the core engine that stores and indexes data.
Features:
- Near real-time search and analytics
- Scalable (shards/replicas)
- Full-text search capabilities
- RESTful API
Use Cases:
- E-commerce product search
- Log and metrics analytics
- Business dashboards
Logstash
Logstash collects, transforms, and forwards data from diverse sources.
Key Features:
- Input Plugins (files, Kafka, DBs)
- Filter Plugins (e.g., grok, mutate)
- Output Plugins (e.g., Elasticsearch, S3)
Kibana
Kibana lets you visualize Elasticsearch data through intuitive dashboards and charts.
Features:
- Discover tab for searching raw data
- Visualizations (Lens, TSVB)
- Dashboards for custom reports
- Developer tools for querying
- Optional: Machine Learning and Maps for advanced analytics
Beats
Beats are small agents that ship data to Logstash or Elasticsearch.
Types of Beats:
- Filebeat: Sends log files
- Metricbeat: Collects metrics from OS/apps
- Packetbeat: Analyzes network traffic
- Winlogbeat: Gathers Windows event logs
- Heartbeat: Monitors service uptime
- Auditbeat: Captures audit and security logs
- Functionbeat: Designed for cloud services (e.g., AWS Lambda)
Advantages:
- Lightweight and efficient (written in Go)
- Deployable on edge or remote systems
Elastic Stack Architecture
Data Sources ─▶ Beats ─▶ [Logstash] ─▶ Elasticsearch ─▶ Kibana
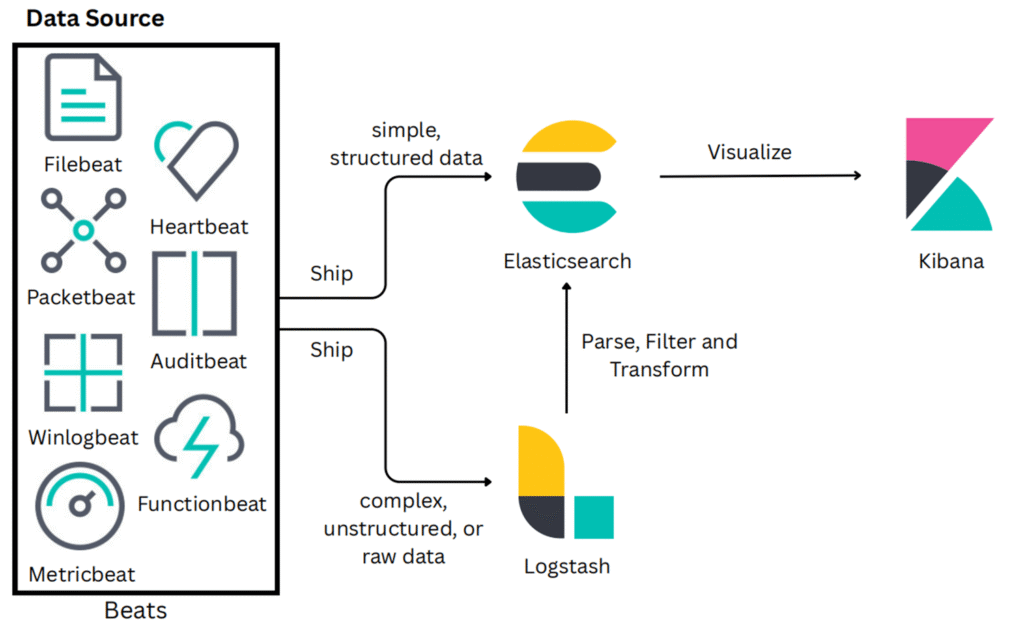
- Simple data: Beats → Elasticsearch
- Complex data: Beats → Logstash → Elasticsearch
Kibana visualizes data stored in Elasticsearch, allowing users to analyze trends, discover anomalies, and build dashboards.
Elastic Stack (ELK) Architecture Explanation
Data Sources & Beats:
Beats collect and ship data from various sources:
- Simple, structured data is sent directly to Elasticsearch.
- Complex, unstructured, or raw data is first sent to Logstash.
Logstash:
- Logstash processes, filters, and transforms raw data before sending it to Elasticsearch.
Elasticsearch:
- Elasticsearch stores and indexes the processed data.
Kibana:
- Kibana visualizes the stored data for analysis and insights.
Types of Beats and Their Roles:
- Filebeat: Collects and forwards log files from applications, services, and system logs.
- Packetbeat: Captures network traffic and provides insights into network activity.
- Winlogbeat: Specifically designed to collect Windows event logs.
- Metricbeat: Gathers system- and service-level performance metrics (CPU, memory, disk usage, etc.).
- Heartbeat: Checks the availability and response time of services and endpoints (uptime monitoring).
- Auditbeat: Monitors audit logs for security and compliance insights.
- Functionbeat: Collects logs and metrics from cloud-based services like AWS Lambda.
Use Cases of the Elastic Stack
- Log and Event Monitoring: Centralize application and system logs
- Security Analytics: Detect intrusions, analyze behavior, SIEM
- Business Intelligence: Monitor KPIs and business metrics
- APM (Application Performance Monitoring): Observe app behavior
- Infrastructure Monitoring: Track servers, containers, and cloud services
- Search and Recommendation Engines: Power real-time product search
Key Benefits
- Real-time data access and visualization
- Horizontal scaling for high volumes
- Full-text and structured search capabilities
- Custom dashboards for deep insights
- Machine learning integration for anomaly detection
- Secure, open-source, and cloud-ready
Competitors in the Market
| Tool | Key Focus | Limitation |
|---|---|---|
| Splunk | Enterprise logging & analytics | Expensive licensing |
| Datadog | SaaS observability & APM | Less control over deployment |
| Graylog | Open-source logging | Smaller community than Elastic |
| Sumo Logic | Cloud-native log analytics | Proprietary features |
| Loki (Grafana) | Log aggregation + Grafana | Limited full-text search |
| New Relic | APM and observability | Primarily app monitoring, less logs |
Elastic Stack in the Market
- Market Share: 33.65% in hosted search (2023)
- Over 100M+ downloads
- Top 3 SIEM tool for security analytics
- Elastic Cloud SaaS growing rapidly (50% YoY)
- Strong Dev & Community Support: REST APIs, Kibana UI, GitHub stars, forums
Elastic Stack Tutorial for Beginners
We have categorized below Basic Practical Elastic Stack Tutorial for Beginners which will help to those who want to start learning Elastic Stack.
Getting Started with Installation
Whether you’re using Ubuntu, CentOS, Amazon Linux, or Windows, here are detailed setup guides to get your Elastic Stack running:
- How to Install ELK Stack on Ubuntu 18.04/16.04 LTS
- How to Install Elastic Stack on Ubuntu 20.04 LTS
- How to Install Elastic Stack on Ubuntu 22.04 LTS
- How to Install Elastic Stack on Ubuntu 24.04 LTS
- How to Install Elasticsearch on Ubuntu 20.04/18.04/16.04 LTS
- How to Install Elasticsearch 8 on Ubuntu 20.04 LTS
- How to Install Elasticsearch on CentOS 7
- How to Install Elastic Stack on CentOS 7
- Install Elastic Stack on Amazon Linux 2
- Set Up ELK Stack (Elasticsearch, Logstash and Kibana) On Windows
Log Ingestion Examples and Use Cases
Here are practical guides for forwarding logs from various platforms and services into the Elastic Stack:
- How to Send Docker Container Logs to Elastic Stack
- Send Apache2 Logs to Elastic Stack and Filebeat
- Send Nginx Logs to Elastic Stack and Filebeat
- Send Java Maven App Logs to Elastic Stack
- Send Java Gradle App Logs to Elastic Stack
- Monitor Python App Logs with Elastic Stack
- Monitor Kafka logs using Elastic Stack
- Monitor .NET App Logs Using Elastic Stack
Kubernetes and Elastic Stack Integration
Use Elastic Stack to manage container logs in Kubernetes environments:
Observability and Dashboards
Explore advanced observability features and dashboards in Elastic Stack:
- Observability Dashboard Overview in Elastic Stack
- Observability Dashboard Overview in Elastic Stack (Logs and Infrastructure) – Part 2
Conclusion:
The Elastic Stack—comprising Elasticsearch, Logstash, Kibana, and Beats—offers a powerful, flexible, and scalable solution for real-time data ingestion, analysis, and visualization. Whether you’re just starting with log management or looking to build a robust observability pipeline, mastering the ELK Stack equips you with the tools needed to gain valuable insights from your data. With its wide range of use cases, from monitoring infrastructure to analyzing application performance, Elastic Stack remains a go-to choice for developers, DevOps engineers, and data analysts alike. As you continue exploring its capabilities, you’ll find endless opportunities to optimize system visibility, troubleshoot issues faster, and make informed decisions backed by data.
Reference: