In this article we will learn How to Install Elastic Stack on Amazon Linux 2. The Elastic Stack (formerly ELK Stack) is a collection of tools — Elasticsearch, Logstash, Kibana, and Beats — used for searching, analyzing, and visualizing data in real-time. It is a popular choice for monitoring, log management, and data analytics. In this guide, you’ll learn how to install and set up Elastic Stack on Amazon Linux 2, enabling you to manage and visualize your system logs efficiently.
Table of Contents
Prerequisites
- AWS Account with Amazon Linux 2 EC2 Instance.
- At least 2 CPU cores and 4 GB of RAM for smooth performance.
- Ensure the instance’s security group allows inbound traffic on ports 9200, 5601, and 5044.
Step #1:Install Java on Amazon Linux 2
First make sure launch instance of Amazon Linux 2 AMI (HVM) as shown below.

Elastic Stack components require Java. Install OpenJDK 11 as follows,
First update the system’s package index.
sudo yum update -y
Import the Corretto GPG key. Corretto 11 (Amazon’s distribution of OpenJDK).
sudo rpm --import https://yum.corretto.aws/corretto.key
add the yum repository.
sudo curl -L -o /etc/yum.repos.d/corretto.repo https://yum.corretto.aws/corretto.repo
Install OpenJDK 11.
sudo yum install -y java-11-amazon-corretto
Verify the installation.
java -version
Step #2:Install Elasticsearch on Amazon Linux 2
Import the Elasticsearch GPG key.
sudo rpm --import https://artifacts.elastic.co/GPG-KEY-elasticsearch
Add the Elasticsearch repository to the package manager by writing the configuration to a new .repo file.
sudo tee /etc/yum.repos.d/elasticsearch.repo <<EOF
[elasticsearch]
name=Elasticsearch repository
baseurl=https://artifacts.elastic.co/packages/8.x/yum
gpgcheck=1
gpgkey=https://artifacts.elastic.co/GPG-KEY-elasticsearch
enabled=1
autorefresh=1
type=rpm-md
EOF
Install Elasticsearch using the Yum package manager.
sudo yum install elasticsearch -y
Enable and start the Elasticsearch.
sudo systemctl enable elasticsearch
sudo systemctl start elasticsearch
Verify Elasticsearch is running.
sudo systemctl status elasticsearch
Step #3:Configure Elasticsearch on Amazon Linux 2
To allow connections to Elasticsearch, edit the configuration file.
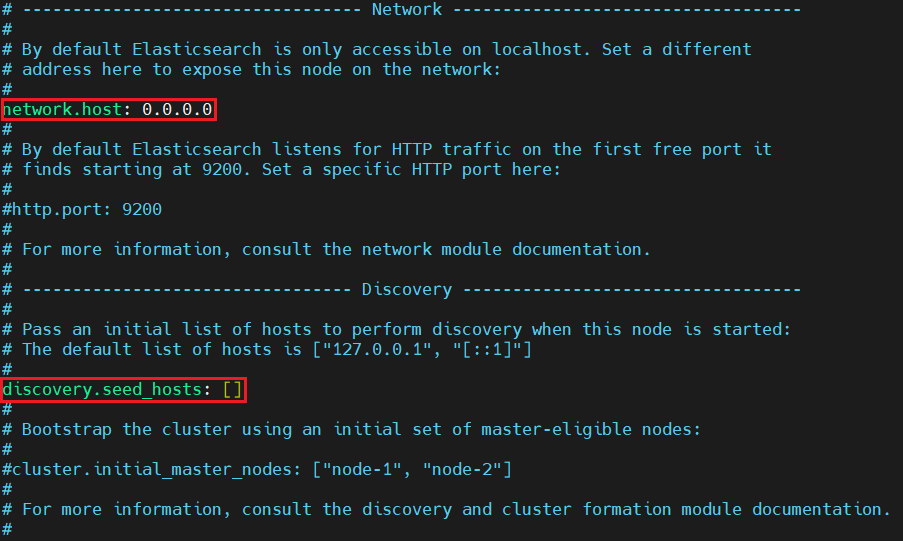
sudo nano /etc/elasticsearch/elasticsearch.yml
Find the network.host setting, uncomment it, and set it to 0.0.0.0 to bind to all available IP addresses and uncomment the discovery section to specify the initial nodes for cluster formation discovery.seed_hosts: []
For a basic setup (not recommended for production), disable security features.
xpack.security.enabled: false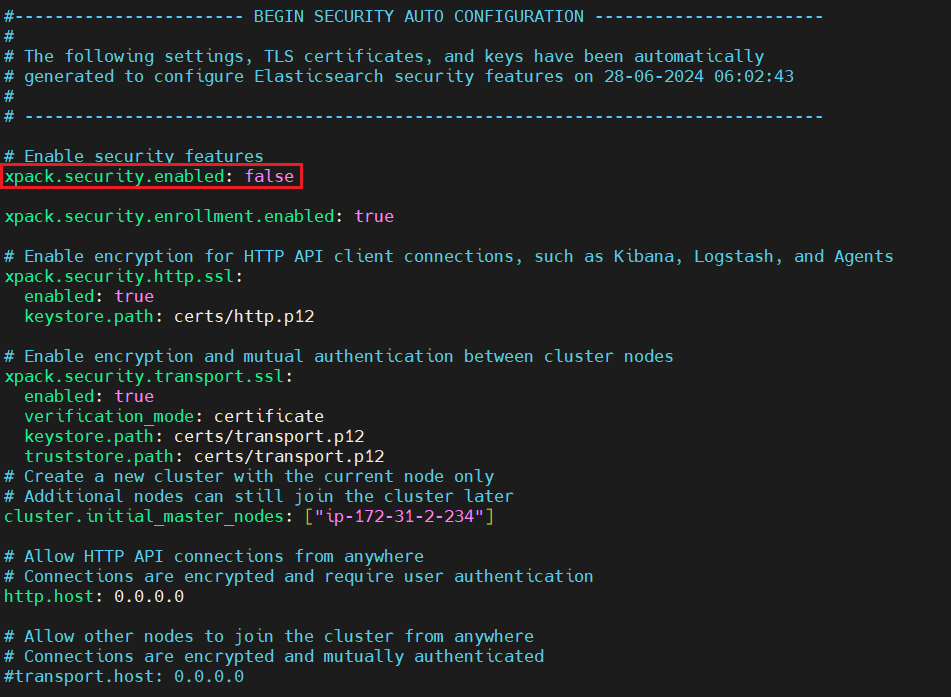
Save and exit the editor.
Restart Elasticsearch to apply the changes.
sudo systemctl restart elasticsearch

Check if Elasticsearch is running without errors.
sudo systemctl status elasticsearch
Send a GET request to check if Elasticsearch is running and responding. If successful, you should see a JSON response with cluster information.
curl -X GET "localhost:9200"
You can access it using browser with your Public IP address:9200 port which is a default port for Elasticksearch.

Step #4:Install Logstash on Amazon Linux 2
Logstash processes and transforms logs before sending them to Elasticsearch. Install Logstash on the system.
sudo yum install logstash -y
Set up Logstash to receive logs from Filebeat and forward them to Elasticsearch.
Create the Logstash configuration file.
sudo nano /etc/logstash/conf.d/logstash.conf
Add the following code into it.
input {
  beats {
    port => 5044
  }
}
output {
  if [@metadata][pipeline] {
	elasticsearch {
  	hosts => ["localhost:9200"]
  	manage_template => false
  	index => "%{[@metadata][beat]}-%{[@metadata][version]}-%{+YYYY.MM.dd}"
  	pipeline => "%{[@metadata][pipeline]}"
	}
  } else {
	elasticsearch {
  	hosts => ["localhost:9200"]
  	manage_template => false
  	index => "%{[@metadata][beat]}-%{[@metadata][version]}-%{+YYYY.MM.dd}"
	}
  }
}
Enable and start Logstash.
sudo systemctl enable logstash
sudo systemctl start logstash
Verify the status of the Logstash service.
sudo systemctl status logstash
Step #5:Install Kibana on Amazon Linux 2
Kibana provides visualization for Elasticsearch data. Install Kibana on the system.
sudo yum install kibana -y
Enable and start Kibana.
sudo systemctl enable kibana
sudo systemctl start kibana
Checks the status of Kibana.
sudo systemctl status kibana
Open the Kibana configuration file for editing.
sudo nano /etc/kibana/kibana.yml
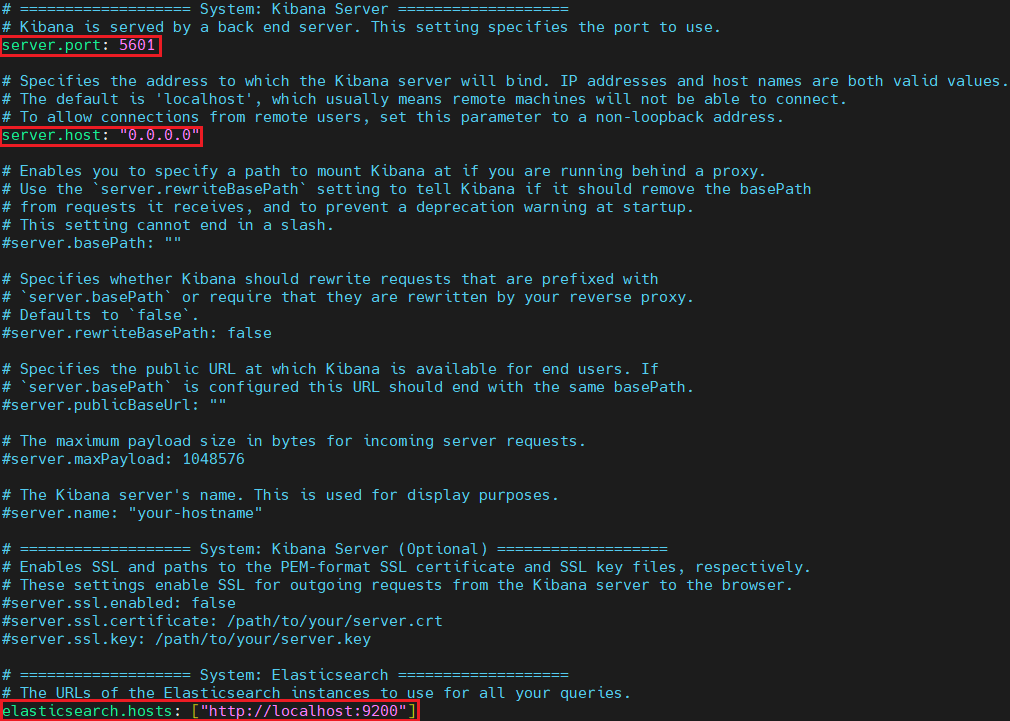
Uncomment and adjust the following lines to bind Kibana to all IP addresses and connect it to Elasticsearch.
server.port: 5601
server.host: "0.0.0.0"
elasticsearch.hosts: ["http://localhost:9200"]
Restart Kibana to apply the changes.
sudo systemctl restart kibana

Access the Kibana interface by navigating to http://<your-server-ip>:5601 in your web browser. This will open the Kibana dashboard where you can start exploring your data.

You can start by adding integrations or Explore on my own.

Step #6:Install Filebeat on Amazon Linux 2
Filebeat collects and forwards log data to Elasticsearch or Logstash. Install Filebeat on the system.
sudo yum install filebeat -y
Open the Filebeat configuration file for editing.
sudo nano /etc/filebeat/filebeat.yml

Comment out the Elasticsearch output section.
# output.elasticsearch:
 #  hosts: ["localhost:9200"]
Uncomment and configure the Logstash output section.
output.logstash:
  hosts: ["localhost:5044"]

Enable the system module, which collect system logs.
sudo filebeat modules enable system
Open the system module configuration file.
sudo nano /etc/filebeat/modules.d/system.yml
Make sure that the following filesets is enabled (set to true).
# Module: system
# Docs: https://www.elastic.co/guide/en/beats/filebeat/8.17/filebeat-module-system.html

- module: system
  # Syslog
  syslog:
    enabled: true

    # Set custom paths for the log files. If left empty,
    # Filebeat will choose the paths depending on your OS.
    #var.paths:

    # Use journald to collect system logs
    #var.use_journald: false

  # Authorization logs
  auth:
    enabled: true

    # Set custom paths for the log files. If left empty,
    # Filebeat will choose the paths depending on your OS.
    #var.paths:

    # Use journald to collect auth logs
    #var.use_journald: false
Run the following command to apply the changes.
sudo filebeat setup --pipelines --modules system
Set up Filebeat to load the index template into Elasticsearch.
sudo filebeat setup --index-management -E output.logstash.enabled=false -E 'output.elasticsearch.hosts=["0.0.0.0:9200"]'
Filebeat comes with preconfigured Kibana dashboards, which provide visual representations of the data collected by Filebeat. However, before using these dashboards, you need to create an index pattern and load them into Kibana.
When loading dashboards, Filebeat connects to Elasticsearch to check the version compatibility. If you’re using Logstash, you need to temporarily disable its output and enable direct communication with Elasticsearch and Kibana
sudo filebeat setup -E output.logstash.enabled=false -E output.elasticsearch.hosts=['localhost:9200'] -E setup.kibana.host=localhost:5601
Once the dashboards are loaded, you can start visualizing your log data in Kibana, making it easier to analyze trends, detect anomalies, and monitor system activity.
Start and enable the Filebeat service.
sudo systemctl start filebeat
sudo systemctl enable filebeat
Ensure Elasticsearch is receiving data from Filebeat by checking the indices.
curl -XGET "localhost:9200/_cat/indices?v"You should see output indicating the presence of indices created by Filebeat.

You can access it using browser using http://<your-server-ip>:9200/_cat/indices?v

Now go back to Kibana. Click on the Discover option in the left-hand navigation menu. If the menu is collapsed, click the Expand icon at the bottom left to reveal the options.

On the Discover page, select the filebeat-* index pattern to access Filebeat data. By default, Kibana displays log data from the last 15 minutes, visualized as a histogram along with individual log messages below.

Conclusion:
We’ve successfully installed and configured Elastic Stack on Amazon Linux 2. This includes setting up Elasticsearch, Logstash, Kibana, and Filebeat for centralized logging and data analysis. With Elasticsearch handling data storage, Logstash for processing, Kibana for visualization, and Beats for data collection, you now have a powerful toolset for managing and analyzing your system’s data.
Related Articles:
How to Install Elastic Stack on Ubuntu 24.04 LTS
Secure Nginx with Certbot and Let’s Encrypt on Ubuntu 24.04 LTS
Reference: