In this article, we will learn how to install the Elastic Stack on Ubuntu 24.04 LTS. The ELK Stack consists of Elasticsearch, Logstash, and Kibana, with Filebeat often used to ship logs to Logstash. This powerful combination is essential for centralized logging, data visualization, and real-time analysis. We will guide you through the installation and configuration of each component of the ELK stack and verify their setup.
Table of Contents
Prerequisites
- AWS Account with Ubuntu 24.04 LTS EC2 Instance.
- At least 2 CPU cores and 4 GB of RAM for smooth performance.
Step #1:Install Java for Elastic Stack on Ubuntu 24.04 LTS
Start by updating your system’s package index.
sudo apt update
Install the apt-transport-https package to access repository over HTTPS.
sudo apt install apt-transport-https

Elastic Stack components require Java. We will install OpenJDK 11, which is a widely used open-source implementation of the Java Platform.
sudo apt install openjdk-11-jdk -y
After installation, verify that Java is correctly installed by checking its version.
java -version
To ensure stack components can locate Java, we need to set the JAVA_HOME environment variable. Open the environment file.
sudo nano /etc/environment
Add the following line at the end of the file.
JAVA_HOME="/usr/lib/jvm/java-11-openjdk-amd64"Apply the changes by reloading the environment.
source /etc/environment
Verify that JAVA_HOME is set correctly.
echo $JAVA_HOME
Step #2:Install ElasticSearch on Ubuntu 24.04 LTS
Elasticsearch is the core component of the ELK Stack, used for search and analytics. We need to import the public signing key and add the Elasticsearch APT repository to your system.
wget -qO - https://artifacts.elastic.co/GPG-KEY-elasticsearch | sudo gpg --dearmor -o /usr/share/keyrings/elasticsearch-keyring.gpg
Add the repository definition.
echo "deb [signed-by=/usr/share/keyrings/elasticsearch-keyring.gpg] https://artifacts.elastic.co/packages/8.x/apt stable main" | sudo tee /etc/apt/sources.list.d/elastic-8.x.list
Update the package lists again to include the new Elasticsearch repository.
sudo apt-get update

Install Elasticsearch.
sudo apt-get install elasticsearch

Start Elasticsearch and configure it to run at system startup.
sudo systemctl start elasticsearch
sudo systemctl enable elasticsearch

Verify that Elasticsearch is running.
sudo systemctl status elasticsearch
You should see output indicating that the service is active and running.

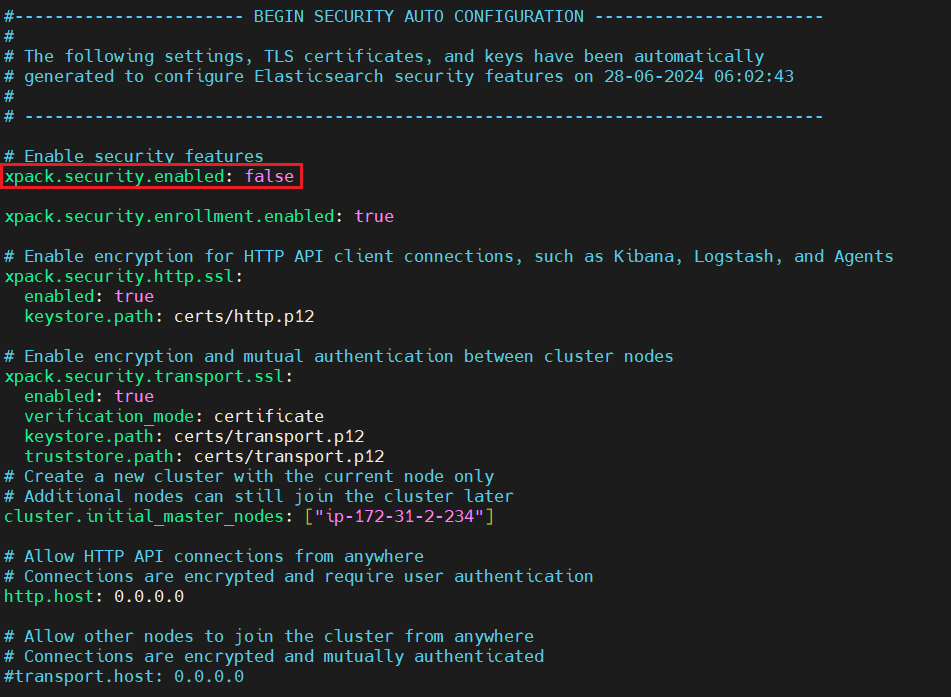
Step #3:Configure Elasticsearch on Ubuntu 24.04 LTS
To allow external access to Elasticsearch, modify the configuration file.
sudo nano /etc/elasticsearch/elasticsearch.yml

Find the network.host setting, uncomment it, and set it to 0.0.0.0 to bind to all available IP addresses and uncomment the discovery section to specify the initial nodes for cluster formation discovery.seed_hosts: []
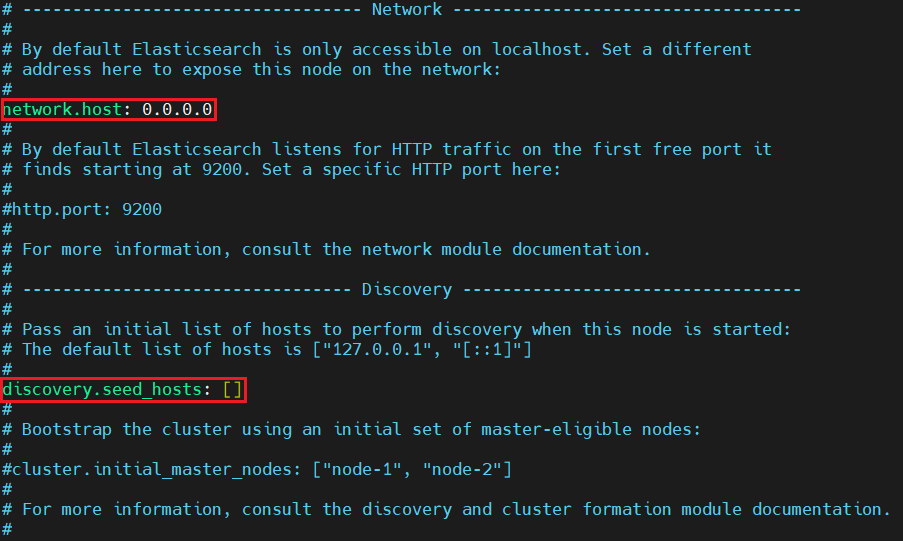
For a basic setup (not recommended for production), disable security features.
Restart Elasticsearch to apply the changes.
sudo systemctl restart elasticsearch

To confirm that Elasticsearch is set up correctly, send a test HTTP request using curl.
curl -X GET "localhost:9200"
You should see a JSON response.

You can access it using browser with your Public IP address:9200 port which is a default port for Elasticksearch.

Step #4:Install Logstash on Ubuntu 24.04 LTS
Logstash is used to process and forward log data to Elasticsearch. Install Logstash using following command.
sudo apt-get install logstash -y

Start and enable Logstash.
sudo systemctl start logstash
sudo systemctl enable logstash

Verify the service status.
sudo systemctl status logstash

Step #5:Install Kibana on Ubuntu 24.04 LTS
Kibana provides a web interface for visualizing data from Elasticsearch. Install Kibana using following command.
sudo apt-get install kibana

Start and enable the Kibana service.
sudo systemctl start kibana
sudo systemctl enable kibana

Check the status of Kibana:
sudo systemctl status kibana

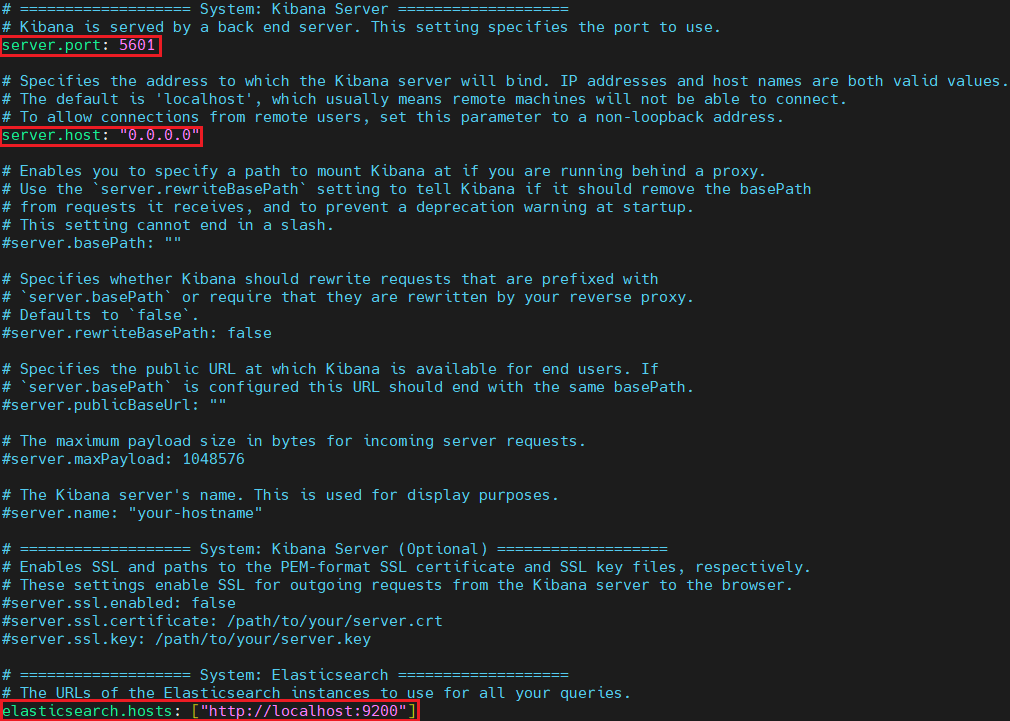
Step #6:Configure Kibana on Ubuntu 24.04 LTS
To configure Kibana for external access, edit the configuration file.
sudo nano /etc/kibana/kibana.yml

Uncomment and adjust the following lines to bind Kibana to all IP addresses and connect it to Elasticsearch.
server.port: 5601
server.host: "0.0.0.0"
elasticsearch.hosts: ["http://localhost:9200"]
Restart Kibana to apply the changes.
sudo systemctl restart kibana

Access the Kibana interface by navigating to http://<your-server-ip>:5601 in your web browser. This will open the Kibana dashboard where you can start exploring your data.

You can start by adding integrations or Explore on my own.

Step #7:Install Filebeat on Ubuntu 24.04 LTS
Filebeat is a lightweight shipper used to forward and centralize log data. Install Filebeat using following command.
sudo apt-get install filebeat

Open the Filebeat configuration file to send logs to Logstash.
sudo nano /etc/filebeat/filebeat.yml

Comment out the Elasticsearch output section.
# output.elasticsearch:
 #  hosts: ["localhost:9200"]
Uncomment and configure the Logstash output section.
output.logstash:
  hosts: ["localhost:5044"]

Enable the system module, which collects log data from the local system.
sudo filebeat modules enable system

Set up Filebeat to load the index template into Elasticsearch.
sudo filebeat setup --index-management -E output.logstash.enabled=false -E 'output.elasticsearch.hosts=["0.0.0.0:9200"]'

Start and enable the Filebeat service.
sudo systemctl start filebeat
sudo systemctl enable filebeat

Ensure Elasticsearch is receiving data from Filebeat by checking the indices.
curl -XGET "localhost:9200/_cat/indices?v"
You should see output indicating the presence of indices created by Filebeat.

You can access it using browser using http://<your-server-ip>:9200/_cat/indices?v

Conclusion:
In conclusion, we have successfully installed and configured the Elastic Stack on Ubuntu 24.04 LTS. This included setting up Elasticsearch for search and analytics, Logstash for data processing, Kibana for data visualization, and Filebeat for log shipping. The Elastic Stack provides a robust solution for centralized logging and data analysis, making it invaluable for monitoring and analyzing system performance and application logs.
Related Articles:
Python Script to Parse Nginx Log Files
Reference:
Who to setup xpack n elastic fleet?
Very good documentation. Accurate and up to date. Congratulations
Thanks
Thank you so much for making it easy for us <3
Thanks
helpful