In this article we will learn how to Send Java Gradle App Logs to Elastic Stack. Logging is essential for understanding how applications behave, troubleshooting issues, and monitoring performance. In this guide, we will create a simple Java application using Gradle and set up logging with Logback. We will then configure the Elastic Stack (Elasticsearch, Kibana, and Filebeat) to collect, store, and visualize these logs. This setup helps developers easily track and analyze application logs in real time. By the end of this guide, you will have a fully functional logging system integrated with Elastic Stack.
Table of Contents
Prerequisites
- AWS Account with Ubuntu 24.04 LTS EC2 Instance.
- At least 2 CPU cores and 4 GB of RAM for smooth performance.
- Java and Gradle installed.
Step #1:Setting Up Ubuntu EC2 Instance
Before we start, ensure that your system is ready with the necessary tools. We’ll need Java, Gradle, and the Elastic Stack (Elasticsearch, Kibana, and Filebeat).
Update the Package List to ensure you have the latest versions.
sudo apt update
Install zip, we need it to install SDKMAN.
sudo apt install zip -y
Install SDKMAN. SDKMAN allows us to install and manage different Java and Gradle versions easily.
curl -s "https://get.sdkman.io" | bash
source "$HOME/.sdkman/bin/sdkman-init.sh"
Install Java 17 (Amazon Corretto).
sdk install java 17.0.10-amzn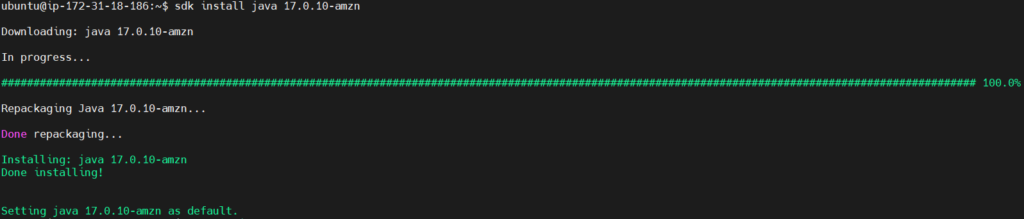
check it version to verify if its installed or not.
java -version
Next Install Gradle 8.13.
sdk install gradle 8.13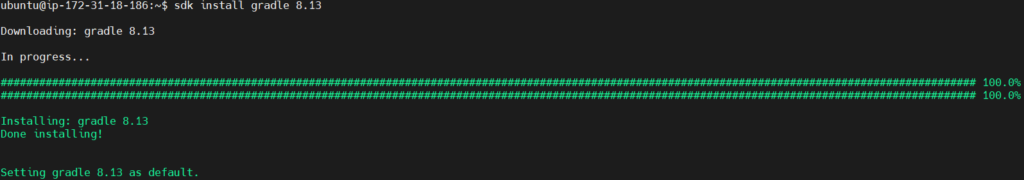
check it version to verify if its installed or not.
gradle -v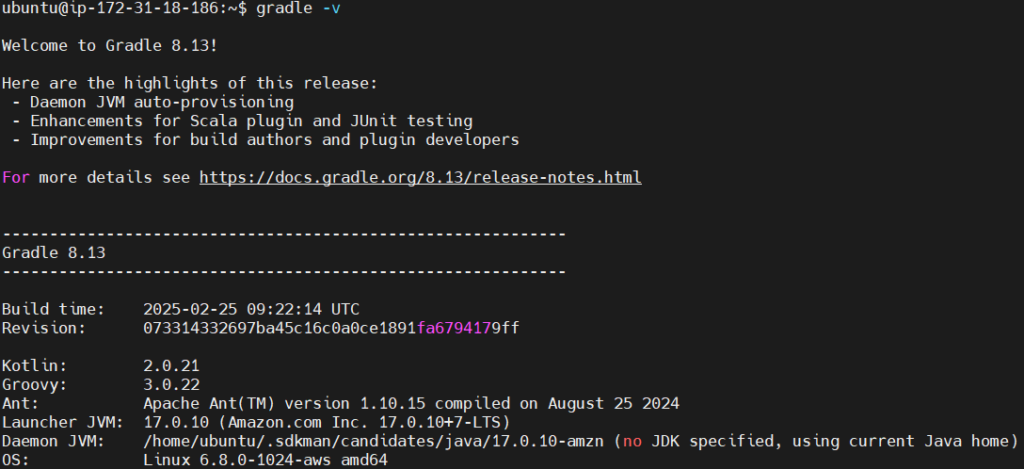
Step #2:Creating a Java Gradle Application
Create and navigate to a new project directory
mkdir my-java-app-gradle
cd my-java-app-gradle
Initialize Gradle Project.
gradle init --type java-application --dsl groovy --test-framework junit-jupitergradle initcreates a new project--type java-applicationspecifies a Java application template--dsl groovyuses Groovy for build scripts--test-framework junit-jupitersets up JUnit 5 for testing

Navigate to Application Directory, you will see the build.gradle file.
cd app
ls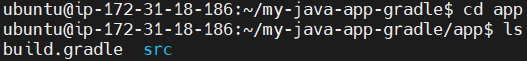
Remove the default build file and create a new one.
rm build.gradle
nano build.gradle
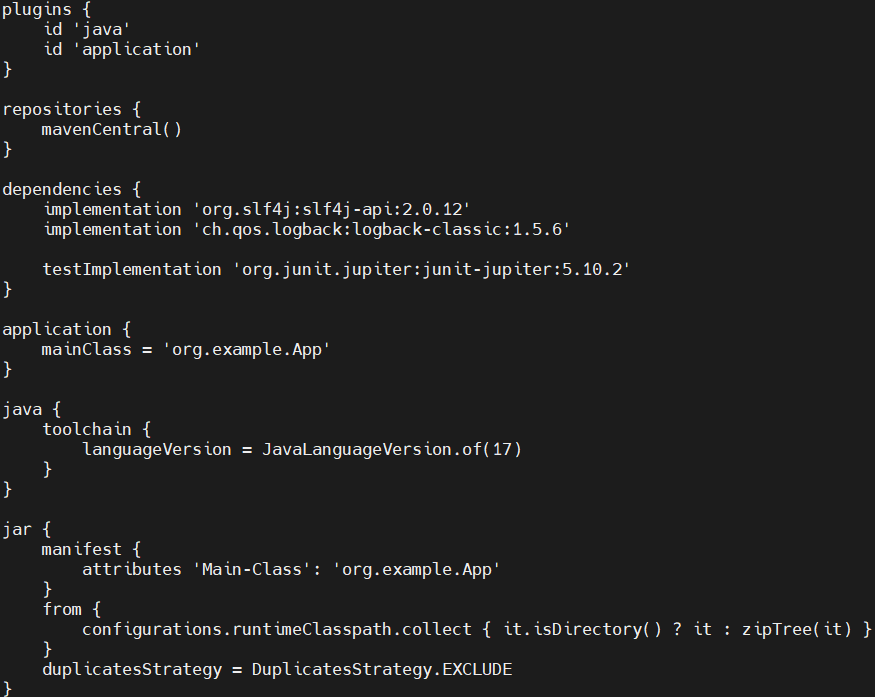
Add the following configuration.
plugins {
    id 'java'
    id 'application'
}

repositories {
    mavenCentral()
}

dependencies {
    implementation 'org.slf4j:slf4j-api:2.0.12'
    implementation 'ch.qos.logback:logback-classic:1.5.6'

    testImplementation 'org.junit.jupiter:junit-jupiter:5.10.2'
}

application {
    mainClass = 'org.example.App'
}

java {
    toolchain {
        languageVersion = JavaLanguageVersion.of(17)
    }
}

jar {
    manifest {
        attributes 'Main-Class': 'org.example.App'
    }
    from {
        configurations.runtimeClasspath.collect { it.isDirectory() ? it : zipTree(it) }
    }
    duplicatesStrategy = DuplicatesStrategy.EXCLUDE
}
Explanation of the code:
- Plugins Section
java: Enables Java support in the Gradle project.application: Defines the project as a Java application and allows specifying the main class for execution.
- Repositories Section
- Specifies Maven Central as the source for downloading dependencies.
- Dependencies Section
slf4j-api: A logging API that provides a common interface for different logging frameworks.logback-classic: A logging implementation that works with SLF4J, used for logging messages to the console and files.junit-jupiter: A testing framework for writing unit tests.
- Application Configuration
- Specifies the main entry point of the application (
org.example.App), so Gradle knows which class to run when executing the application.
- Specifies the main entry point of the application (
- Java Toolchain Configuration
- Ensures that Java 17 is used to compile and run the application, making the project more portable.
- JAR Packaging Configuration
manifest: Specifies that the main class (org.example.App) should be included in the JAR file so it can be executed withjava -jar myapp.jar.fromblock: Ensures that all runtime dependencies are packaged inside the JAR, creating a fat JAR (self-contained JAR with all required libraries).duplicatesStrategy = DuplicatesStrategy.EXCLUDE: Prevents issues when multiple dependencies contain duplicate files.
Create Main Application Class. For that modify the App.java file.
nano src/main/java/org/example/App.java
Add the following code.
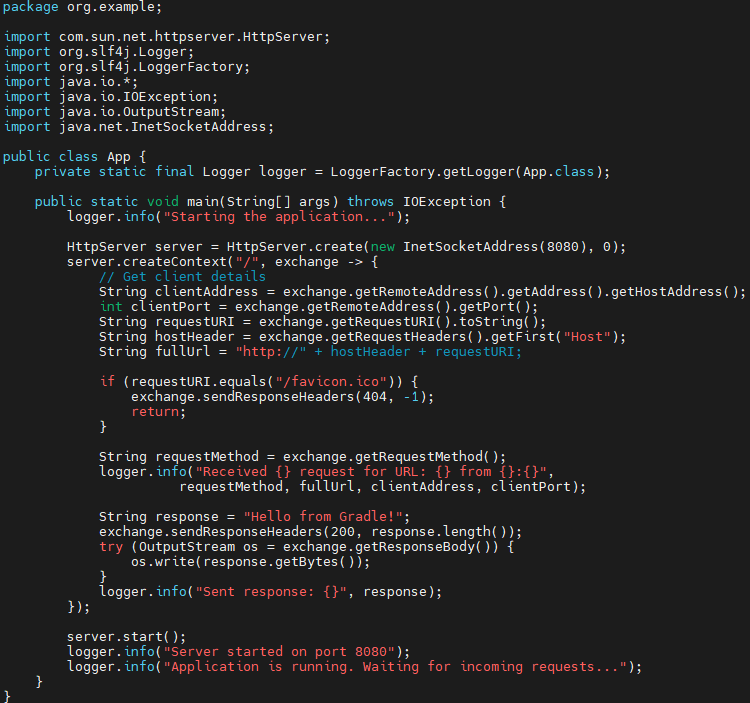
package org.example;

import com.sun.net.httpserver.HttpServer;
import org.slf4j.Logger;
import org.slf4j.LoggerFactory;
import java.io.*;
import java.io.IOException;
import java.io.OutputStream;
import java.net.InetSocketAddress;

public class App {
    private static final Logger logger = LoggerFactory.getLogger(App.class);

    public static void main(String[] args) throws IOException {
        logger.info("Starting the application...");

        HttpServer server = HttpServer.create(new InetSocketAddress(8080), 0);
        server.createContext("/", exchange -> {
            // Get client details
            String clientAddress = exchange.getRemoteAddress().getAddress().getHostAddress();
            int clientPort = exchange.getRemoteAddress().getPort();
            String requestURI = exchange.getRequestURI().toString();
            String hostHeader = exchange.getRequestHeaders().getFirst("Host");
            String fullUrl = "http://" + hostHeader + requestURI;

            if (requestURI.equals("/favicon.ico")) {
                exchange.sendResponseHeaders(404, -1);
                return;
            }

            String requestMethod = exchange.getRequestMethod();
            logger.info("Received {} request for URL: {} from {}:{}",
                      requestMethod, fullUrl, clientAddress, clientPort);

            String response = "Hello from Gradle!";
            exchange.sendResponseHeaders(200, response.length());
            try (OutputStream os = exchange.getResponseBody()) {
                os.write(response.getBytes());
            }
            logger.info("Sent response: {}", response);
        });

        server.start();
        logger.info("Server started on port 8080");
        logger.info("Application is running. Waiting for incoming requests...");
    }
}
Explanation of the code:
- Import Statements
HttpServer: A lightweight HTTP server built into Java.LoggerandLoggerFactory: Used for logging messages (info, warnings, errors, etc.).InetSocketAddress: Represents a network address with a hostname/IP and port.OutputStream: Used to send responses to the client.
- Logger Initialization
- This creates a logger named
App, which logs messages to the console and a file (as configured inlogback.xml).
- This creates a logger named
- Main Method
- The main method is the entry point of the application.
- It throws
IOExceptionin case of network or input/output issues.
- Creating the HTTP Server
- Creates an HTTP server that listens on port 8080.
- The second argument (
0) means the system decides how many connections to queue.
- Handling HTTP Requests
- Defines an endpoint (
/) that handles HTTP requests. - Extracts client details, including IP, port, request URL, and headers.
- Ignores requests for
favicon.ico(browser icon requests) by returning 404 Not Found. - Logs the HTTP method (GET, POST, etc.), the requested URL, and the client’s IP and port.
- Defines an endpoint (
- Sending an HTTP Response
- Sends a “Hello from Gradle!” response with HTTP 200 OK status.
- Uses
OutputStreamto write data to the HTTP response. - Logs the response message sent to the client.
- Starting the Server
- Starts the HTTP server.
- Logs that the server is running and ready to accept requests.
Now lets create Test Class. For that modify the AppTest.java.
nano src/test/java/org/example/AppTest.java
Add basic test in it.
package org.example;

import org.junit.jupiter.api.Test;
import static org.junit.jupiter.api.Assertions.*;

class AppTest {
    @Test
    void testAppHasMainMethod() {
        assertDoesNotThrow(() -> {
            App.main(new String[]{});
        }, "App should have a main method");
    }
}
Explanation of the code:
- Import Statements
@Test(JUnit 5): Marks a method as a test case.assertDoesNotThrow(): Ensures that a block of code runs without exceptions.
- Test Class Definition
- The test class
AppTestis designed to test theAppclass.
- The test class
- Test Case:
testAppHasMainMethod- Calls the
mainmethod ofAppusing: App.main(new String[]{});- Passes an empty argument array (
new String[]{}) to mimic a normal application startup.
- Passes an empty argument array (
- Checks that no exceptions are thrown using
assertDoesNotThrow(). - If the
mainmethod throws an exception, the test fails. - If
mainruns successfully, the test passes.
- Calls the
Next create a Logback Configuration.
nano src/main/resources/logback.xml
Add following logging configuration in it.
<configuration>
    <appender name="CONSOLE" class="ch.qos.logback.core.ConsoleAppender">
        <encoder>
            <pattern>%d{yyyy-MM-dd HH:mm:ss} %-5level %logger{36} - %msg%n</pattern>
        </encoder>
    </appender>

    <appender name="FILE" class="ch.qos.logback.core.FileAppender">
        <file>app/logs/my-app.log</file>  <!-- Changed from build/logs to match Maven -->
        <encoder>
            <pattern>%d{yyyy-MM-dd HH:mm:ss} %-5level %logger{36} - %msg%n</pattern>
        </encoder>
    </appender>

    <root level="info">
        <appender-ref ref="CONSOLE" />
        <appender-ref ref="FILE" />
    </root>
</configuration>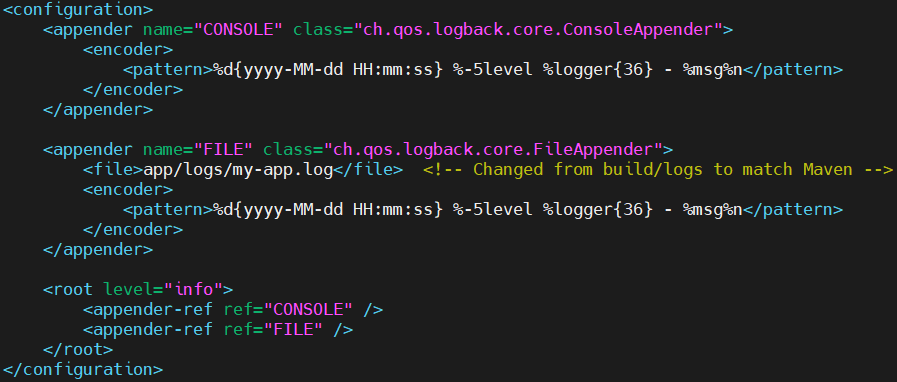
Explanation of the code:
- Root
<configuration>Element- This wraps the entire configuration and tells Logback how to handle logs.
- Console Appender (
CONSOLE)name="CONSOLE"→ Defines an appender that logs to the console (stdout).ConsoleAppender→ Writes logs to the terminal.- Pattern Formatting (
%d{yyyy-MM-dd HH:mm:ss} %-5level %logger{36} - %msg%n):%d{yyyy-MM-dd HH:mm:ss}→ Timestamp of the log.%-5level→ Log level (e.g.,INFO,ERROR).%logger{36}→ Logger name, truncated to 36 characters.%msg%n→ The actual log message.
- File Appender (
FILE)name="FILE"→ Defines an appender that logs to a file.FileAppender→ Saves logs to a file instead of the console.<file>app/logs/my-app.log</file>→ Logs are stored in the fileapp/logs/my-app.log.- Uses the same log format as the console appender.
- Root Logger Configuration
<root level="info">→ Sets the minimum log level toINFO.- This means only
INFO,WARN, andERRORlogs will be recorded (notDEBUG).
- This means only
<appender-ref ref="CONSOLE" />→ Sends logs to the console.<appender-ref ref="FILE" />→ Saves logs to the log file (my-app.log).
Step #3:Build the Application
Navigate back to project directory.
cd ..
Use Gradle to build the project and create a JAR file.
./gradlew build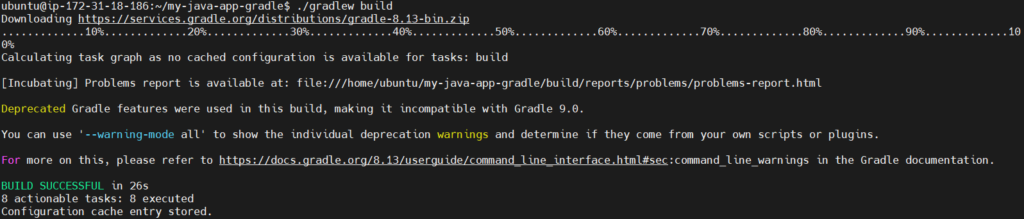
Step #4:Setting Up Elastic Stack for Log Monitoring
Now that the Java application is running and generating logs, let’s set up the Elastic Stack to monitor these logs.
First exit the current directory.
cd
Import the Elasticsearch GPG key.
curl -fsSL https://artifacts.elastic.co/GPG-KEY-elasticsearch | sudo gpg --dearmor -o /usr/share/keyrings/elasticsearch-keyring.gpg
Add the Elasticsearch repository.
echo "deb [signed-by=/usr/share/keyrings/elasticsearch-keyring.gpg] https://artifacts.elastic.co/packages/8.x/apt stable main" | sudo tee /etc/apt/sources.list.d/elastic-8.x.list
Now lets update the package list again. The repository is added to the system’s package sources.
sudo apt update
Install Elasticsearch.
sudo apt install -y elasticsearch

Modify Elasticsearch configuration for remote access.
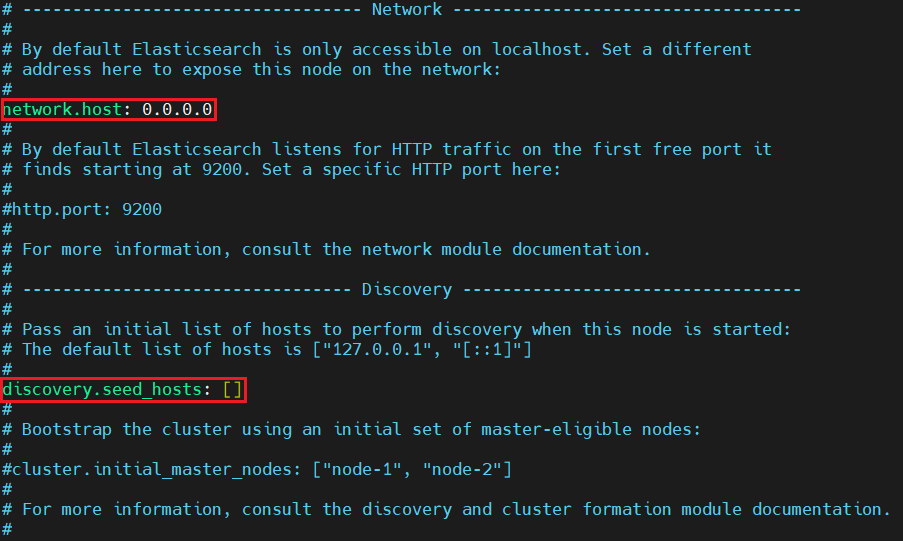
sudo nano /etc/elasticsearch/elasticsearch.yml
Find the network.host setting, uncomment it, and set it to 0.0.0.0 to bind to all available IP addresses and uncomment the discovery section to specify the initial nodes for cluster formation discovery.seed_hosts: []
For a basic setup (not recommended for production), disable security features.
xpack.security.enabled: false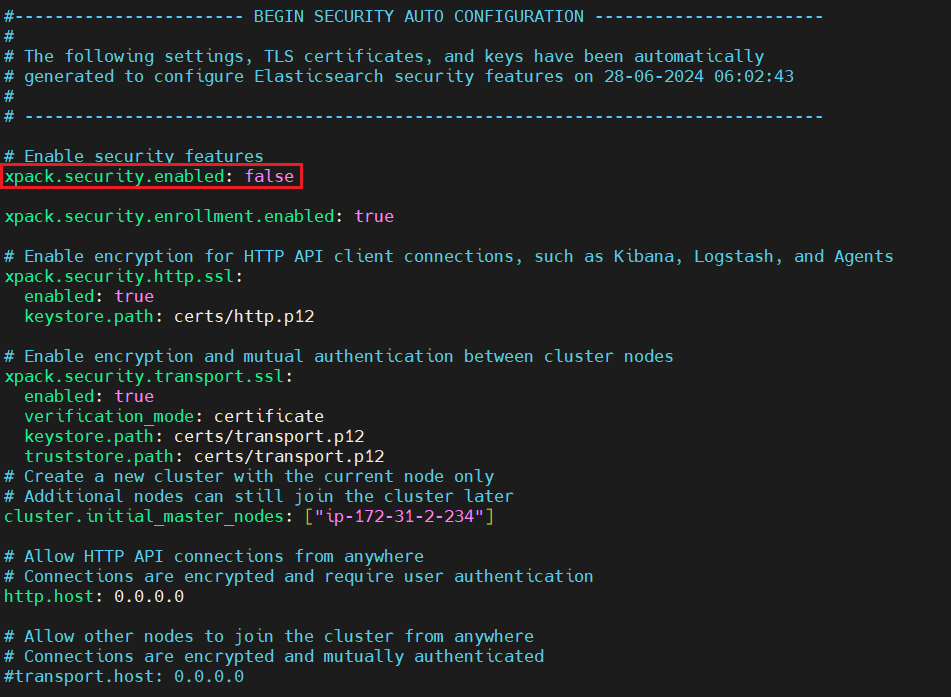
Save and exit the editor.
Enable and start Elasticsearch.
sudo systemctl enable elasticsearch
sudo systemctl start elasticsearch

Check the status of the elasticsearch to ensure it is running.
sudo systemctl status elasticsearch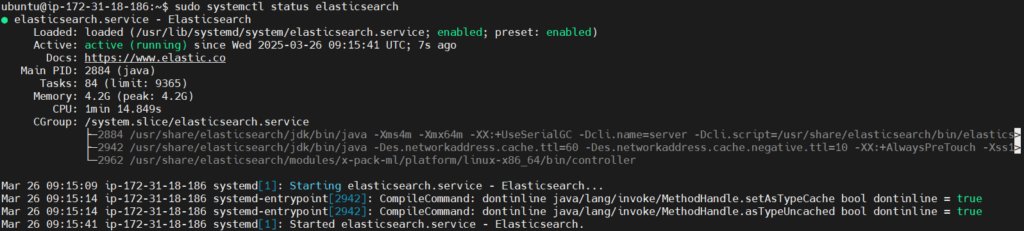
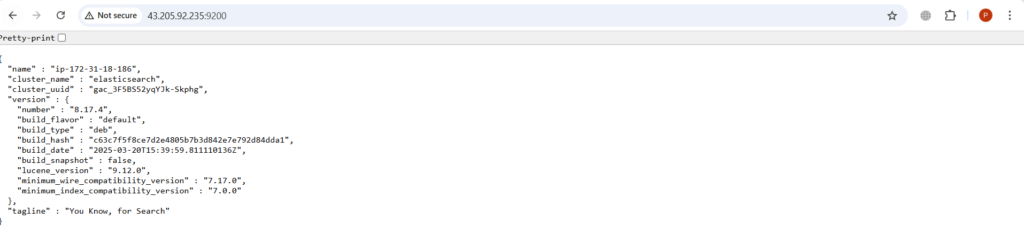
Send a GET request to check if Elasticsearch is running and responding. If successful, you should see a JSON response with cluster information.
curl -X GET "localhost:9200"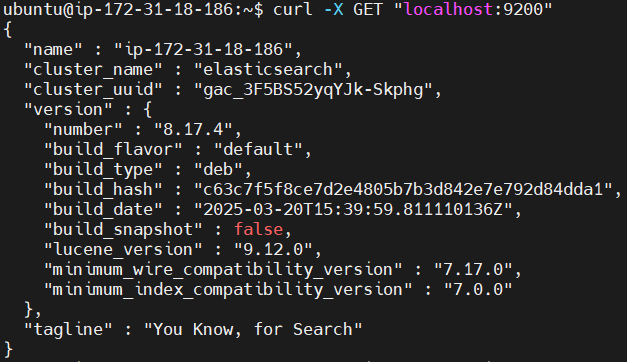
You can access it using browser with your Public IP address:9200 port which is a default port for Elasticsearch.
Kibana provides visualization for Elasticsearch data. Install Kibana on the system.
sudo apt install -y kibana
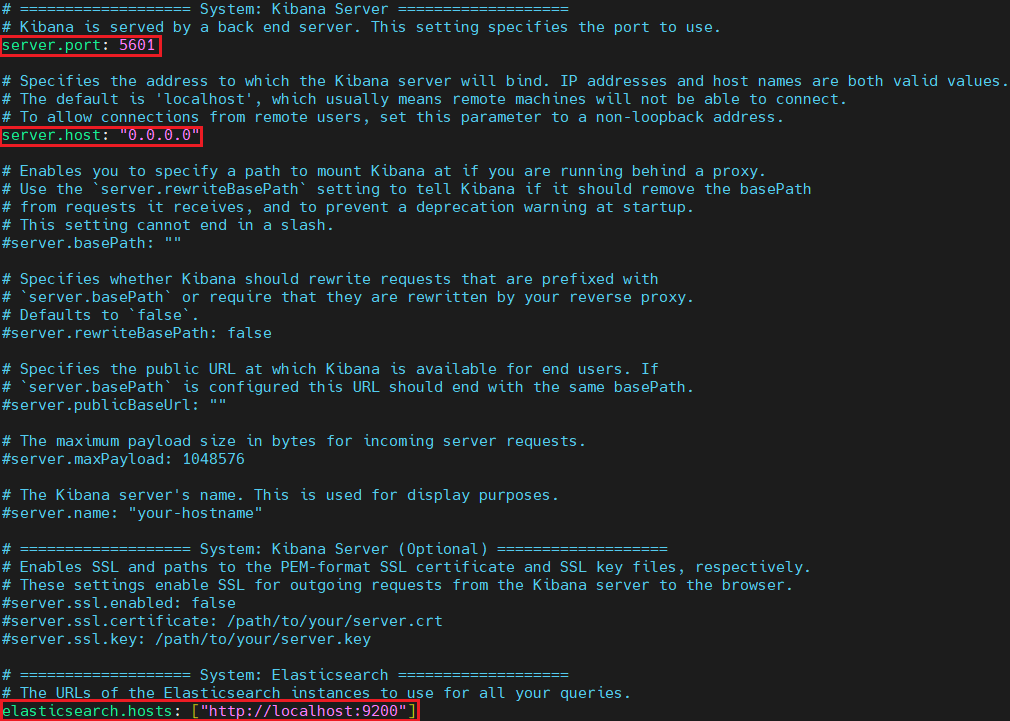
Open the Kibana configuration file for editing.
sudo nano /etc/kibana/kibana.yml
Uncomment and adjust the following lines to bind Kibana to all IP addresses and connect it to Elasticsearch.
server.port: 5601
server.host: "0.0.0.0"
elasticsearch.hosts: ["http://localhost:9200"]
Enable and start Kibana.
sudo systemctl enable kibana
sudo systemctl start kibana
Checks the status of Kibana.
sudo systemctl status kibana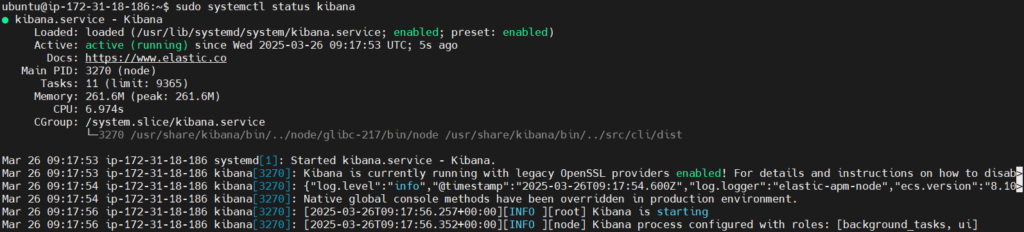
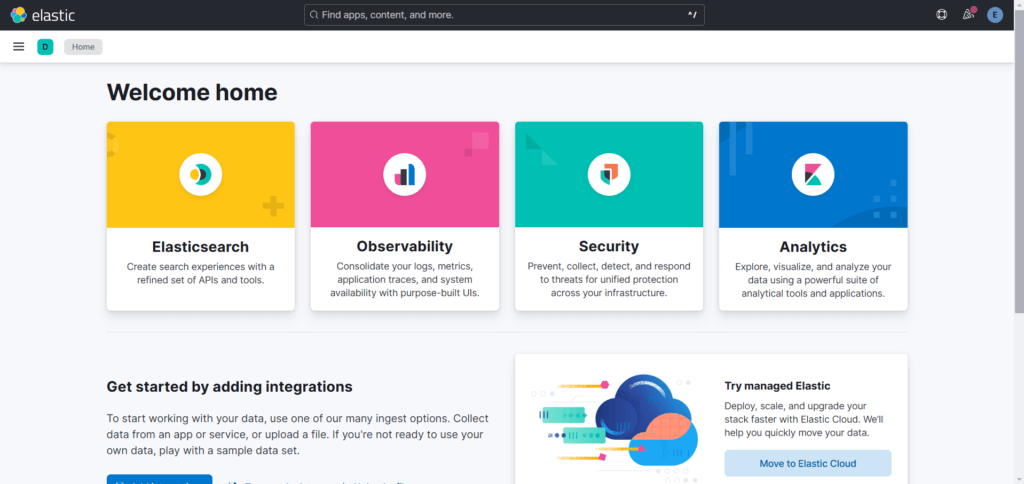
Access the Kibana interface by navigating to http://<your-server-ip>:5601 in your web browser. This will open the Kibana dashboard where you can start exploring your data..
Filebeat collects and forwards log data to Elasticsearch or Logstash. Install Filebeat on the system.
sudo apt install -y filebeat
Edit the Filebeat configuration file to ship logs from logs/my-app.log to Elasticsearch.
sudo nano /etc/filebeat/filebeat.yml
Update the filebeat.inputs and output.elasticsearch sections as shown below.
Change the type to log and change enable to true from false also comment out the id: my-filestream-id and give the path to our custome log file.
filebeat.inputs:
  - type: log
    enabled: true
    paths:
      - /home/ubuntu/my-java-app-gradle/app/logs/my-app.log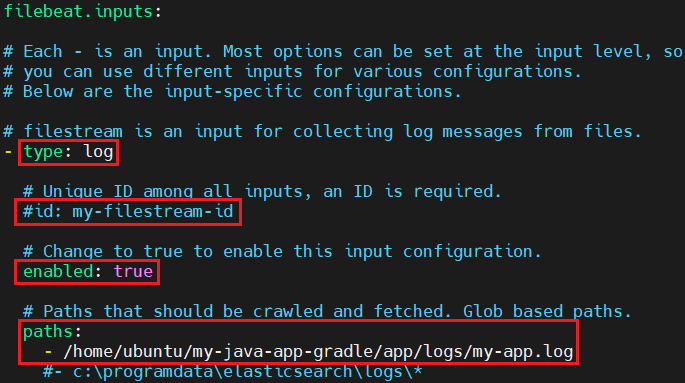
output.elasticsearch:
hosts: ["localhost:9200"]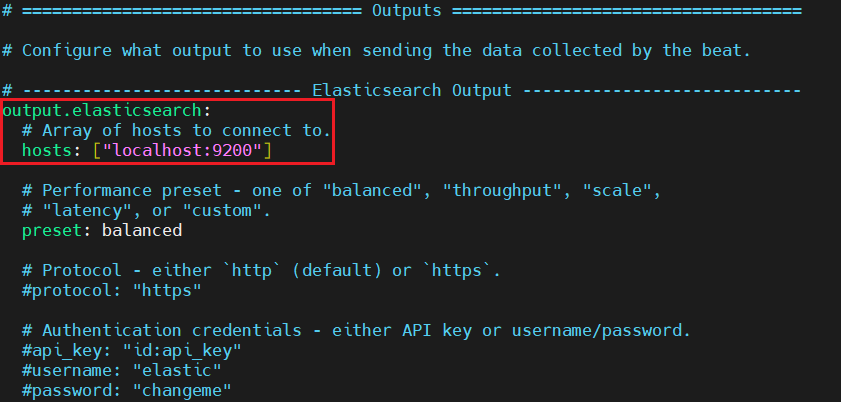
Test the configuration.
sudo filebeat test config
Apply Filebeat setup changes.
sudo filebeat setup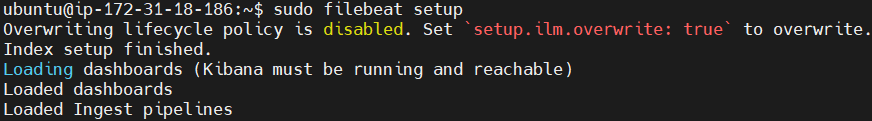
Start and enable the Filebeat service.
sudo systemctl enable filebeat
sudo systemctl start filebeat
Checks the status of filebeat.
sudo systemctl status filebeat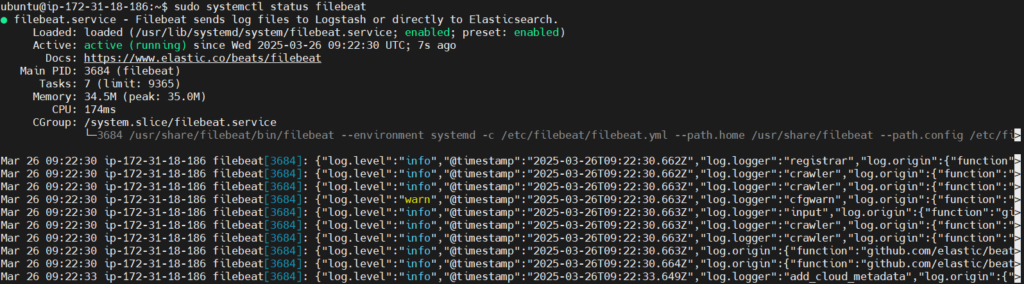
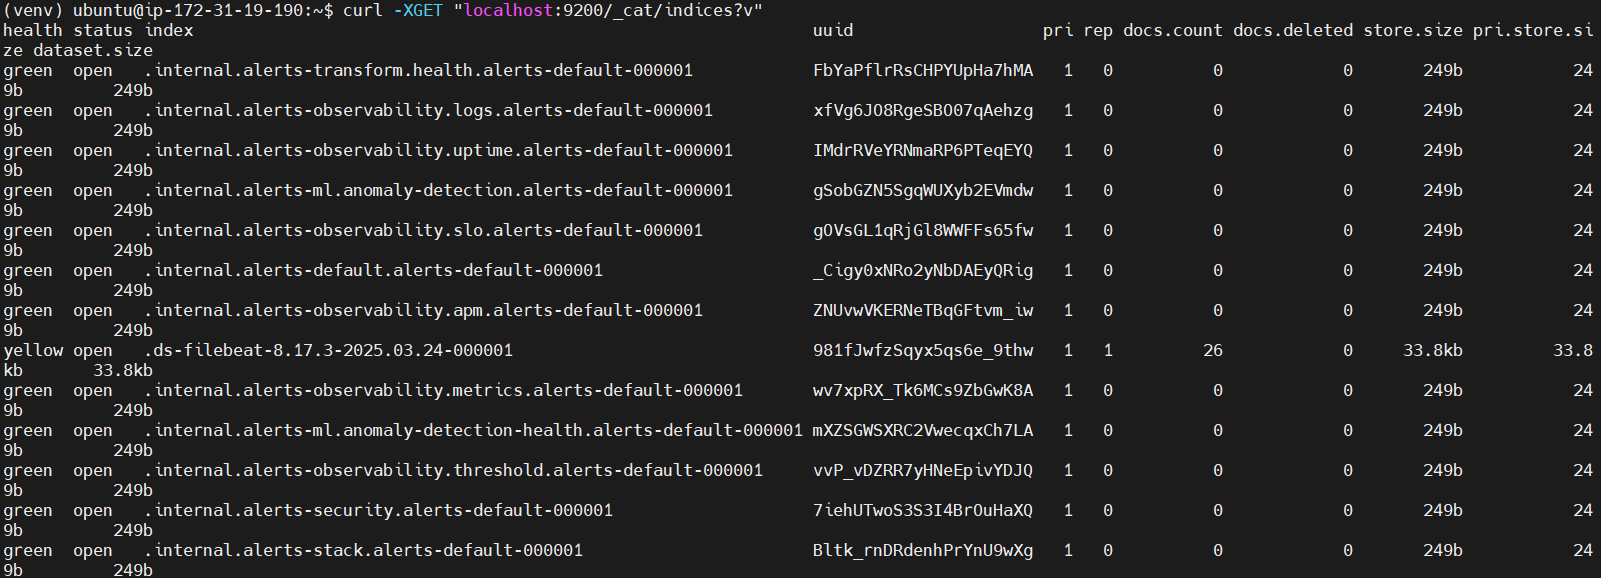
Ensure Elasticsearch is receiving data from Filebeat by checking the indices.
curl -XGET "localhost:9200/_cat/indices?v"You should see output indicating the presence of indices created by Filebeat.
Step #5:Run the Application
Navigate to the project directory.
cd my-java-app-gradle
Execute the JAR file to start the application.
java -jar app/build/libs/app.jar
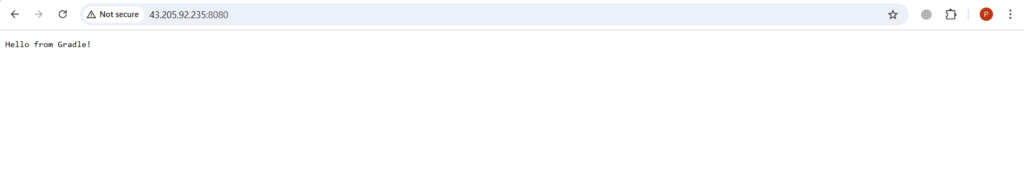
Open your browser and run http://<Public-IP-Address>:8080 to access the application. You will see the Hello from Gradle! message.
The logs will be written to both the console and the logs/my-app.log file.
cat logs/my-app.log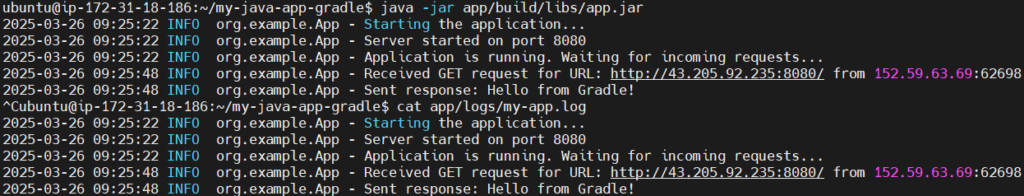
Step #7:Visualize Logs in Kibana
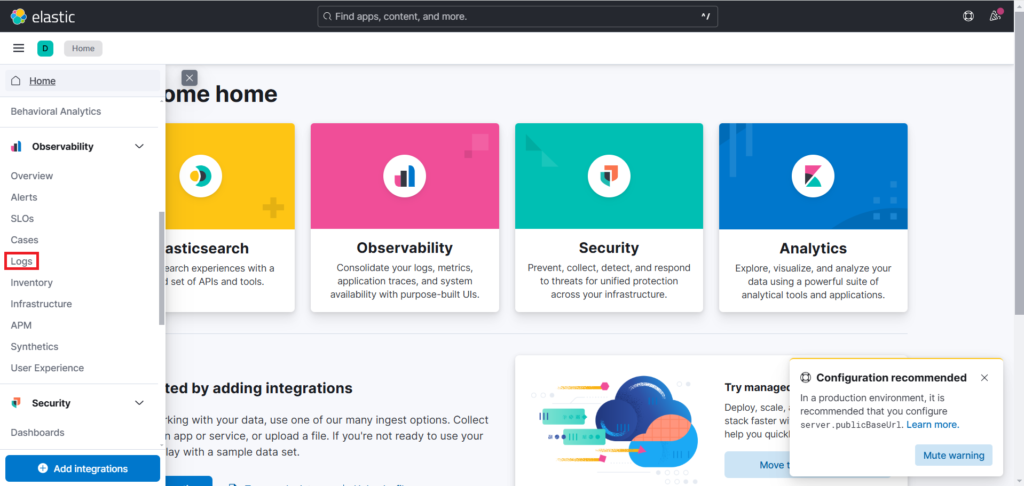
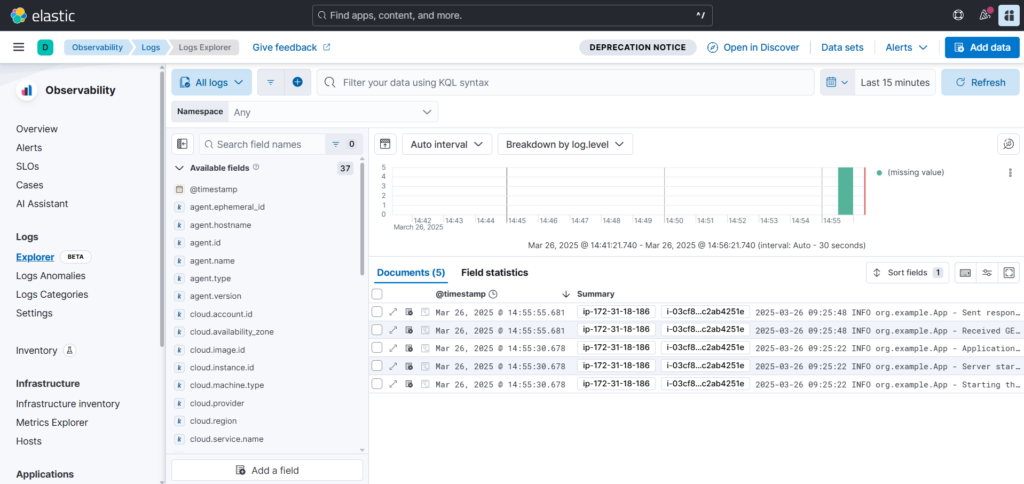
Now go back to Kibana. Scroll down and click on the Logs option in Obeservability in the left-hand navigation menu. If the menu is collapsed, click the Expand icon at the bottom left to reveal the options.
Kibana displays logs data from the last 15 minutes, visualized as a histogram along with individual log messages below. (You may need to adjust the time range.)
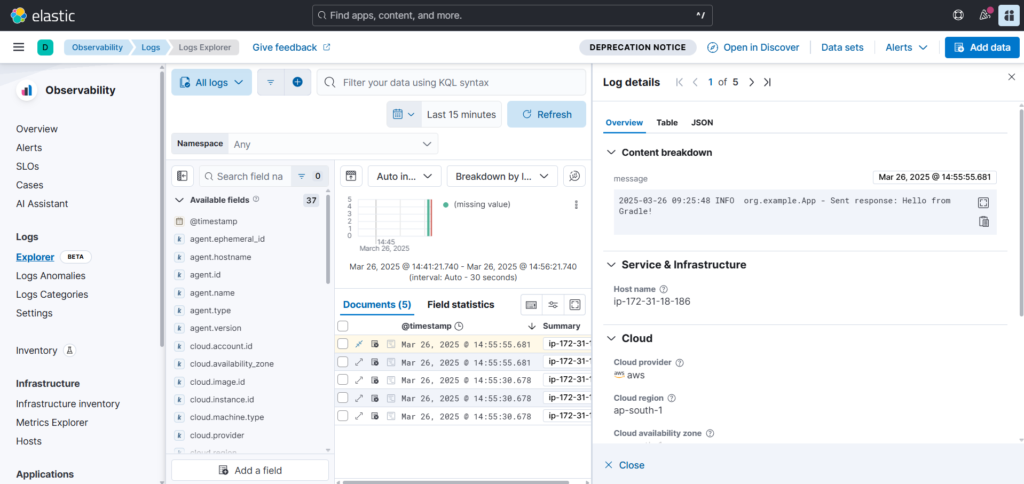
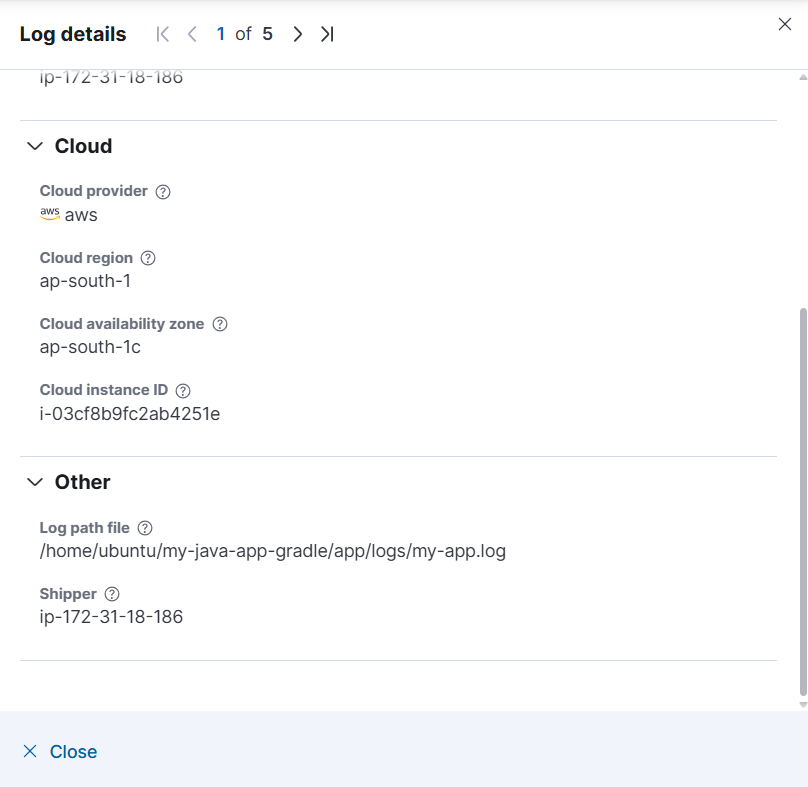
You can even see the details of the your Java logs. You can see the details of our Cloud provider also some other details.
Conclusion:
By following this guide, you have successfully set up a Java Gradle application that logs incoming requests and sends them to the Elastic Stack. With Elasticsearch storing logs, Kibana visualizing them, and Filebeat handling log forwarding, you now have a powerful logging solution in place. This setup helps in real-time monitoring, debugging, and improving application performance. You can further enhance it by adding Logstash for advanced log processing or integrating alerts for proactive monitoring.
Related Articles:
How to Install Elastic Stack on Ubuntu 24.04 LTS
Send Java Maven App Logs to Elastic Stack
Send Apache2 Logs to Elastic Stack and Filebeat
Reference: