
In this article we will learn about Observability Dashboard Overview in Elastic Stack. Monitoring your Nginx web server is essential to keep your website fast and reliable. In this guide, you’ll learn how to turn raw Nginx logs into an interactive dashboard using Elastic Stack. We’ll use Filebeat to collect logs, Elasticsearch to store them, and Kibana to visualize traffic, errors, and security threats. By the end, you’ll have a powerful observability dashboard to track performance in real time.
Table of Contents
Prerequisites
- AWS account with an Ubuntu 24.04 EC2 instance.
- Instance with at least 2 CPU cores and 4 GB of RAM for optimal performance.
- Java and Nginx installed.
Step #1:Set Up Ubuntu EC2 Instance
Update the Package List to ensure you have the latest versions.
sudo apt update
Elasticsearch requires Java, so we need to install OpenJDK 11.
sudo apt install -y openjdk-17-jdk

Install the Nginx web server.
sudo apt install -y nginx
Check the status of the Nginx to ensure it is running.
sudo systemctl status nginx
Step #2:Install Elasticsearch on Ubuntu 24.04 LTS
Import the Elasticsearch GPG key.
curl -fsSL https://artifacts.elastic.co/GPG-KEY-elasticsearch | sudo gpg --dearmor -o /usr/share/keyrings/elasticsearch-keyring.gpg
Add the Elasticsearch repository.
echo "deb [signed-by=/usr/share/keyrings/elasticsearch-keyring.gpg] https://artifacts.elastic.co/packages/8.x/apt stable main" | sudo tee /etc/apt/sources.list.d/elastic-8.x.list
Now lets update the package list again. The repository is added to the system’s package sources.
sudo apt update
Install Elasticsearch.
sudo apt install -y elasticsearch

Modify Elasticsearch configuration for remote access.
sudo nano /etc/elasticsearch/elasticsearch.yml
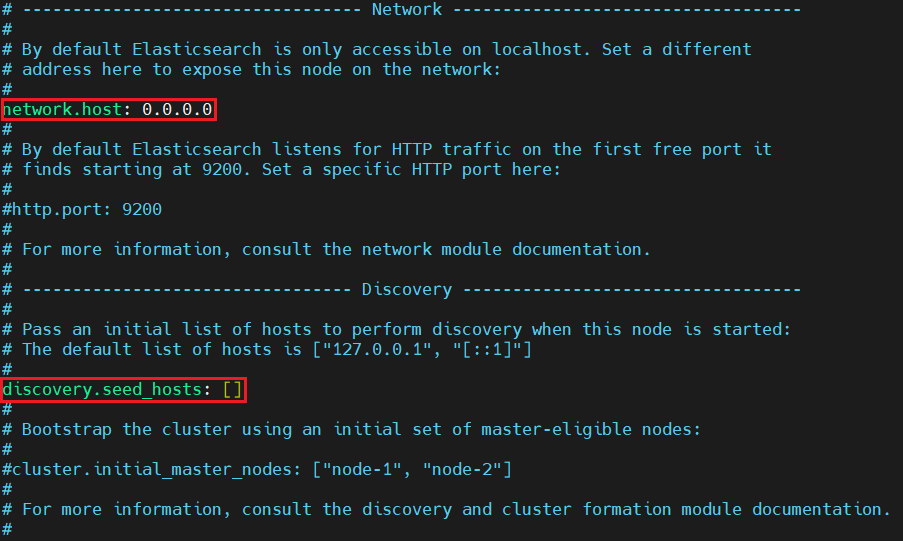
Find the network.host setting, uncomment it, and set it to 0.0.0.0 to bind to all available IP addresses and uncomment the discovery section to specify the initial nodes for cluster formation discovery.seed_hosts: []
For a basic setup (not recommended for production), disable security features.
xpack.security.enabled: false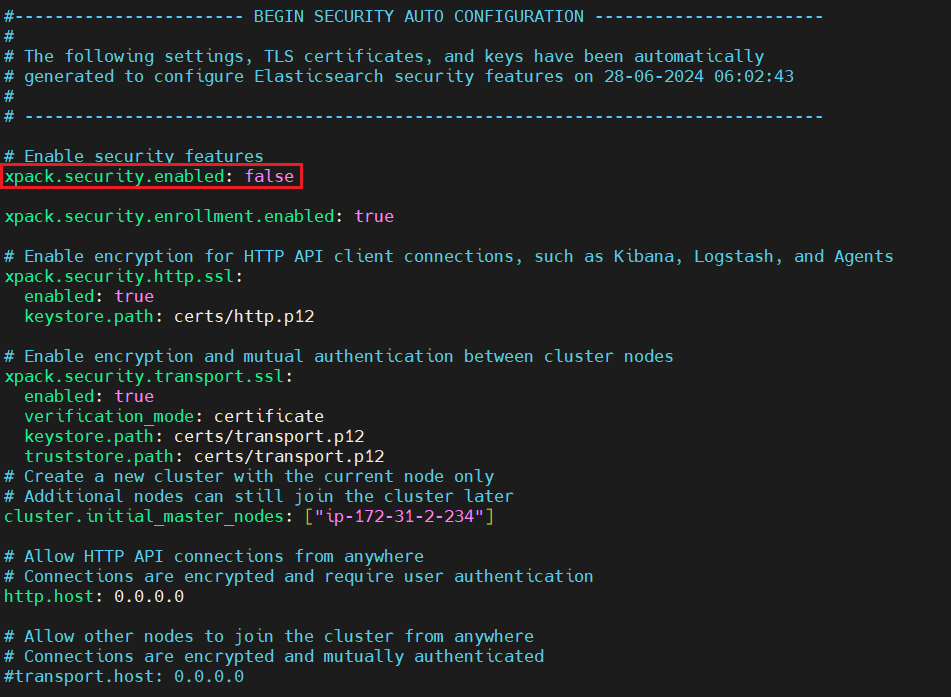
Save and exit the editor.
Enable and start Elasticsearch.
sudo systemctl enable elasticsearch
sudo systemctl start elasticsearch

Check the status of the elasticsearch to ensure it is running.
sudo systemctl status elasticsearch
Send a GET request to check if Elasticsearch is running and responding. If successful, you should see a JSON response with cluster information.
curl -X GET "localhost:9200"
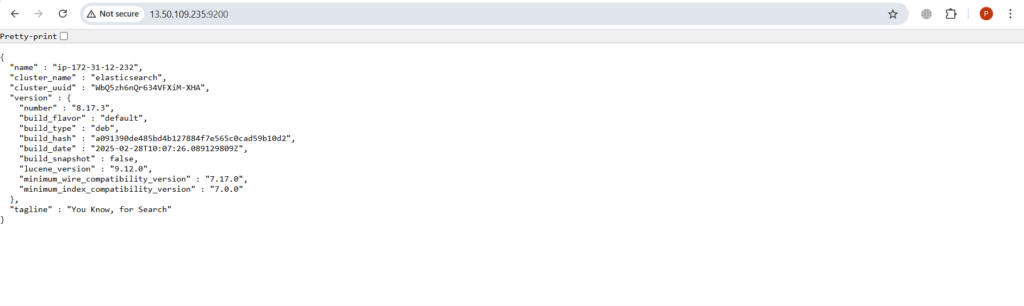
You can access it using browser with your Public IP address:9200 port which is a default port for Elasticksearch.
Step #3:Install Kibana on Ubuntu 24.04 LTS
Kibana provides visualization for Elasticsearch data. Install Kibana on the system.
sudo apt install -y kibana
Open the Kibana configuration file for editing.
sudo nano /etc/kibana/kibana.yml
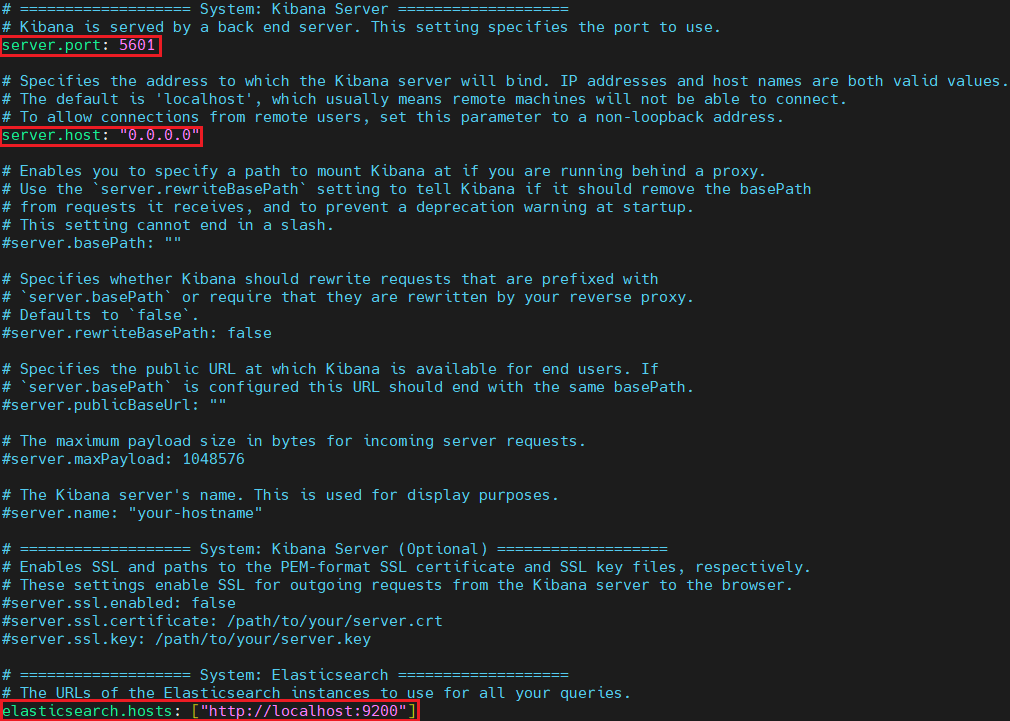
Uncomment and adjust the following lines to bind Kibana to all IP addresses and connect it to Elasticsearch.
server.port: 5601
server.host: "0.0.0.0"
elasticsearch.hosts: ["http://localhost:9200"]
Enable and start Kibana.
sudo systemctl enable kibana
sudo systemctl start kibana
Checks the status of Kibana.
sudo systemctl status kibana
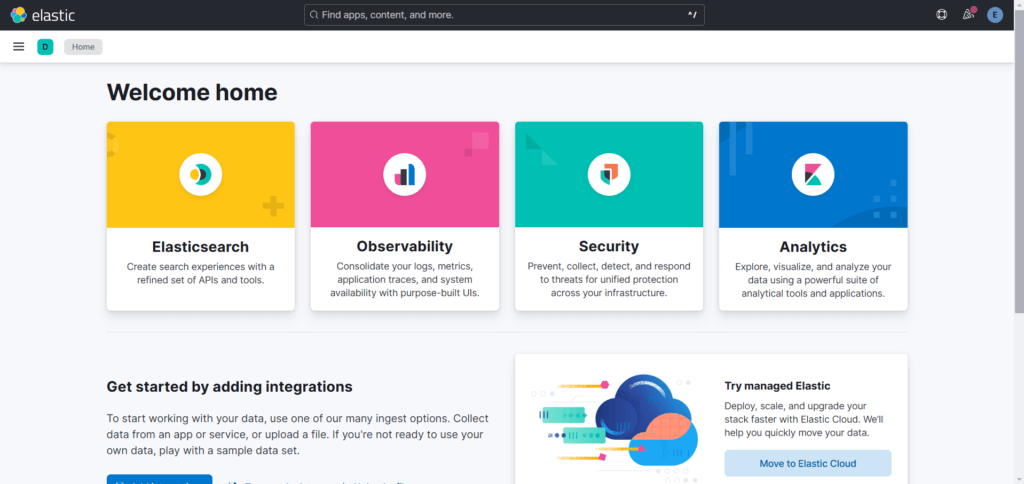
Access the Kibana interface by navigating to http://<your-server-ip>:5601 in your web browser. This will open the Kibana dashboard where you can start exploring your data.

You can start by adding integrations or Explore on my own.
Step #4:Install Filebeat on Ubuntu 24.04 LTS
Filebeat collects and forwards log data to Elasticsearch or Logstash. Install Filebeat on the system.
sudo apt install -y filebeat
No need to edit the filebeat configuration as by default it is configured to send logs to Elasticsearch.
Enable the Nginx module in Filebeat.
sudo filebeat modules enable nginx
Configure the Nginx module for log collection.
sudo nano /etc/filebeat/modules.d/nginx.yml
Ensure the following configuration is enabled to send Nginx logs.
- module: nginx
  # Access logs
  access:
    enabled: true

    # Set custom paths for the log files. If left empty,
    # Filebeat will choose the paths depending on your OS.
    var.paths: ["/var/log/nginx/access.log*"]

  # Error logs
  error:
    enabled: true

    # Set custom paths for the log files. If left empty,
    # Filebeat will choose the paths depending on your OS.
    var.paths: ["/var/log/nginx/error.log*"]

  # Ingress-nginx controller logs. This is disabled by default. It could be used in Kubernetes environments to parse ingress-nginx logs
  ingress_controller:
    enabled: false

    # Set custom paths for the log files. If left empty,
    # Filebeat will choose the paths depending on your OS.
    #var.paths: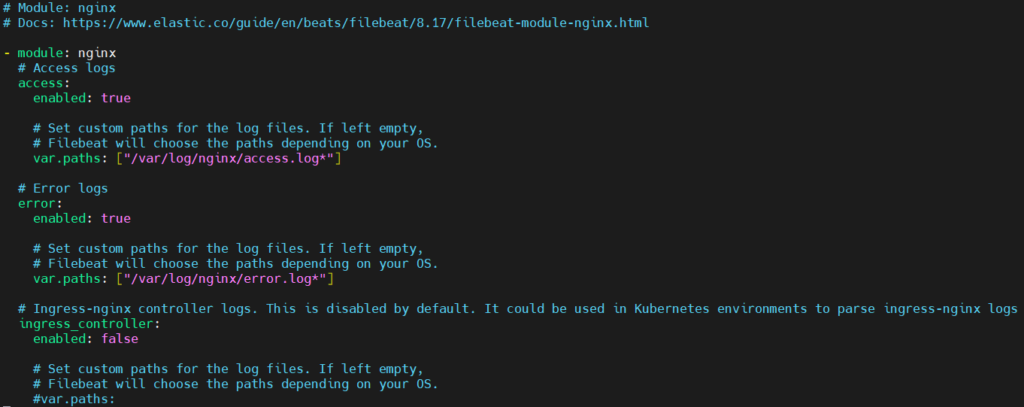
Save and exit the file.
Test the configuration.
sudo filebeat test config
Apply Filebeat setup changes.
sudo filebeat setup
Start and enable the Filebeat service.
sudo systemctl enable filebeat
sudo systemctl start filebeat
Checks the status of filebeat.
sudo systemctl status filebeat
Ensure Elasticsearch is receiving data from Filebeat by checking the indices.
curl -XGET "localhost:9200/_cat/indices?v"You should see output indicating the presence of indices created by Filebeat.

Step #5:Verify Nginx Logs in Kibana
Access the Nginx using following command.
curl http://localhost
Or Open your browser and navigate to http://<your-server-ip>. The default Nginx welcome page should appear.

Now go back to Kibana. Scroll down and click on the Logs option in Obeservability in the left-hand navigation menu. If the menu is collapsed, click the Expand icon at the bottom left to reveal the options.
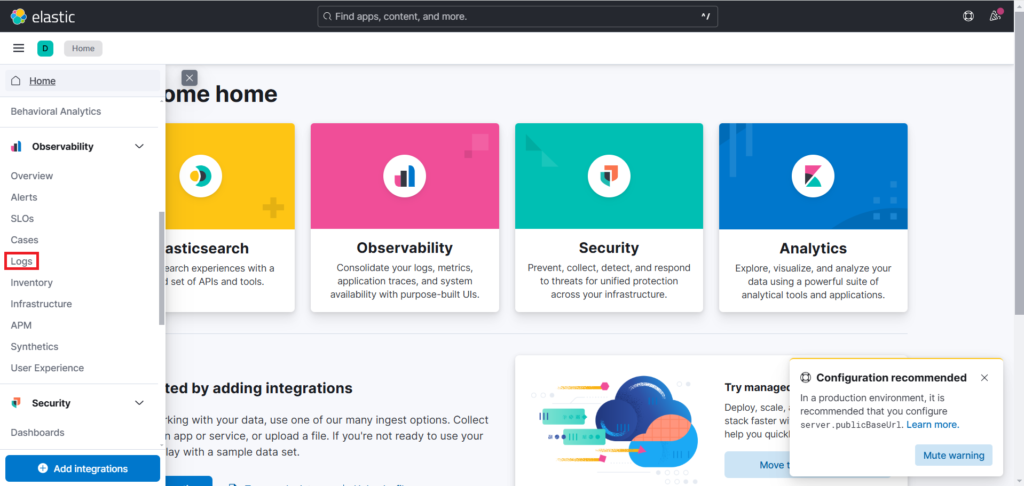
Kibana displays Nginx logs data from the last 15 minutes, visualized as a histogram along with individual log messages below. (You may need to adjust the time range.)


To generate a 404 Not Found error and see it in Kibana, access the following page on browser.
http://<public-ip-address>/this-page-does-not-existThis request will be logged in Nginx access log and should be visible in Kibana.

http://<public-ip-address>/page-not-found
Now refresh the kibana logs page.

You can even see the details of Nginx logs. You can see the details of our Cloud provider also some other details.


Step #6:Building the Observability Dashboard
Next we will create an Observability Dashboard. First in Kibana, go to Dashboard.

Click on Create dashboard.

Click Create visualization to add your first chart.

Add Area Chart (HTTP Status Over Time)
- Choose Area as the visualization type and select
filebeat-*as the data view. - Set Horizontal axis (X-axis) to
@timestamp, Verticle axis (Y-axis) toCount, and addhttp.response.status_codein the Breakdown field. - Click Save and return.

As you can see our area visualization is added. Now go to Add panel as shown below.

Select Maps as a Visualization.

Click on Add layer.

Select Documents to add layer.

Use filebeat-* as data view and source.geo.location as the geospatial field. Click on Add and continue

In Tooltip fields add source.geo.country_name and http.response.status_code. Click on Keep changes.

Next click on Save and return.

You can see that our Maps visualization is added. Click on Create visualization.

Select Visualization Type: Pie, filebeat-* as a Data view.
Set Slice by to user_agent.name and Metric to Count. Then click on Save and return.

You can see our pie chart is added below. Again click on Create visualization to add another visualization in our dashboard.

Again, create a new Pie visualization with filebeat-* as Data view.
Set Slice by to url.path and Metric to Count. Then click on Save and return.

You can see it in below image. Once all visualizations are added, click Save to save the dashboard.

Enter the Title for a dashboard like Nginx Observability Dashboard. Click on Save.

You can now find it under Dashboards, ready to monitor your Nginx traffic, status codes, locations, and more in real time. Now go to Dashboards to verify our dashboard is saved.

As you can see our Nginx Observability Dashboard is present.


Conclusion:
In conclusion, you’ve successfully built a real-time Nginx observability dashboard using the Elastic Stack. You can now track access logs, errors, and unusual traffic patterns easily through Kibana’s visual interface. This setup helps improve website performance, identify issues faster, and strengthen your web server’s reliability. As a next step, you can explore alerts, dashboards, and custom visualizations to enhance observability even more.
Related Articles:
Monitor .NET App Logs Using Elastic Stack
Send Java Gradle App Logs to Elastic Stack
Send Java Maven App Logs to Elastic Stack
Reference:
