In this article we will learn about Observability Dashboard Overview in Elastic Stack (Logs and Infrastructure). Observability is a key part of modern DevOps, helping teams monitor the health and performance of their systems in real-time. Elastic Stack (ELK Stack) offers a powerful solution for collecting and analyzing logs and metrics.
In this guide, we will focus on setting up observability using Filebeat and Metricbeat with Docker, Elasticsearch, and Kibana. This is part 2 of our series, where we go beyond the basics and explore infrastructure and logs in detail. By the end, you can visualize your container logs and system metrics in the Elastic stack.
Table of Contents
Prerequisites
- AWS Account with Ubuntu 24.04 LTS EC2 Instance.
- At least 2 CPU cores and 4 GB of RAM for smooth performance.
- Docker and Docker Compose installed.
Step #1:Install Docker and Docker Compose
First update the package list.
sudo apt update
If Docker and Docker Compose are not already installed, you can install them using the following command.
sudo apt install -y docker.io docker-compose
docker.io: Installs the Docker engine.docker-compose: Installs Docker Compose for managing multi-container applications.
Step #2:Create Docker Compose File
Create a Docker Compose YAML file to define the Elastic Stack services.
sudo nano docker-compose.yml
Paste the following content into the file.
version: "3"
services:
  elasticsearch:
    image: "docker.elastic.co/elasticsearch/elasticsearch:8.17.2"
    environment:
      - "ES_JAVA_OPTS=-Xms1g -Xmx1g"
      - "discovery.type=single-node"
    ports:
      - "9200:9200"
    volumes:
      - elasticsearch_data:/usr/share/elasticsearch/data

  kibana:
    image: "docker.elastic.co/kibana/kibana:8.17.2"
    ports:
      - "5601:5601"

  filebeat:
    image: "docker.elastic.co/beats/filebeat:8.17.2"
    user: root
    volumes:
      - /MY_WORKDIR/filebeat.yml:/usr/share/filebeat/filebeat.yml:ro
      - /var/lib/docker:/var/lib/docker:ro
      - /var/run/docker.sock:/var/run/docker.sock

  metricbeat:
    image: docker.elastic.co/beats/metricbeat:8.17.2
    user: root
    volumes:
      - /MY_WORKDIR/metricbeat.yml:/usr/share/metricbeat/metricbeat.yml:ro
      - /var/run/docker.sock:/var/run/docker.sock
      - /sys/fs/cgroup:/hostfs/sys/fs/cgroup:ro
      - /proc:/hostfs/proc:ro
      - /:/hostfs:ro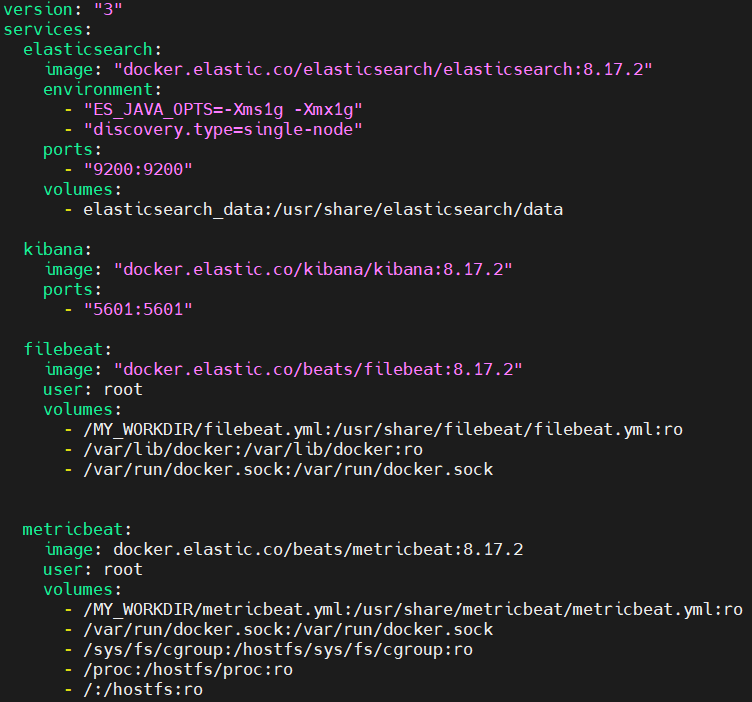
Step #3:Prepare Configuration Files For Beats
Create a working directory for your configuration files.
sudo mkdir /MY_WORKDIR
Inside the directory create a filebeat.yml file.
sudo nano /MY_WORKDIR/filebeat.yml
Paste the following config in it.
filebeat.inputs:
- type: container
  paths:
    - '/var/lib/docker/containers/*/*.log'

processors:
- add_docker_metadata:
    host: "unix:///var/run/docker.sock"

- decode_json_fields:
    fields: ["message"]
    target: "json"
    overwrite_keys: true

output.elasticsearch:
  hosts: ["elasticsearch:9200"]
  indices:
    - index: "filebeat-%{[agent.version]}-%{+yyyy.MM.dd}"

logging.json: true
logging.metrics.enabled: false
Create a metricbeat.yml file.
sudo nano /MY_WORKDIR/metricbeat.yml
Paste the following config in it.
metricbeat.modules:
- module: system
  metricsets:
    - cpu
    - memory
    - network
    - filesystem
    - process
    - process_summary
  enabled: true
  period: 10s
  processes: ['.*']
  hostfs: "/hostfs"

- module: docker
  metricsets:
    - container
    - cpu
    - diskio
    - healthcheck
    - info
    - memory
    - network
  hosts: ["unix:///var/run/docker.sock"]
  period: 10s
  enabled: true

output.elasticsearch:
  hosts: ["http://elasticsearch:9200"]

monitoring:
  enabled: true
Step #4:Start the Elastic Stack using Docker Composer
Start the services using Docker Compose.
sudo docker-compose up -d
Verify that the containers are running.
sudo docker ps -a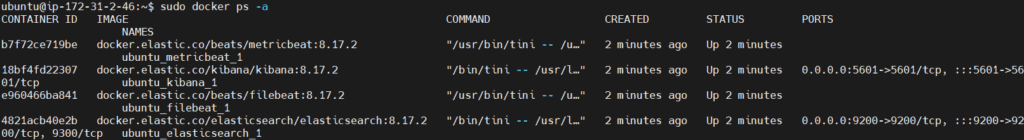
Step #5:Set Password for Elastic User
Elasticsearch 8.x enables security by default. Reset the password for the elastic user using following command.
sudo docker exec -it ubuntu_elasticsearch_1 /usr/share/elasticsearch/bin/elasticsearch-reset-password -u elastic -i
Update the Filebeat configuration to include the Elasticsearch credentials.
sudo nano /MY_WORKDIR/filebeat.yml
Add the username and password fields under output.elasticsearch.
output.elasticsearch:
  hosts: ["elasticsearch:9200"]
  username: "elastic"
  password: "devopshint"
  indices:
    - index: "filebeat-%{[agent.version]}-%{+yyyy.MM.dd}"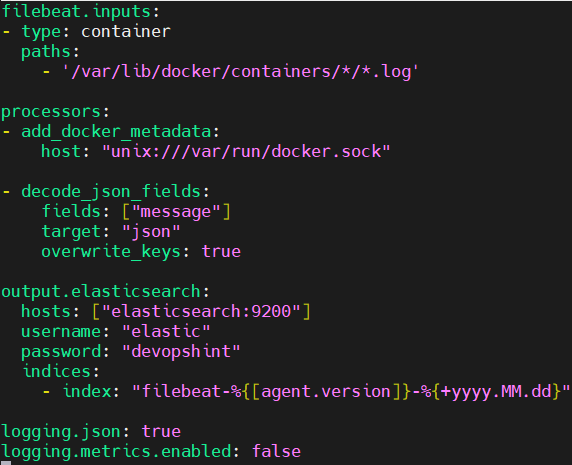
Save and exit the file.
Update the Metricbeat configuration to include the Elasticsearch credentials.
sudo nano /MY_WORKDIR/metricbeat.yml
Add the username and password fields under output.elasticsearch.
output.elasticsearch:
  hosts: ["elasticsearch:9200"]
  username: "elastic"
  password: "devopshint"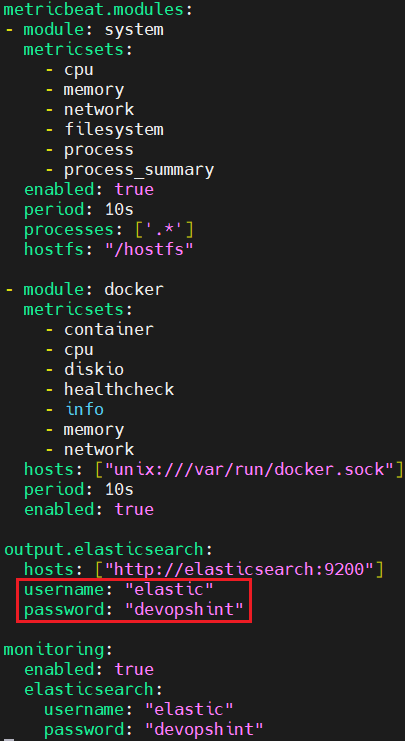
Restart the containers. First shut down the containers.
sudo docker-compose down
Then start them again.
sudo docker-compose up -d
Test the connection to Elasticsearch using the elastic user credentials.
curl -u elastic:devopshint http://localhost:9200
You should see a response with Elasticsearch cluster details.
Step #6:Secure Kibana with Service Token
To securely connect Kibana to Elasticsearch, generate a service account token.
curl -u elastic:devopshint -X POST "http://localhost:9200/_security/service/elastic/kibana/credential/token/my-token"; echo
Save the value field from the response.
Generate an encryption key.
openssl rand -hex 32
Save the generated encryption key.
Update the docker-compose.yml file to include the service account token and encryption keys.
sudo nano docker-compose.yml
Add the following environment variables to the kibana service.
kibana:
  image: "docker.elastic.co/kibana/kibana:8.17.2"
  ports:
    - "5601:5601"
  environment:
    - ELASTICSEARCH_HOSTS=http://elasticsearch:9200
    - ELASTICSEARCH_SERVICEACCOUNTTOKEN=AAEAAWVsYXN0aWMva2liYW5hL215LXRva2VuOnEwby1YUGlyU1JhZnFxaEozS012aVE
    - XPACK_SECURITY_ENCRYPTIONKEY=2145ee3c3cc4e7853c77e96a7cd7e0fe102ea5ffa948e368132b525af018db0c
    - XPACK_ENCRYPTEDSAVEDOBJECTS_ENCRYPTIONKEY=2145ee3c3cc4e7853c77e96a7cd7e0fe102ea5ffa948e368132b525af018db0c
    - XPACK_REPORTING_ENCRYPTIONKEY=2145ee3c3cc4e7853c77e96a7cd7e0fe102ea5ffa948e368132b525af018db0c
    - XPACK_SECURITY_SECURE_COOKIES=true
  depends_on:
    - elasticsearch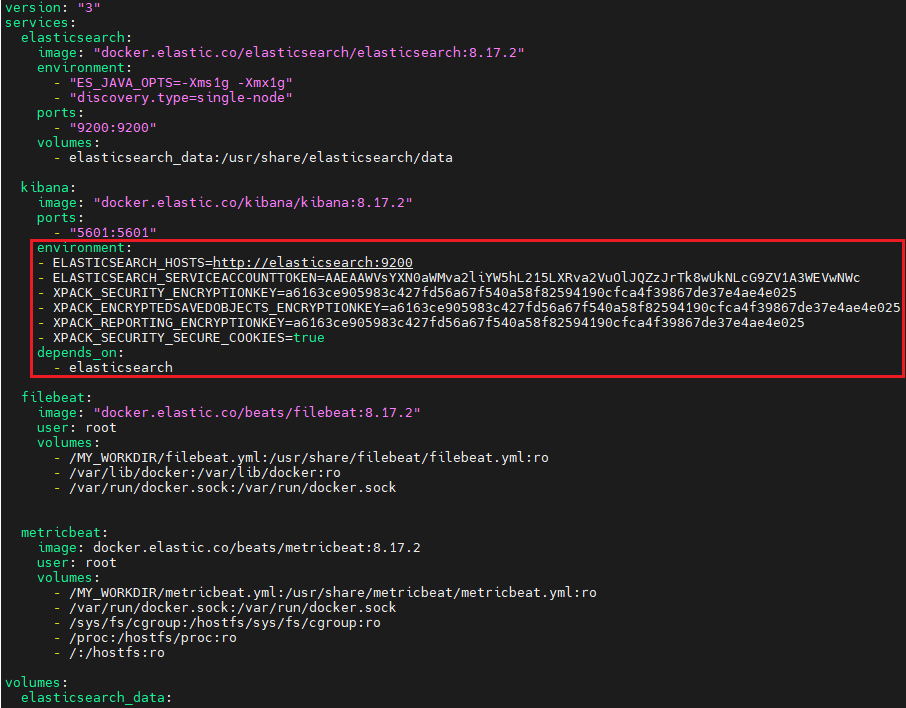
Save and exit the file.
Restart the services.
sudo docker-compose down
sudo docker-compose up -d
Verify that the containers are running.
sudo docker ps -a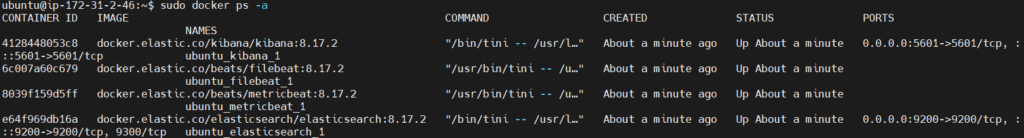
Step #7:Access Kibana Observability
Open your browser and navigate to http://<EC2-PUBLIC-IP>:5601. Log in using the elastic username and the password you set earlier.

Click on Explore on my own.

Go to Menu bar from top-left corner and select Stack Management under the management section.

Select Data Views under the Kibana section.

Click on Create data views.

Enter the Name as you want and the Index pattern as filebeat-* and click on Save data view to Kibana.


Now go to Logs.

You can see the Logs Explorer which gives real-time streaming view of container logs. Helps in debugging issues as you see what’s happening in your containers at the moment.

Then go to Logs Settings, here you can customize the log columns and source filters. Customize which columns you want to see (like container ID, timestamp, message). Set log source filters, e.g., only show logs from specific containers or services. Useful for keeping your log view clean and relevant.

Then in Infrastructure section go to the Infrastructure Inventory. A visual layout of your infrastructure (Docker containers, hosts, services). Helps you quickly see what’s running and where.
Click on any component to drill down into metrics or logs.

Then next go to Metrics Explorer. Create graphs using system and container metrics. Allows you to build custom metric charts. Select metrics like CPU usage, memory, or disk I/O from different containers or hosts. Here we have system.cpu.total.norm.pct and docker.cpu.total.pct. Great for spotting performance trends or bottlenecks.

Lastly there is Hosts Tab. Lists all your active hosts (e.g., servers or VMs running containers). Here you can view details like CPU, memory, and disk usage across all hosts. Useful for comparing resource usage across multiple systems.

Conclusion:
With the setup complete, you can now explore rich logs and detailed infrastructure metrics directly in Kibana. From tracking CPU usage to viewing container logs in real time, Elastic Stack provides a user-friendly way to gain deep insights into your applications. This observability setup helps you detect issues faster and make better decisions. In the next steps, you can further customize dashboards, add alerting, and integrate more services. Elastic Stack makes monitoring your infrastructure both simple and powerful.
Related Articles:
Observability Dashboard Overview in Elastic Stack
Monitor .NET App Logs Using Elastic Stack
Send Java Gradle App Logs to Elastic Stack
Reference: