In this article we are going to perform How to Install Elastic Stack on Ubuntu 20.04 LTS or any Cloud Instance like Amazon EC2, Azure VM, Google Compute Engine,etc.
Install Configure ElasticSearch on Ubuntu, Install and Configure Kibana on Ubuntu, Install and Configure Logstash on Ubuntu, Install and Configure Filebeat on Ubuntu and Access Kibana Web Interface.
Table of Contents
What is Elastic Stack ?
Elastic Stack formerly ELK is a collection of below open source tools.
- Elasticsearch
- Logstash
- Kibana
- Filebeat
Elastic Stack provides Log monitoring for our server and applications at one location.
A proper Log management is done by using ELK stack which includes collection of logs, its processing and visualization. Elastic Stack allows to fetch data from any source and in any format.
For data collection Filebeat is needed which renamed the ELK to Elastic Stack.
What is Elasticsearch ?
Elastic search is a open source tool which is used to store logs, Elasticsearch is a NoSQL database based on Lucene search engine, After storing logs we can also search it and indexed it.
In Elasticsearch we can store and analyze large volume data, Management becomes more easier by using Elasticsearch because it offers simple deployment.
What is Logstash ?
Logstash is used for collection of data and logs, After collected logs it gets transformed and feeds logs forward to Elasticsearch.
Logstash consists of three components –
- Input
- Filtering
- Output
Logstash can analyze structured as well as unstructured data.
Logstash provides plugins to get connected with different types of input sources to Logstash.
What is Kibana ?
Kibana is a visualization tool without which Elastic Stack is incomplete, Kibana provides a web interface on which we can search queries from Elasticsearch DB and then we can visualize it from the results obtained.
Kibana provides various types of dashboards which includes varieties of data diagrams, charts and graphs to visualize data, We can perform real-time search of indexed information.
We can save the dashboards and can share the snapshots of the logs been visualized.
Prerequisites
- Ubuntu Server with 20.04 LTS
- JDK
- 2 CPU and 4 GB RAM
- Open Ports 9200, 5601, 5044
update the system packages
sudo apt-get update
Install JDK on Ubuntu
Install openjdk and other dependencies before installing elastic stack
sudo apt-get install openjdk-11-jdk wget apt-transport-https curl gnupg2 -y
To check java version
java -version
Output:
openjdk version "11.0.10" 2021-01-19
OpenJDK Runtime Environment (build 11.0.10+9-Ubuntu-0ubuntu1.20.04)
OpenJDK 64-Bit Server VM (build 11.0.10+9-Ubuntu-0ubuntu1.20.04, mixed mode, sharing)
How to Install Elastic Stack on Ubuntu 20.04 LTS
#1: Install and Configure ElasticSearch on Ubuntu
First we will have to add a signing key and will have to add repositories to our system because Elasticsearch is not pre-installed in Ubuntu, we will have to do it manually.
Follow the below command to add elasticsearch signing key
wget -qO - https://artifacts.elastic.co/GPG-KEY-elasticsearch --no-check-certificate | sudo apt-key add -
Next add the repository in /etc/apt/sources.list.d/elastic-7.x.list using below command.
echo "deb https://artifacts.elastic.co/packages/7.x/apt stable main" | sudo tee -a /etc/apt/sources.list.d/elastic-7.x.list
update the system packages
sudo apt-get update
Install elasticsearch on Ubuntu using below command
sudo apt-get install elasticsearch -y
Let’s make changes in below elesticsearch configuration file
sudo nano /etc/elasticsearch/elasticsearch.yml
Go to Network section and uncommnet network.host and replace your system IP or localhost
network.host: localhost
Add the below line in Discovery section also.
discovery.type: single-nodeyou can change http port if you don’t want to use default port at (http.port:9200).
If you have installing Elastic Stack on Single system, Open Elasticsearch configuration , navigate to Discovery section and change below as shown below
# ---------------------------------- Network -----------------------------------
#
# By default Elasticsearch is only accessible on localhost. Set a different
# address here to expose this node on the network:
#
network.host: localhost
#
# By default Elasticsearch listens for HTTP traffic on the first free port it
# finds starting at 9200. Set a specific HTTP port here:
#
#http.port: 9200
#
# For more information, consult the network module documentation.
#
# --------------------------------- Discovery ----------------------------------
#
# Pass an initial list of hosts to perform discovery when this node is started:
# The default list of hosts is ["127.0.0.1", "[::1]"]
#
#discovery.seed_hosts: ["host1", "host2"]
#
# Bootstrap the cluster using an initial set of master-eligible nodes:
#
#cluster.initial_master_nodes: ["node-1", "node-2"]
discovery.type: single-node
#
# For more information, consult the discovery and cluster formation module documentation.
#
start the elacticsearch service
sudo systemctl start elasticsearch
To enable elacticsearch at system startup
sudo systemctl enable elasticsearch
To check the status of elasticsearch
sudo systemctl status elasticsearch
To stop elasticsearch service
sudo systemctl stop elasticsearch
To check elasticsearch service pid using command line
sudo ss -antpl | sudo grep 9200
Output:
sudo ss -antpl | sudo grep 9200
LISTEN    0         4096                     *:9200                   *:*        users:(("java",pid=17313,fd=283))
Enter below command to check elasticsearch is running by sending HTTP request.
curl -X GET "localhost:9200"
Output:
 curl -X GET "localhost:9200"
{
  "name" : "ip-172-31-0-235",
  "cluster_name" : "elasticsearch",
  "cluster_uuid" : "_na_",
  "version" : {
    "number" : "7.12.0",
    "build_flavor" : "default",
    "build_type" : "deb",
    "build_hash" : "78722783c38caa25a70982b5b042074cde5d3b3a",
    "build_date" : "2021-03-18T06:17:15.410153305Z",
    "build_snapshot" : false,
    "lucene_version" : "8.8.0",
    "minimum_wire_compatibility_version" : "6.8.0",
    "minimum_index_compatibility_version" : "6.0.0-beta1"
  },
  "tagline" : "You Know, for Search"
}
#2. Install and Configure Kibana on Ubuntu
To visualize data which is stored in Elasticsearch DB we will have to install Kibana, Kibana is a web interface visualization tool.
use below command to install kibana on Ubuntu
sudo apt-get install kibana
Kibana runs on localhost so will have to change in kibana configuration file.
sudo nano /etc/kibana/kibana.yml
Uncomment the below lines
server.port: 5601
server.host: "0.0.0.0"
elasticsearch.hosts: ["http://localhost:9200"]# Kibana is served by a back end server. This setting specifies the port to use.
server.port: 5601
# Specifies the address to which the Kibana server will bind. IP addresses and host names are both valid values.
# The default is 'localhost', which usually means remote machines will not be able to connect.
# To allow connections from remote users, set this parameter to a non-loopback address.
server.host: "0.0.0.0"
# Enables you to specify a path to mount Kibana at if you are running behind a proxy.
# Use the `server.rewriteBasePath` setting to tell Kibana if it should remove the basePath
# from requests it receives, and to prevent a deprecation warning at startup.
# This setting cannot end in a slash.
#server.basePath: ""
# Specifies whether Kibana should rewrite requests that are prefixed with
# `server.basePath` or require that they are rewritten by your reverse proxy.
# This setting was effectively always `false` before Kibana 6.3 and will
# default to `true` starting in Kibana 7.0.
#server.rewriteBasePath: false
# Specifies the public URL at which Kibana is available for end users. If
# `server.basePath` is configured this URL should end with the same basePath.
#server.publicBaseUrl: ""
# The maximum payload size in bytes for incoming server requests.
#server.maxPayloadBytes: 1048576
# The Kibana server's name. This is used for display purposes.
#server.name: "your-hostname"
# The URLs of the Elasticsearch instances to use for all your queries.
elasticsearch.hosts: ["http://localhost:9200"]After changing these two lines save it by Ctrl+O and exit by Ctrl+X.
To start kibana service
sudo systemctl start kibana
To enable kibana at system startup
sudo systemctl enable kibana
To check the status of kibana service
sudo systemctl status kibana
To stop kibana service
sudo systemctl stop kibana
#3. Install and Configure Logstash on Ubuntu
To collect logs and parse them we will need to install Logstash, Collected and filtered logs will be stored in Elasticsearch DB.
use below command to install logstash on ubuntu
sudo apt-get install logstash
To load logstash beat create the below config file and insert below lines.
sudo nano /etc/logstash/conf.d/02-beats-input.conf
input {

  beats {

    port => 5044

  }

}
save and close the file.
Create the logstash configuration file to send the logs, filter and showing in kibana and insert below lines
sudo nano /etc/logstash/conf.d/30-elasticsearch-output.conf
output {

  elasticsearch {

    hosts => ["localhost:9200"]

    manage_template => false

    index => "%{[@metadata][beat]}-%{[@metadata][version]}-%{+YYYY.MM.dd}"

  }

}
Save the file by Ctrl+O and exit by Ctrl+X.
To start logstash service
sudo systemctl start logstash
To enable logstash at system startup
sudo systemctl enable logstash
To stop logstash service
sudo systemctl stop logstash
To check status of logstash
sudo systemctl status logstash
#4. Install and Configure Filebeat on Ubuntu
Filebeat is an input to the logstash which gives logs collected from different sources. Follow the below command to install Filebeat so it can send logs to Logstash.
sudo apt-get install filebeat
Now lets make changes in filebeat configuration file
sudo nano /etc/filebeat/filebeat.yml
Comment the below lines
#output.elasticsearch:
  # Array of hosts to connect to.
#  hosts: ["localhost:9200"]
Uncomment the below lines
output.logstash:
hosts: ["localhost:5044"]
# ---------------------------- Elasticsearch Output ----------------------------
#output.elasticsearch:
  # Array of hosts to connect to.
#  hosts: ["localhost:9200"]

  # Protocol - either `http` (default) or `https`.
  #protocol: "https"

  # Authentication credentials - either API key or username/password.
  #api_key: "id:api_key"
  #username: "elastic"
  #password: "changeme"

# ------------------------------ Logstash Output -------------------------------
output.logstash:
  # The Logstash hosts
  hosts: ["localhost:5044"]

  # Optional SSL. By default is off.
  # List of root certificates for HTTPS server verifications
  #ssl.certificate_authorities: ["/etc/pki/root/ca.pem"]

  # Certificate for SSL client authentication
  #ssl.certificate: "/etc/pki/client/cert.pem"

  # Client Certificate Key
  #ssl.key: "/etc/pki/client/cert.key"
To start filebeat service
sudo systemctl start filebeat
To enable filebeat at system startup
sudo systemctl enable filebeat
To check status of filebeat service
sudo systemctl status filebeat
Enable filebeat system module
sudo filebeat modules enable system
Load the index template
filebeat setup --index-management -E output.logstash.enabled=false -E 'output.elasticsearch.hosts=["localhost:9200"]'
Now lets check that ElasticSearch is receiving datalog from filebeat using below command
curl -XGET http://localhost:9200/_cat/indices?v
Output:
curl -XGET http://localhost:9200/_cat/indices?v
health status index                             uuid                   pri rep docs.count docs.deleted store.size pri.store.size
green  open   .kibana_task_manager_7.12.0_001   6vZtJ4jqRyaBorqojMRVMA   1   0          9          149    203.3kb        203.3kb
green  open   .apm-custom-link                  RYBbJ3C5SlaqIHH2h7ke7w   1   0          0            0       208b           208b
green  open   .apm-agent-configuration          ABJ5fag4QPuekS9kiStfoQ   1   0          0            0       208b           208b
yellow open   filebeat-7.12.0-2021.04.27-000001 hCQ8p2iHQla_EzfsNSD4Aw   1   1       2777            0    841.3kb        841.3kb
green  open   .kibana-event-log-7.12.0-000001   gE8SlJosQlqdhZh5OBFR8A   1   0          3            0     16.4kb         16.4kb
green  open   .kibana_7.12.0_001                3KFkqOLnSNeCpA64JJ-pdg   1   0         11            3      2.1mb          2.1mb
green  open   .tasks
We have covered install elastic stack on Ubuntu 20.04 LTS.
#5. Access Kibana Web Interface
Access Kibana Web Interface by using the URL
http://your-server-ip:5601
Enter you server IP address in the place of “your-server-ip”.

Click on Explore on my own, you will see elastic stack dashboard.
To check system logs in Kibana, click on Logs as shown below.
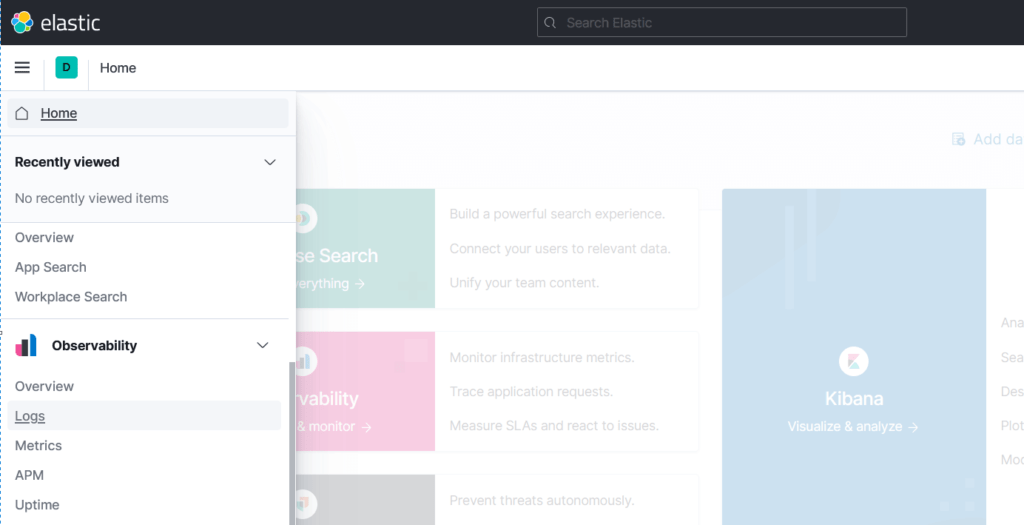
In Stream section, you can see logs of your system.

Conclusion:
In this article, We have performed How to Install ELK Stack on Ubuntu 20.04 LTS, Install Configure ElasticSearch on Ubuntu, Install and Configure Kibana on Ubuntu, Install and Configure Logstash on Ubuntu, Install and Configure Filebeat on Ubuntu and Access Kibana Web Interface.
Related Articles:
Reference:
Hello Sir !
pls sharing guide config Logstash with syslog of router equipment to ELK system
Thanks and Regard,
Thank you for the easy to follow procedure, but after following everything, I get no logs on Stream.
Here’s the output of my curl:
$ curl -XGET http://localhost:9200/_cat/indices?v
health status index uuid pri rep docs.count docs.deleted store.size pri.store.size
green open .geoip_databases MCSVazg9Rhi-ACGWgfcNIQ 1 0 42 0 40.5mb 40.5mb
yellow open filebeat-7.17.9-2023.03.21-000001 KKpTw-jUShmyxKIlly0zBg 1 1 0 0 226b 226b
green open .apm-custom-link XBSU7IKoT6SXroaxB328bA 1 0 0 0 226b 226b
green open .kibana_7.17.9_001 zDDIW2axQz6o27Ejel4u3g 1 0 728 1026 2.6mb 2.6mb
green open .apm-agent-configuration lODlA9RNQhuHcjbVCqErHw 1 0 0 0 226b 226b
green open .kibana_task_manager_7.17.9_001 B6EtTVIwQFCACrzwJq7sTg 1 0 17 63946 6.4mb 6.4mb
green open .async-search I5Wb0pPKREOpXiMjpAprgg 1 0 0 0 249b 249b
green open .tasks SMgbzuBXRky2hw55O7q_uA 1 0 6 0 35kb 35kb