In this article, we will learn how to configure email alerts in Grafana, a powerful open-source platform used for monitoring and observability. Email alerts are an essential feature of Grafana’s alerting system, providing immediate notification of critical events or anomalies detected in monitored metrics. By setting up email alerts, users can stay informed about important changes in their systems and take proactive measures to address any issues.
Table of Contents
Prerequisites
- AWS Account with Ubuntu 22.04 LTS EC2 Instance.
- Basic knowledge of AWS services, Prometheus and Grafana.
Step #1:Install Prometheus on Ubuntu
Download the latest version of Prometheus from the GitHub repository using the following command.
wget https://github.com/prometheus/prometheus/releases/download/v2.30.0/prometheus-2.30.0.linux-amd64.tar.gz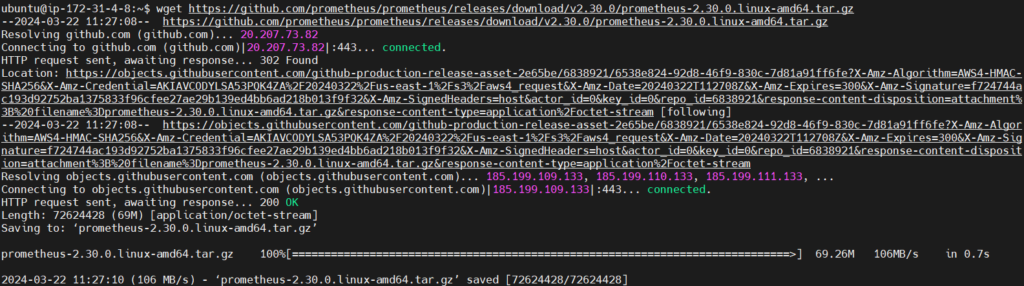
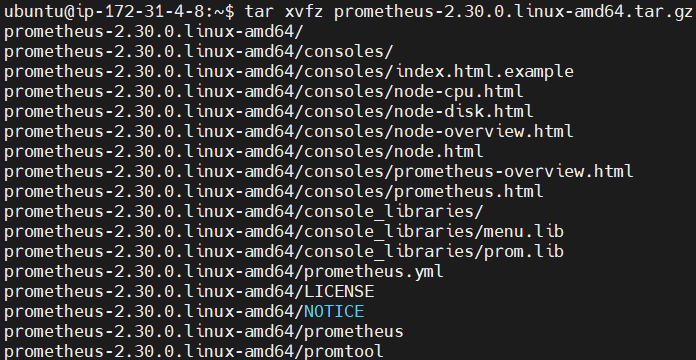
extract the downloaded archives.
tar xvfz prometheus-2.30.0.linux-amd64.tar.gzThe command extracts the contents of the file prometheus-2.30.0.linux-amd64.tar.gz
now navigate to the extracted directory using following command.
cd prometheus-2.30.0.linux-amd64
navigate to the /etc/systemd/system, this is where typically systemd unit files are located, which are used for managing services on Linux systems.
cd /etc/systemd/system
now lets create a service for Prometheus named prometheus.service.
sudo vi prometheus.service
add the following content into it.
[Unit]
Description=Prometheus
Wants=network-online.target
After=network-online.target

[Service]
ExecStart=/home/ubuntu/prometheus-2.30.0.linux-amd64/prometheus --config.file=/home/ubuntu/prometheus-2.30.0.linux-amd64/prometheus.yml
Restart=always

[Install]
WantedBy=default.target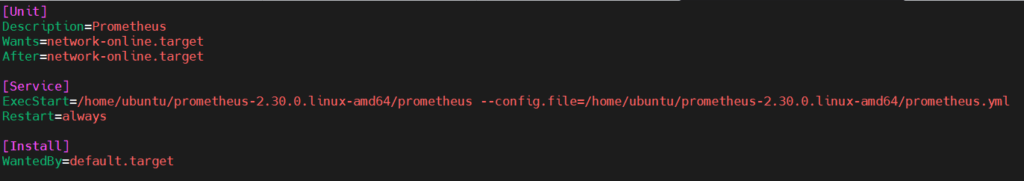
Now our prometheus.service is created.
After this
Reload the daemon service, enable, and start the Prometheus service:
sudo systemctl daemon-reload
sudo systemctl enable prometheus.service
sudo systemctl start prometheus.service
now Verify the status of the Prometheus service using following command:
sudo systemctl status prometheus.service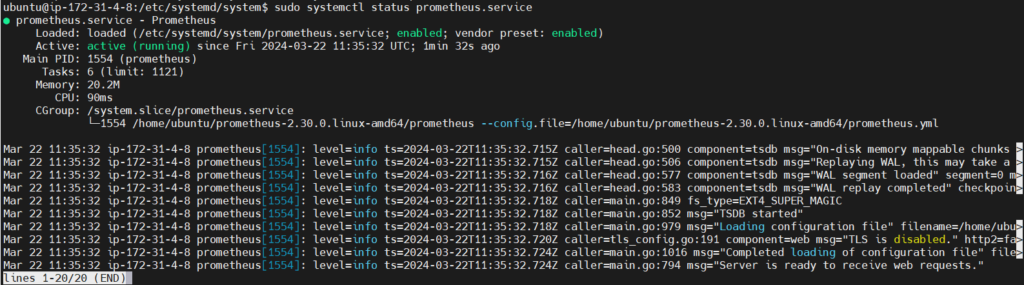
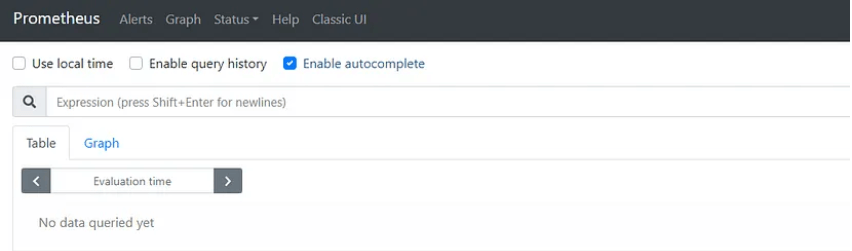
If your service is running properly then you can run prometheus by running
Public IP:9090 which is default port for prometheus in url.
Step #2:Install Grafana on Ubuntu
First import the GPG key used by the Grafana package.
wget -q -O - https://packages.grafana.com/gpg.key | sudo apt-key add -
then add the Grafana repository to the APT sources.
sudo add-apt-repository "deb https://packages.grafana.com/oss/deb stable main"
After adding the repository update the package lists
sudo apt update
then install the grafana.
sudo apt install grafana
Start and enable the Grafana service.
sudo systemctl start grafana-server
sudo systemctl enable grafana-server
and if everything works fine and your service is running properly then run grafana by running your Public IP:3000 which is default port of grafana in searchbar.
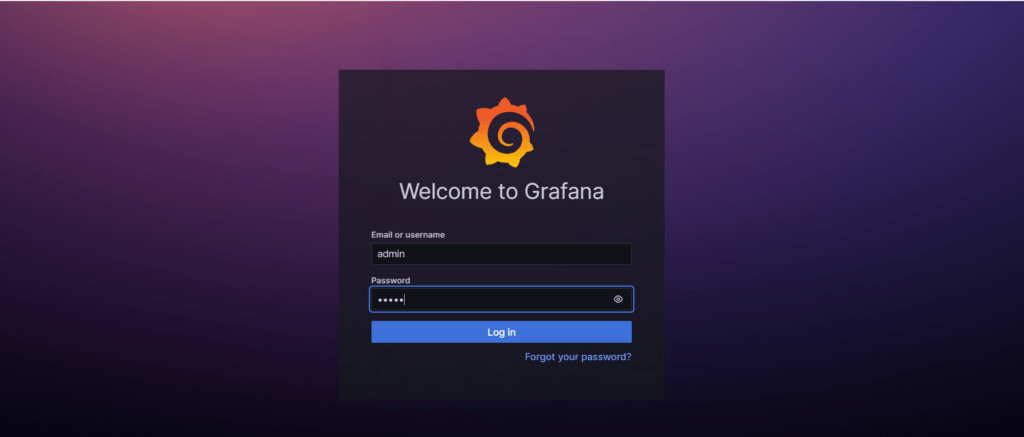
you will see the login page of grafana (UI) user interface
Grafana uses admin as a default username and password.
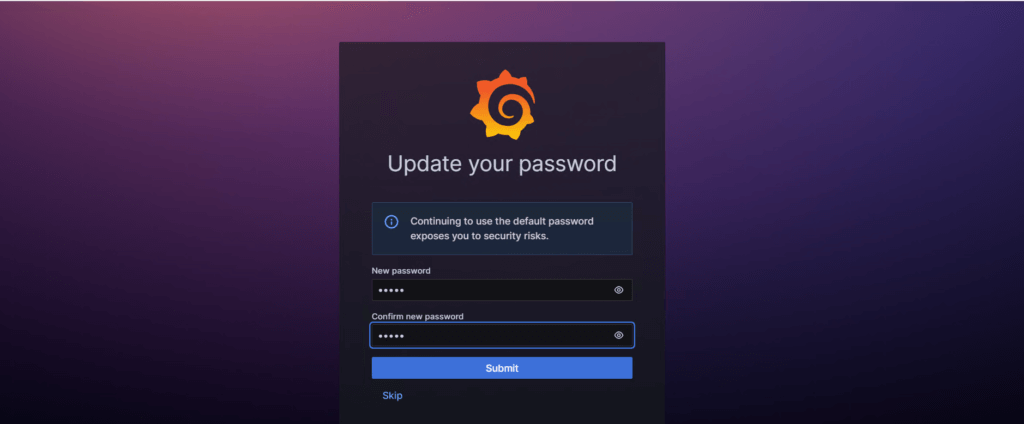
it will ask for changing the password you can change it or skip it.
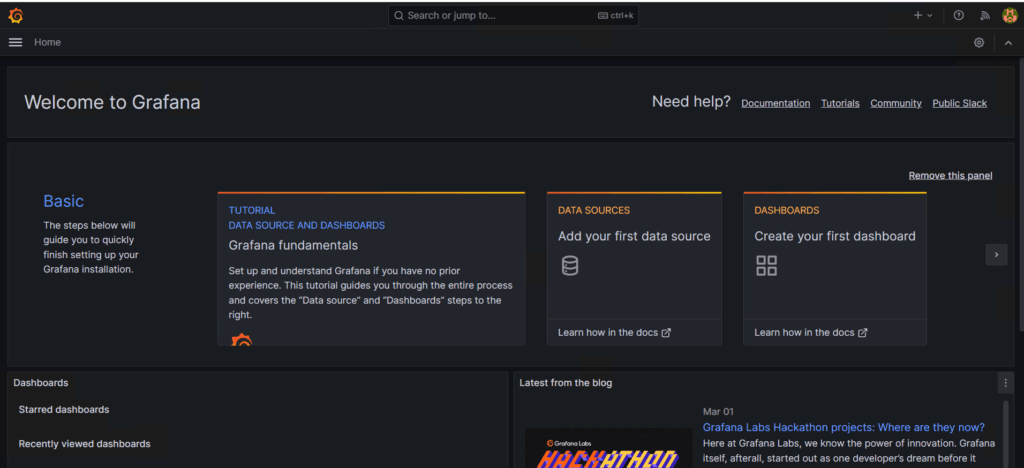
then you will see the welcome page of grafana.
Step #3:Configure SMTP Settings
To enable email alerts, Grafana requires SMTP (Simple Mail Transfer Protocol) configuration. SMTP settings specify the email server through which Grafana will send alert notifications.
So first we need to retrieve the password to give in smtp configuration.
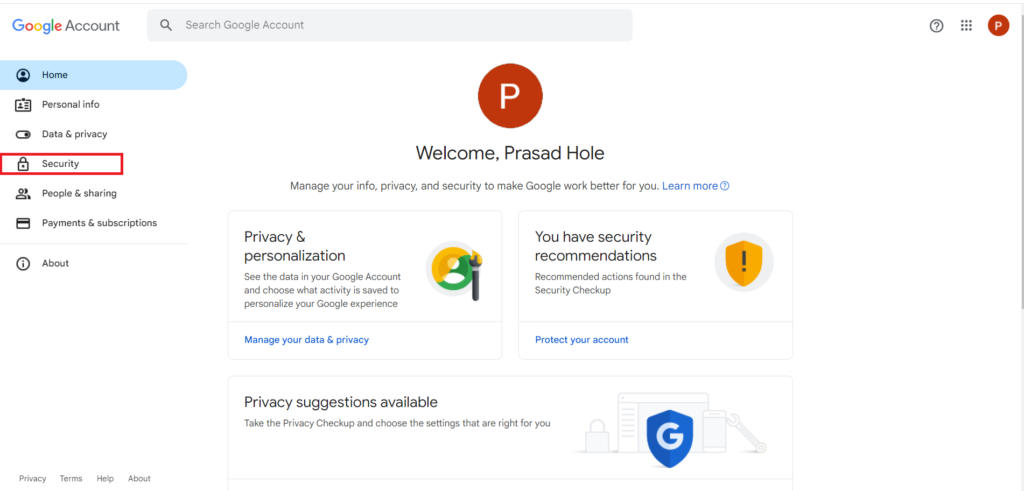
Go to your google account.. Then go to security.
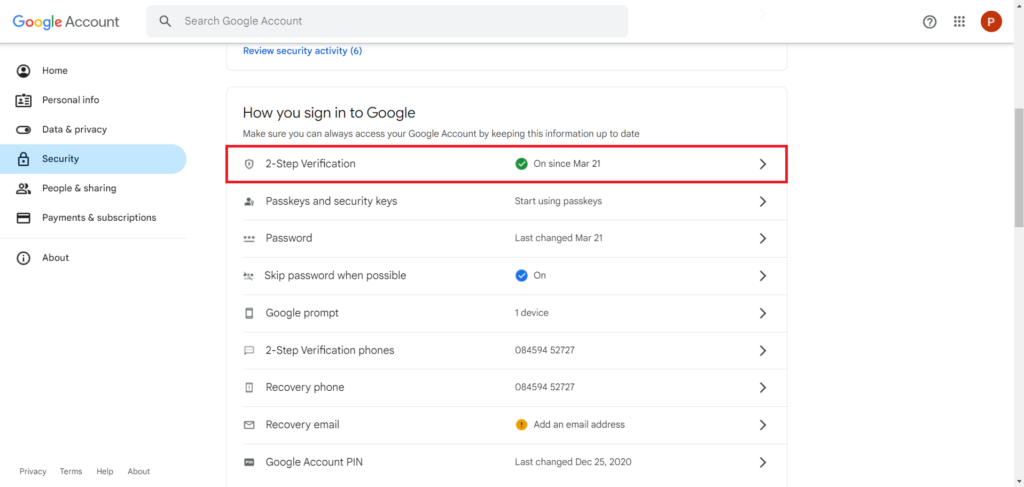
In the How you sign in to Google, select 2-step verification.
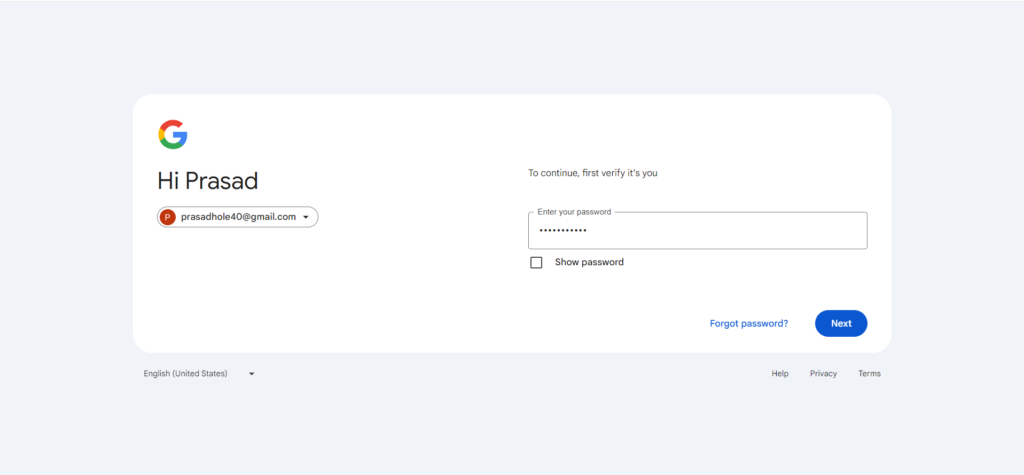
Enter your google account password to verify it’s you.
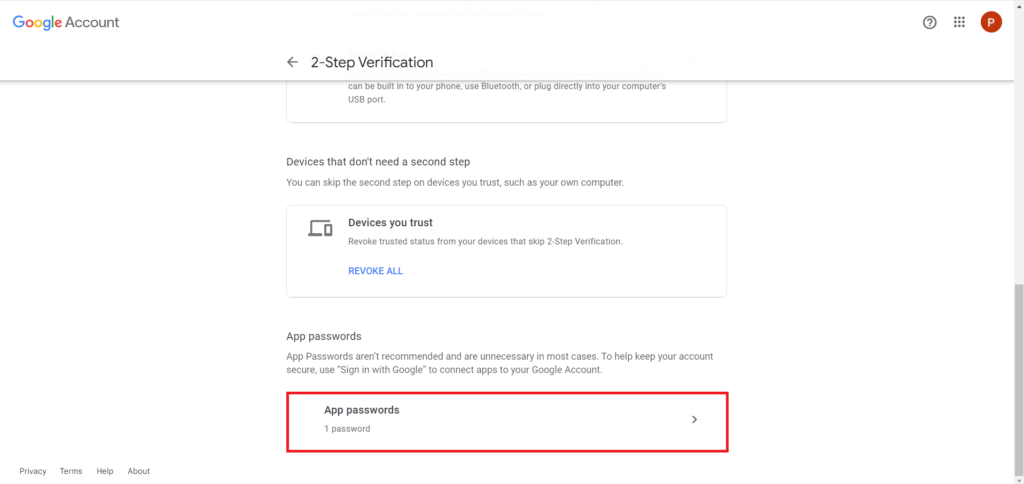
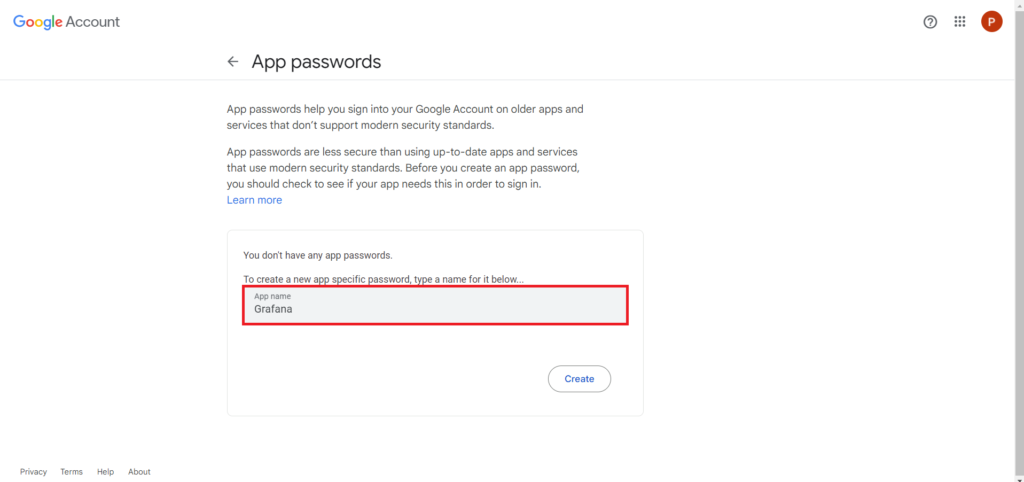
Scroll down and select the App passwords
Now Enter the app name for which you wanted to get the app password like Grafana.
And click on Create to create it
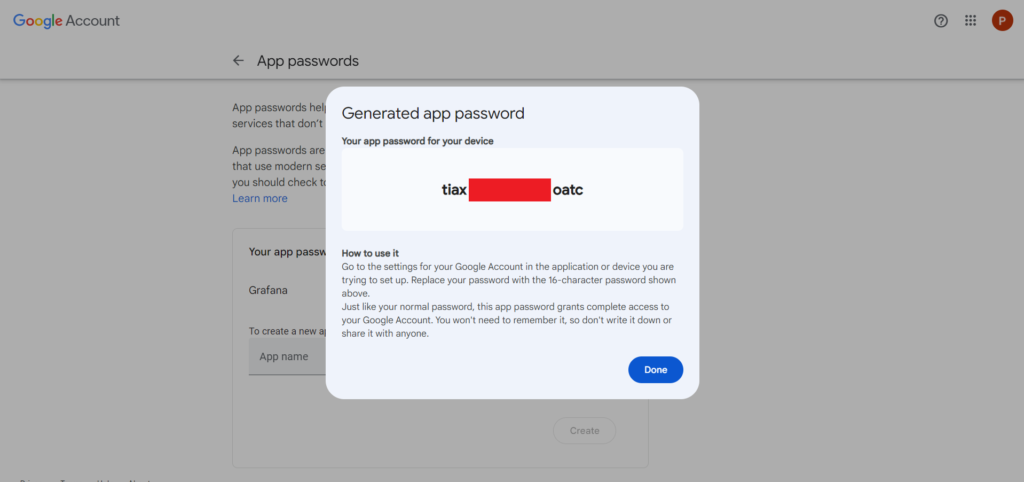
the password will be generated. Note it down cause will be using it in SMTP configuration.
now open /etc/grafana/grafana.ini file.
sudo nano /etc/grafana/grafana.ini
edit it as shown below.
[smtp]
enabled = true
host = smtp.gmail.com:587
user = [email protected]
password = your app password
skip_verify = true
from_address = [email protected]
from_name = Grafana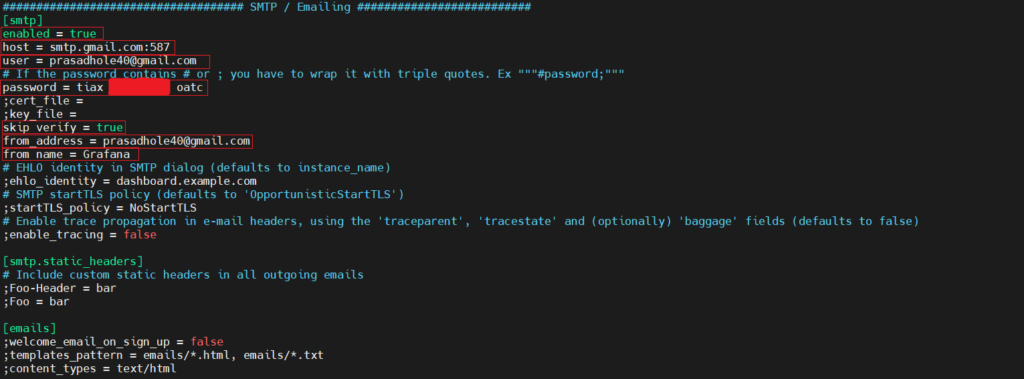
save it and restart the grafana server.
sudo systemctl restart grafana-server
Step #4:Add Prometheus as a data source in Grafana
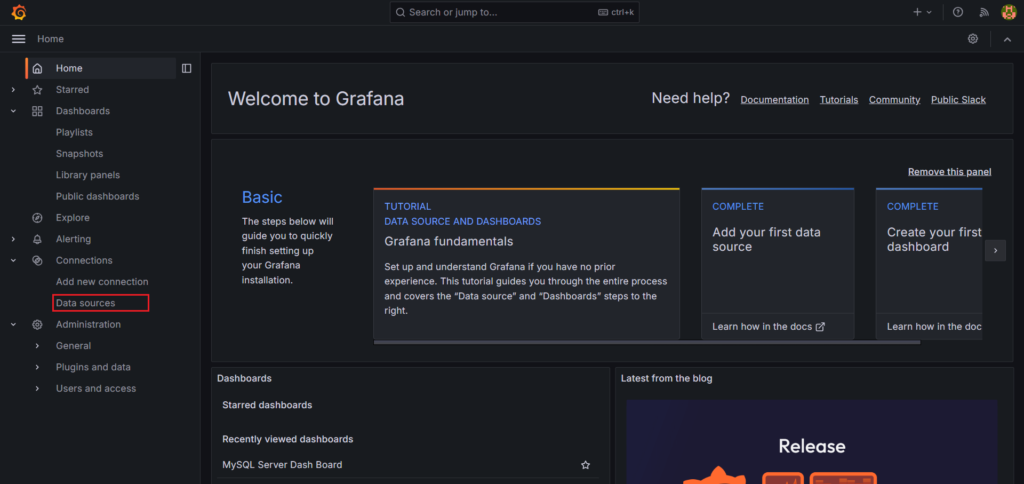
Now go to the Grafana welcome page. Go to the Home in the left top corner.
Then go to the Connections and select the Data sources option.
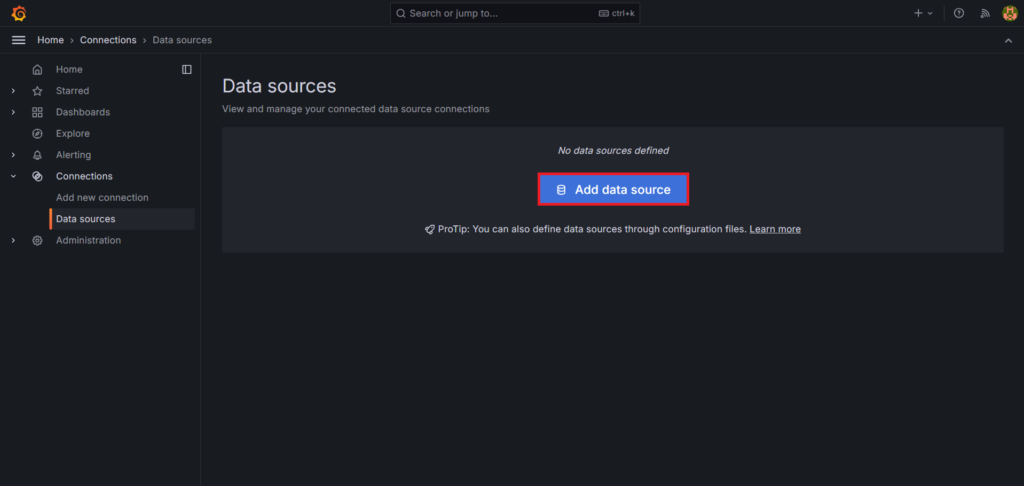
Click on Add Data Source
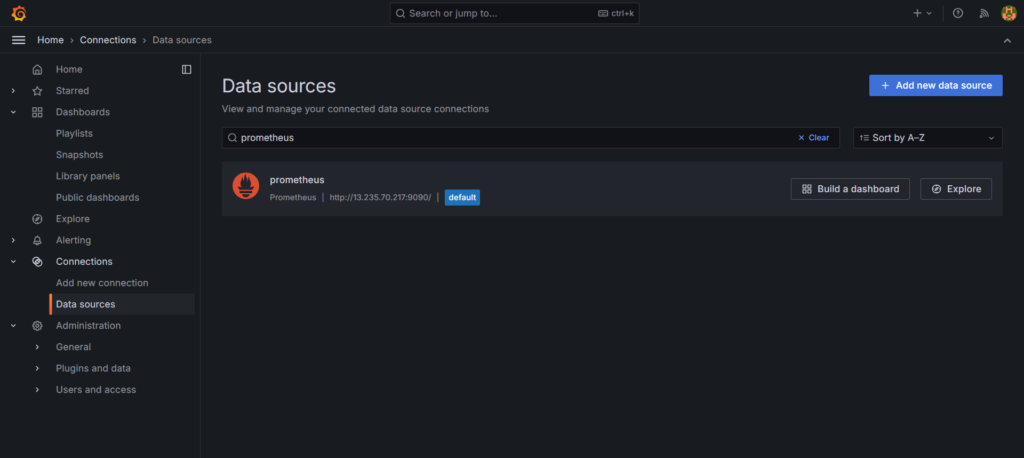
Search for Prometheus in the search bar and select it.
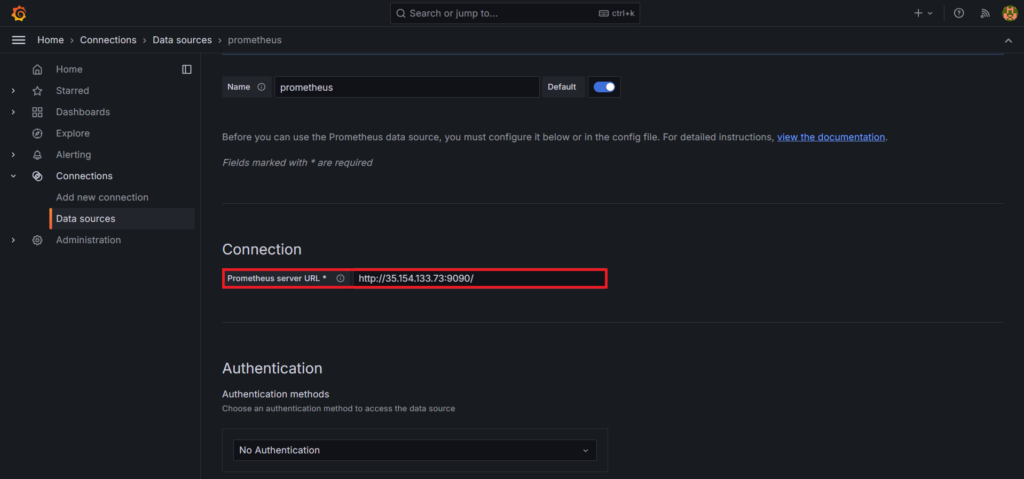
In connection, in Prometheus server URL, give the server url on which our prometheus is running.
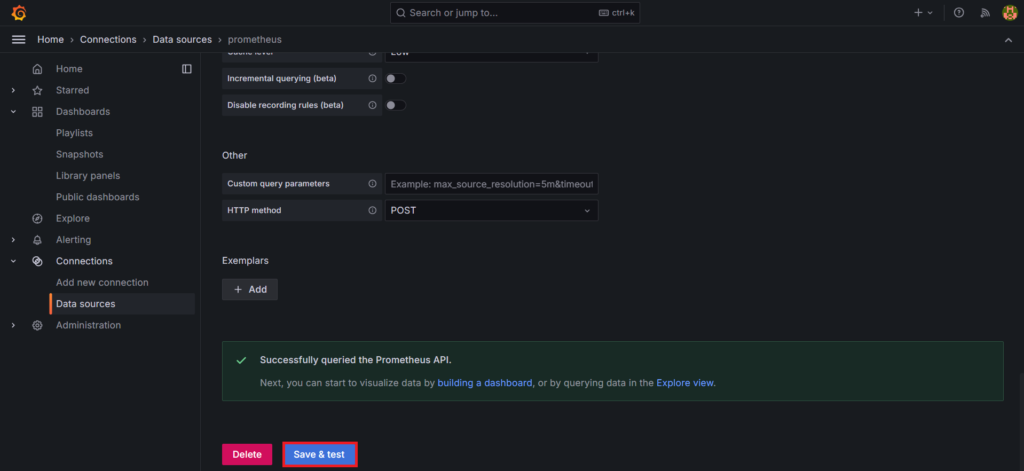
after this click on save and test button. You will see the message for prometheus being successfully queried.
Step #5:Add a Contact points
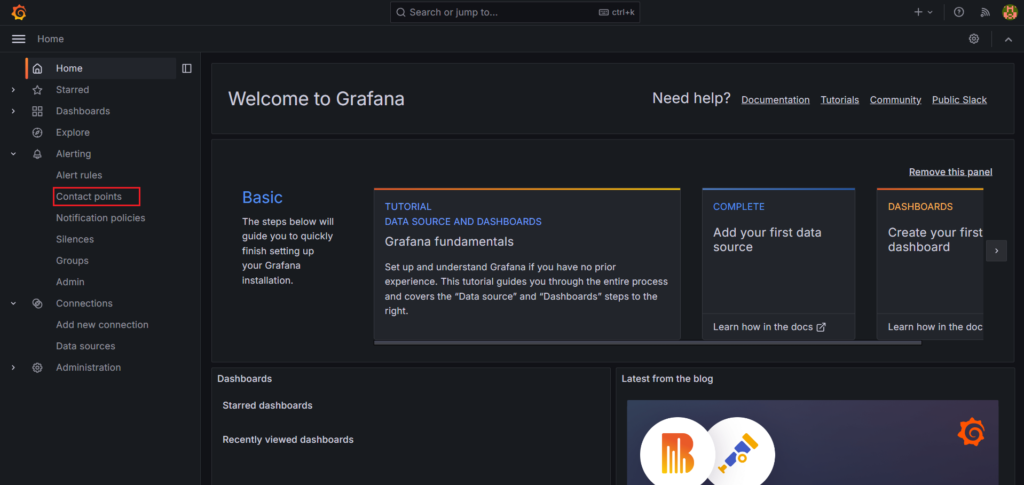
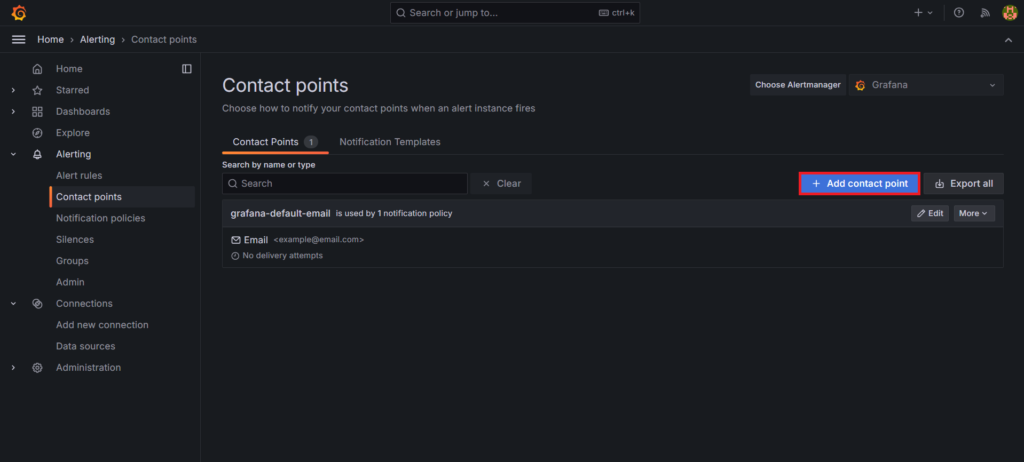
Get back to the Grafana home page and select the Alerting > Contact points.
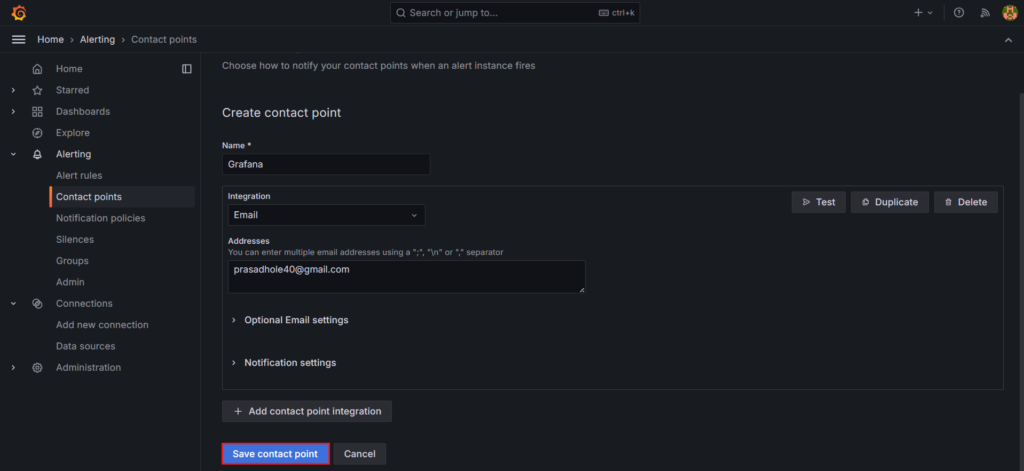
click on Add contact point.
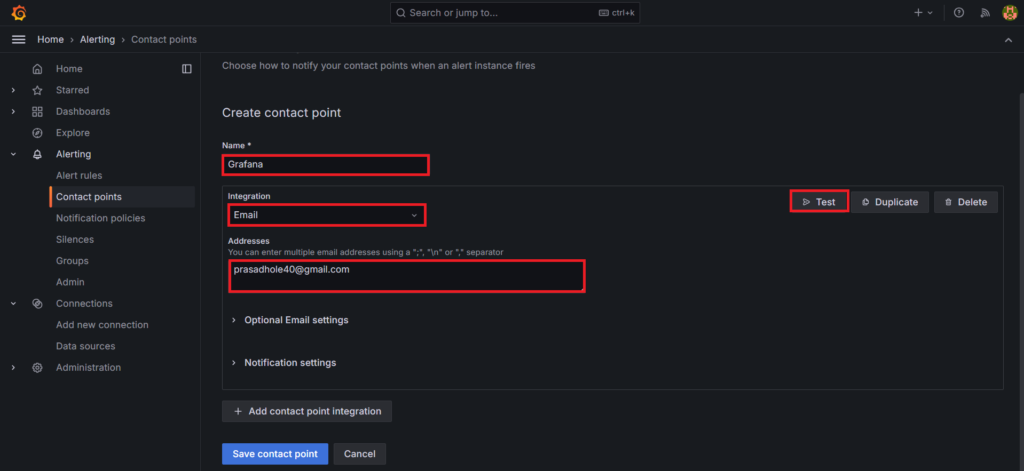
Give a appropriate name to your contact point. Like Grafana.
Select Email as a Integration
Then in addresses give the email id or id’s with comma separating them.
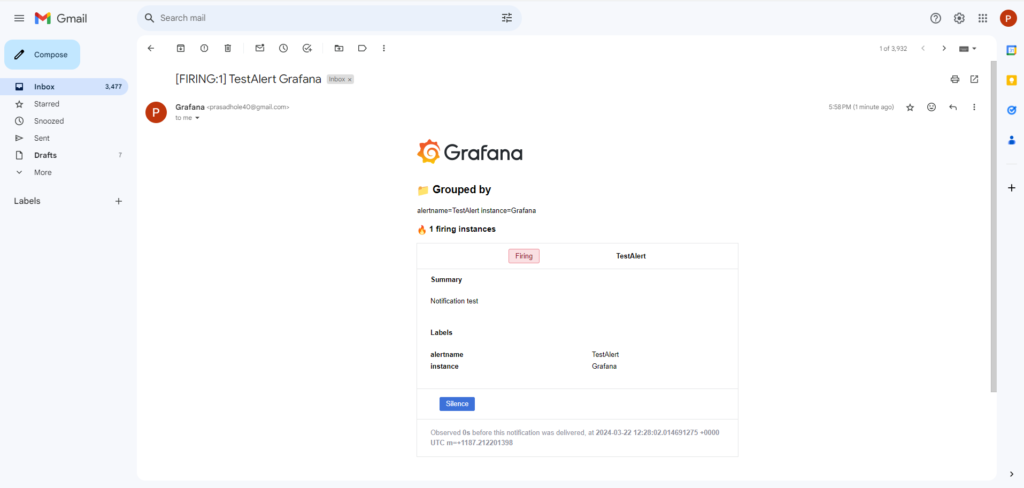
And click on Test to test it.
Click on Send test notification .
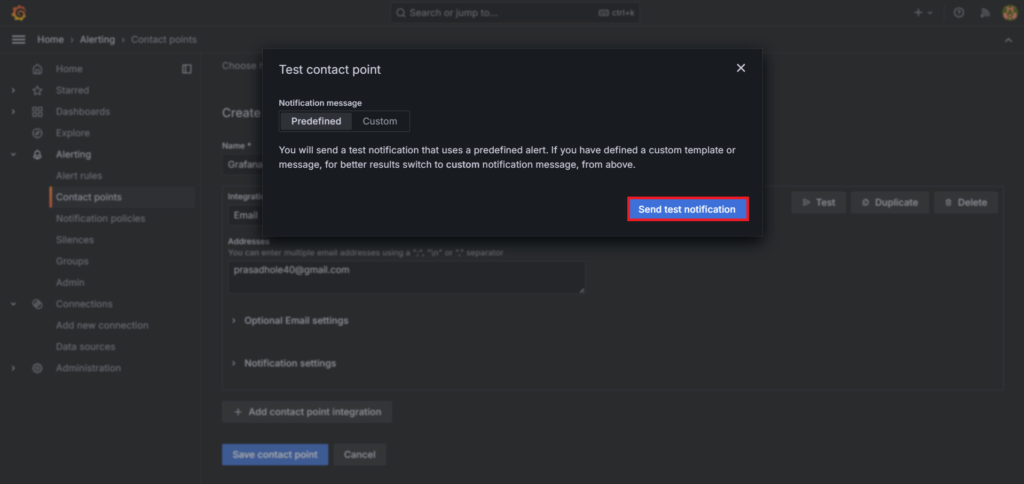
Now open your email id you’ve given, there you can see the test alert. Click on it.

after this go back to grafana and click on save contact point to save it.
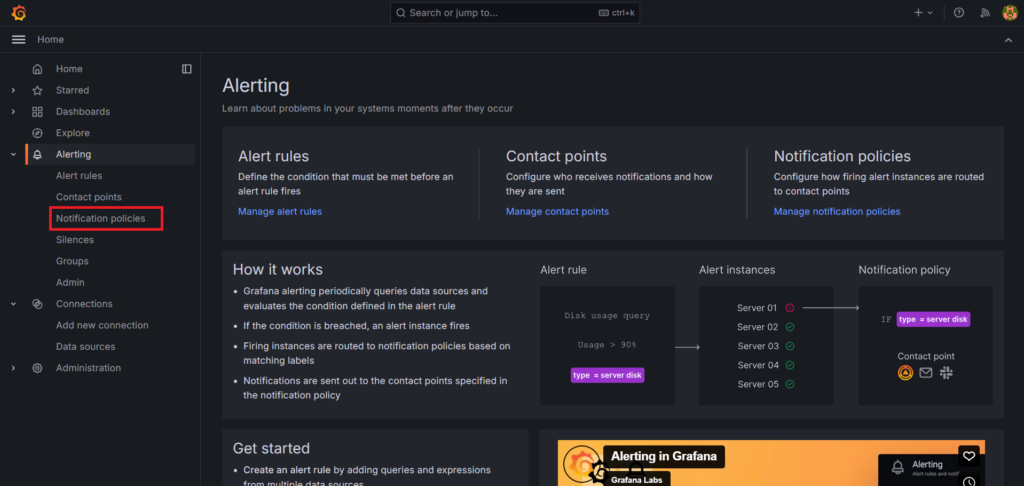
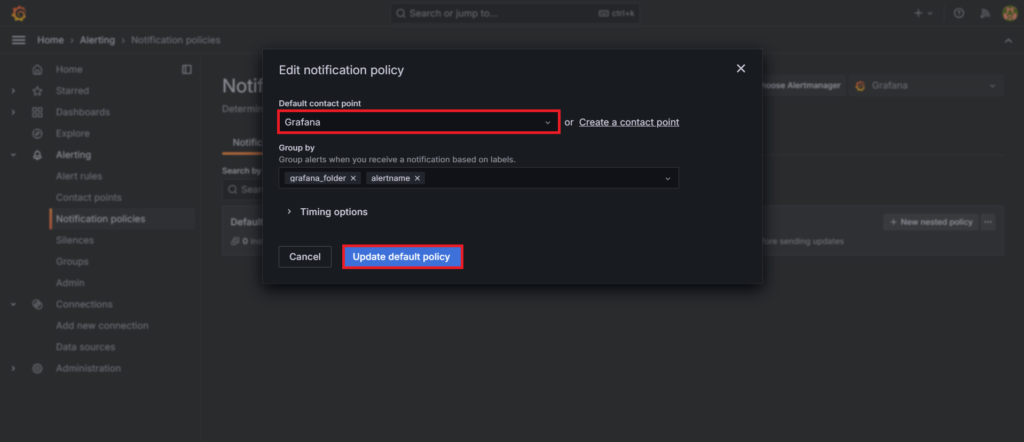
Step #6:Configure the Notification Policies
Now in alerting select the Notification policies.
There will be a default policy click and edit it.
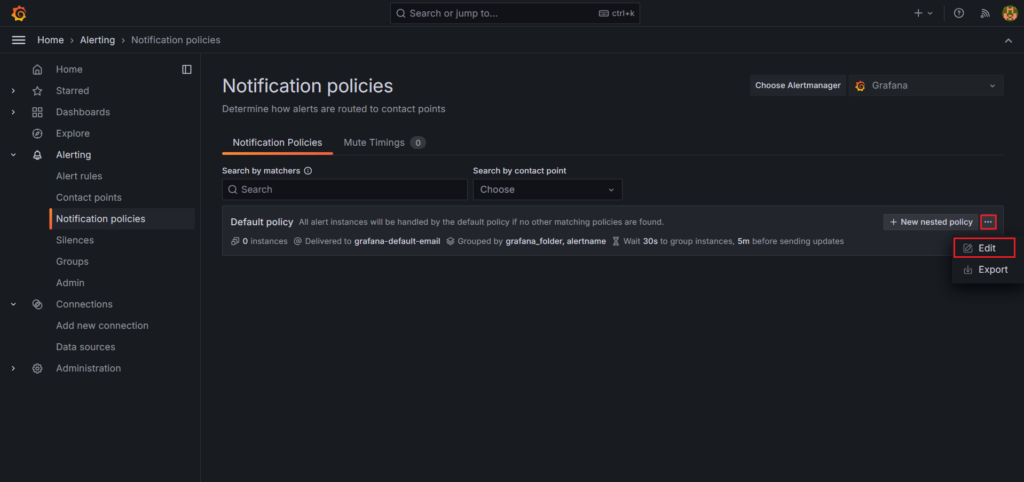
Change the default contact point to the one we had created. Here it is Grafana.
Then click on Update default policy.
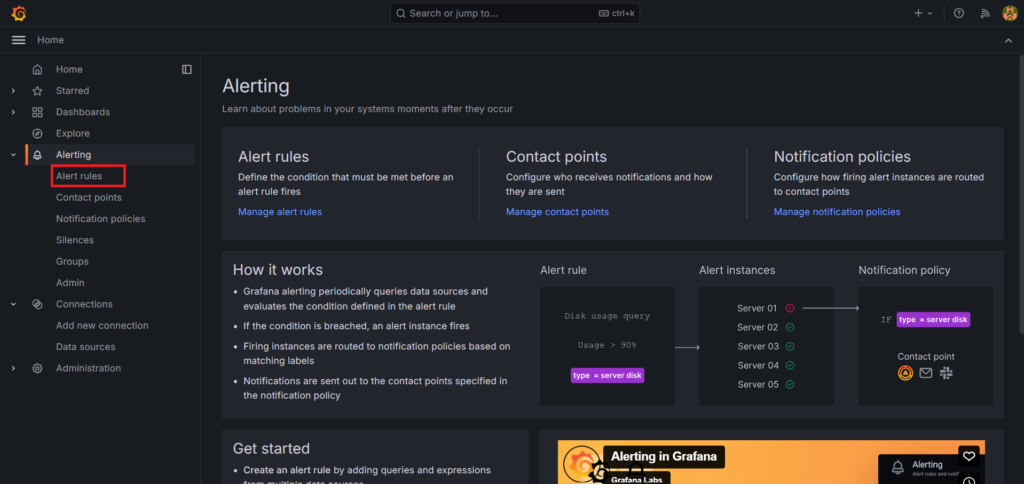
Step #7:Configure Alert Rules to get email alerts
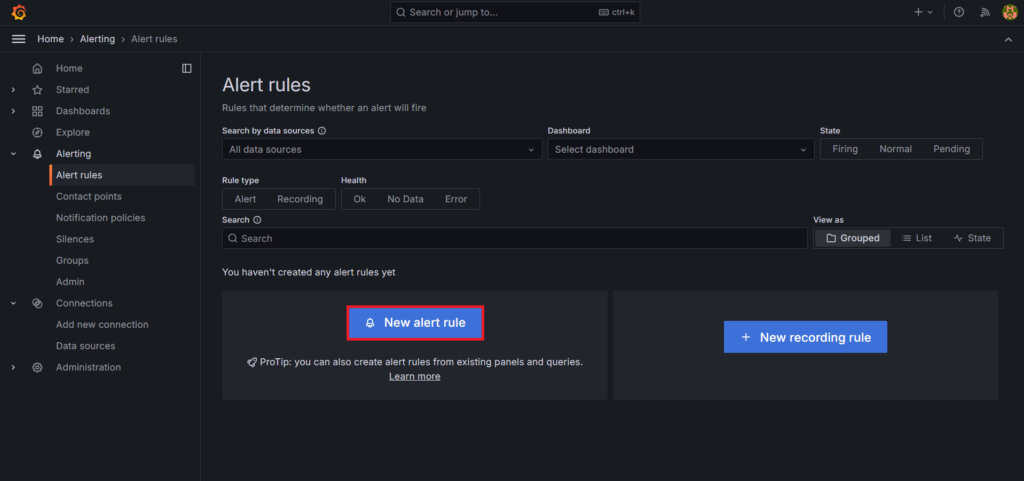
Now in Alerting Select the Alert rules .
select the New alert rule.
Here Enter alert rule name to identify your alert.
Define the query and alert condition.
- metric: process_cpu_seconds_total
- label filters: instance = localhost:9090
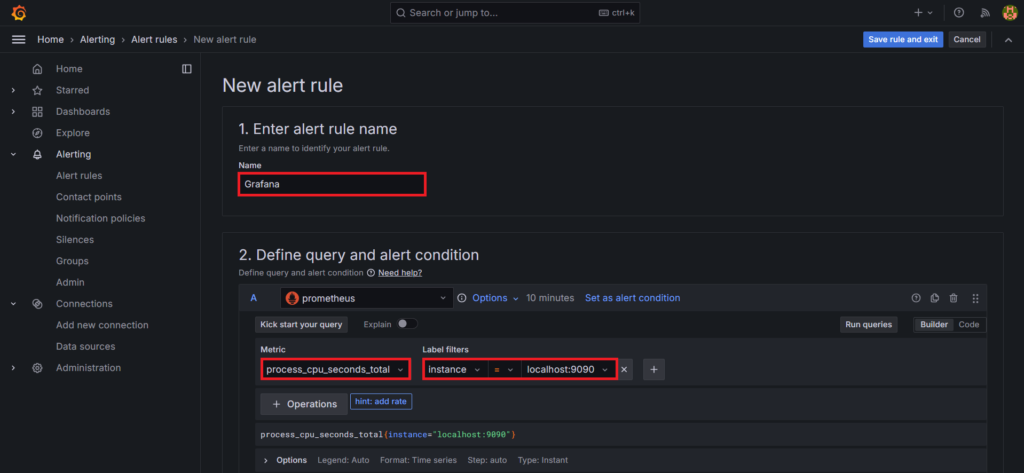
This query would retrieve the total CPU time consumed by all processes over time.
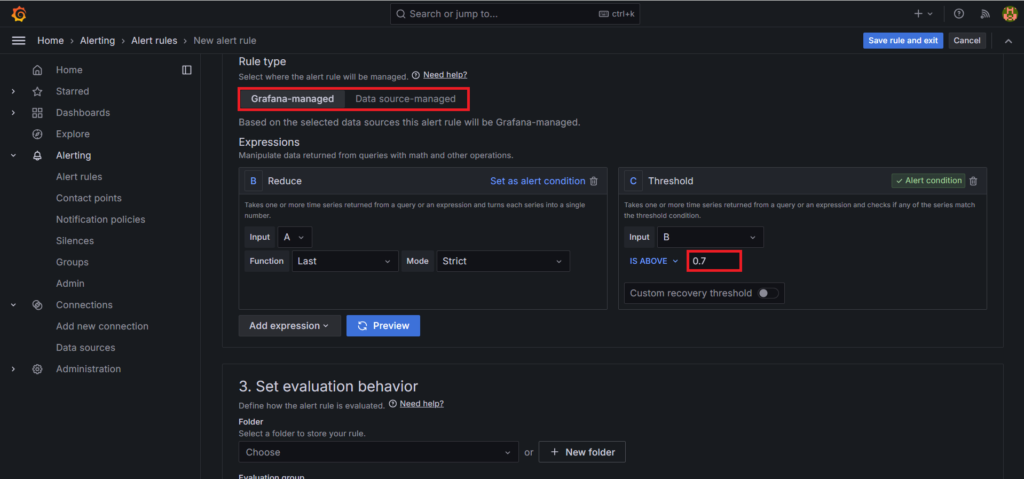
Now Select the Grafana-managed as Rule type. In the Expressions, set Threshold as alert condition and change the IS ABOVE to 0.7
When setting “IS ABOVE” to 0.7, you’re specifying that the alert should trigger when the value of the metric being monitored is above 70%. This value could represent a percentage, ratio, or any other unit depending on the metric being monitored.
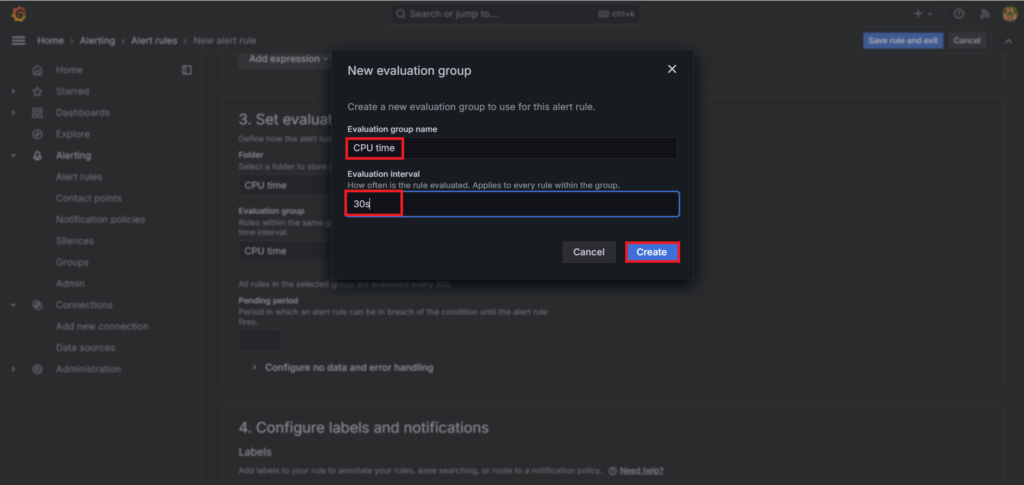
In Set evaluation behavior, create a new folder to store rule and evaluation group.
here folder name is CPU time.
Evaluation group name is CPU time and evaluation interval is 30 seconds which tells how often the rule is evaluated. Click on Create.
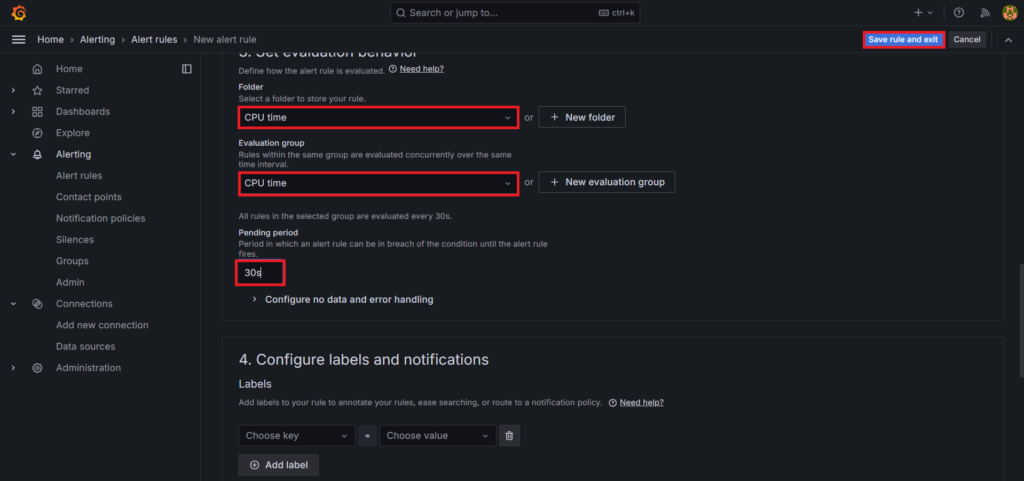
Change the pending period to 30 seconds. It should be equal to evaluation interval or less than it.
Finally click on Save rule and exit to trigger the email alerts.
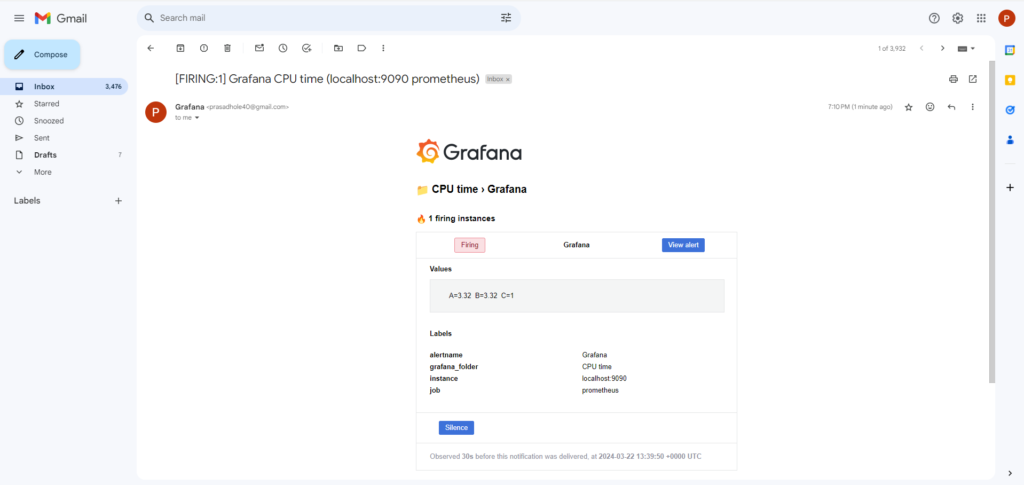
Now wait of 30 seconds till it fire the alert
Check your email box.
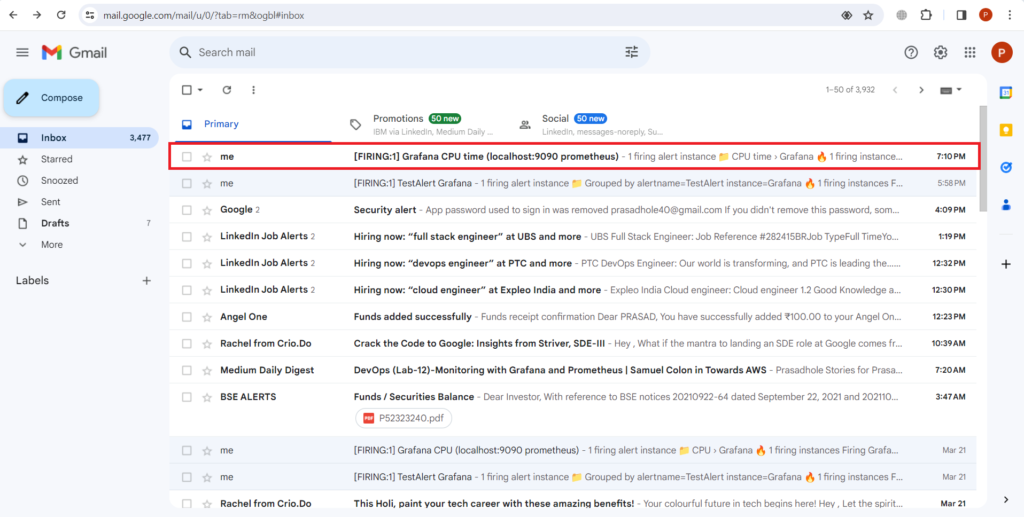
as you can see our alert is fired successfully.
with this you can receive timely Email alerts.
Conclusion:
Configuring email alerts in Grafana enables you to receive immediate notifications about critical events or anomalies detected in your monitoring data. By following the steps outlined in this guide, you can set up email notification channels, define alert rules, and ensure that you receive timely alerts via email. Effective alerting enhances your ability to monitor and respond to changes in your system’s health and performance, ultimately improving overall reliability and uptime.
Related Articles:
How to Monitor Redis with Prometheus and Grafana
Reference: