In this article, How to Install Grafana on Windows | we’ll guide you through the straightforward process of installing Grafana on a Windows system, unlocking its powerful data visualization capabilities.
Table of Contents
What is Grafana?
Grafana is an open source tool for performing data analytics, retrieving metrics that make sense of large amounts of data, and monitoring our apps using nice configurable dashboards.
Grafana integrates with a wide range of data sources, including Graphite, Prometheus, Influx DB, ElasticSearch, MySQL, PostgreSQL, and others. When connected to supported data sources, it provides web-based charts, graphs, and alerts.
Prerequisites
- Windows EC2 instance running.
- A Windows computer with special permission to make changes (like an admin).
- A file to install Grafana that fits your computer (it might be 32-bit or 64-bit).
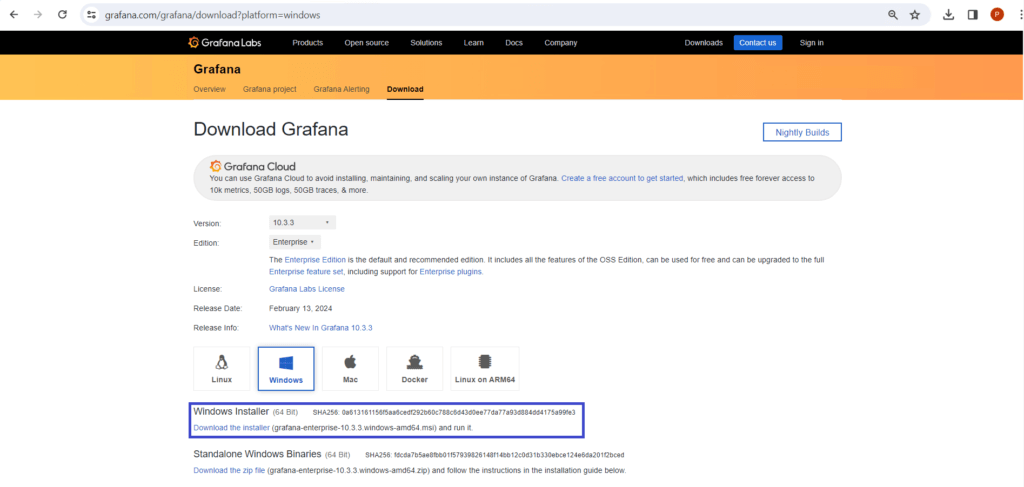
Step #1:Download Grafana on Windows Server
First, go to the Grafana website and get the right version for Windows. You can choose either the 32-bit or 64-bit one. Once you pick, download the file to your computer. We’ll be downloading the enterprise edition.
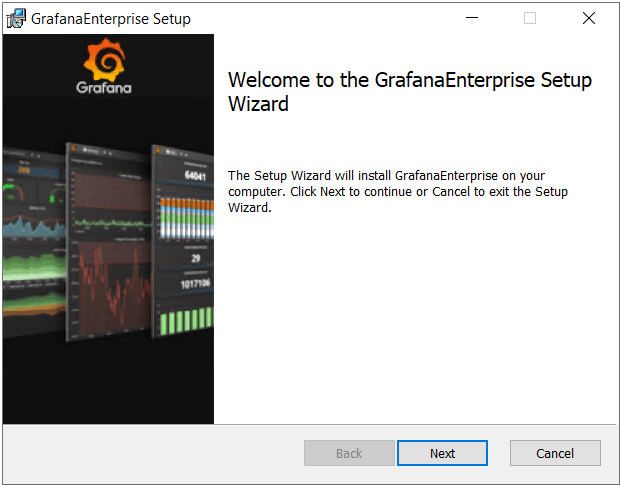
Step#2:Install Grafana on Windows Server
Find the file you downloaded and open it. This will start the installation process. Just follow what the computer tells you to do. Click on the “Next”.
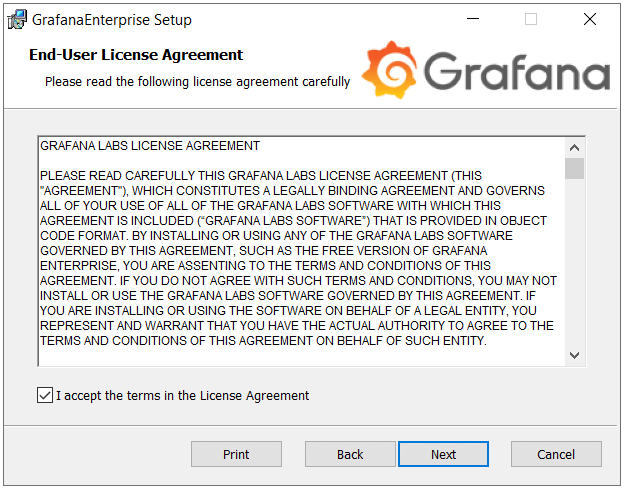
Accept the terms in the license agreement by clicking the checkbox.
Step#3:Choose Installation Location
While it’s installing, you’ll be asked where you want to put Grafana. Usually, the computer knows where to put it, but if you want to put it somewhere else, you can choose a different spot.

Step#4:Select the components to Install
Next, you can pick what parts of Grafana you want to put on your computer. The default choices are usually fine, so you can just click “Next.”
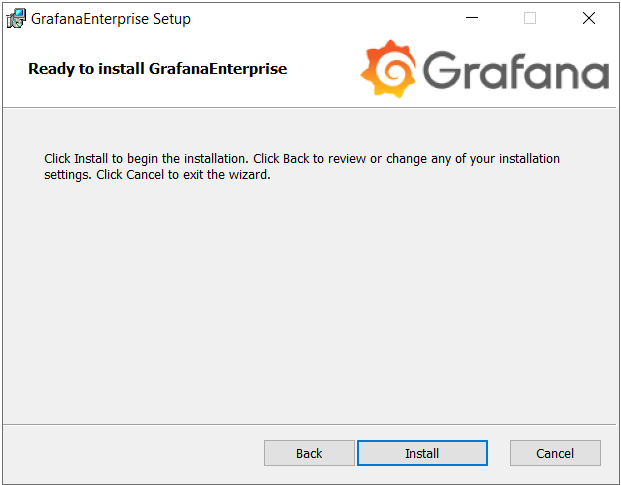
Step#5:Install Grafana on Windows
Once you’ve chosen everything, click “Install” to start putting Grafana on your computer.
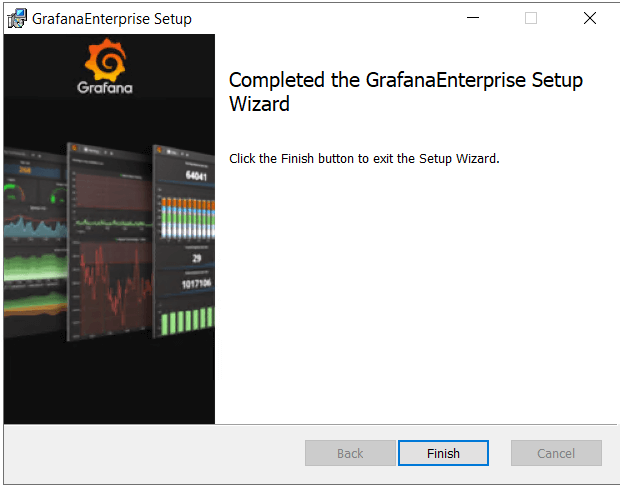
Step#6: Complete the Installation
After it’s done, you’ll see a message that says Grafana is installed. You can choose to start it up right away. Just click “Finish” when you’re ready.
Step#7:Access Grafana on Browser
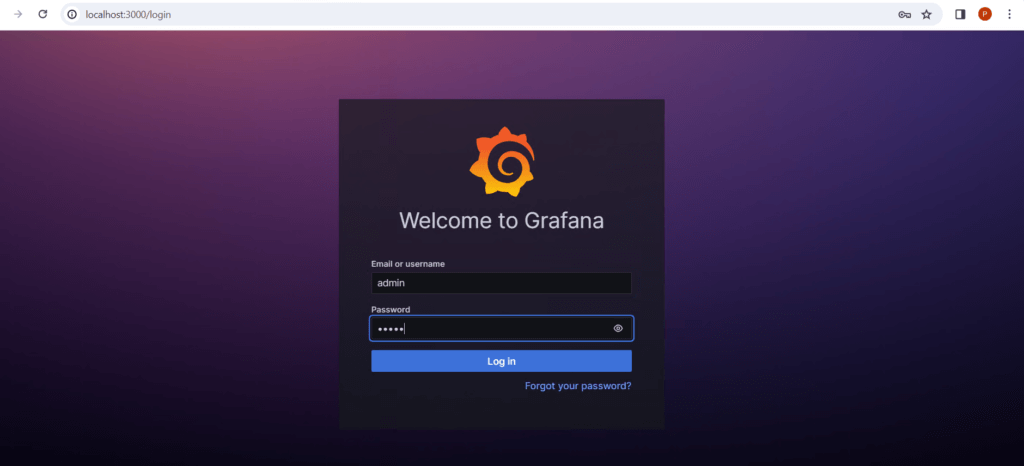
Then, open your web browser and type in “server IP or localhost:3000 to get to Grafana.
http://server_ip:3000When you open Grafana in your web browser, you’ll need to log in. The default username and password are both “admin.” It’s a good idea to change these to something else for safety.
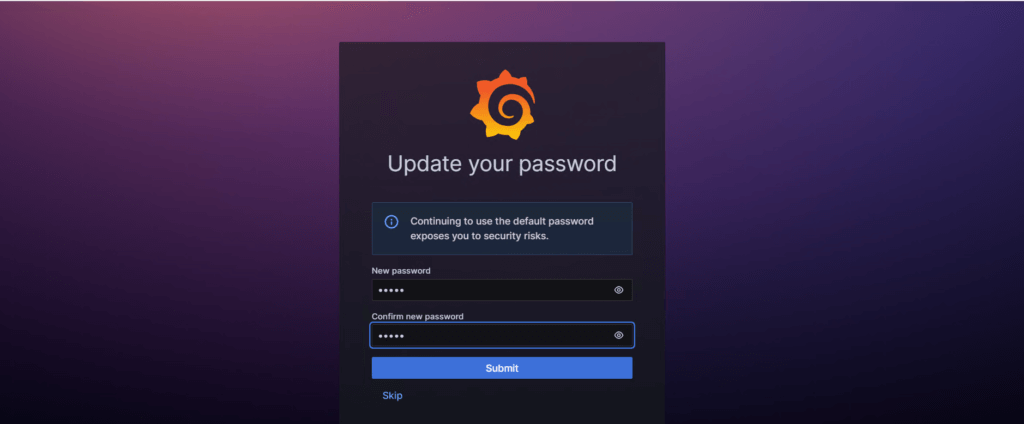
Change the default security credentials for enhanced security or you can just skip it.
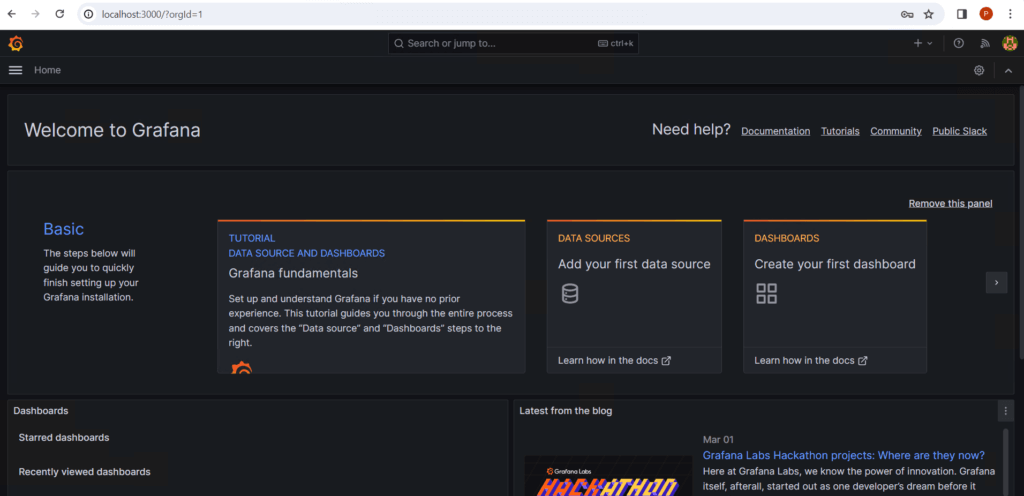
Now that Grafana is set up, you can start making charts and graphs with your data. You can configure data sources and create dashboards to visualize your data. Grafana supports various data sources, including databases, cloud services, and monitoring systems.
Conclusion:
We’ve successfully installed Grafana on our Windows machine. Grafana’s intuitive interface and powerful visualization capabilities empower to create insightful dashboards for monitoring and analyzing data. Explore Grafana’s features and create visualizations that help to gain valuable insights from metrics and time-series data.
Related Articles:
Secure Grafana with Nginx, Reverse Proxy and Certbot
Reference: