In this article we will learn about Alerting in the Elastic Stack. Alerting in the Elastic Stack empowers users to monitor real-time data, detect anomalies, and trigger automated actions when specific conditions are met. Integrated into Kibana’s Stack Management, this feature is essential for observability, security, and operational excellence. Whether you’re overseeing infrastructure, applications, or logs, Elastic Alerting ensures you stay informed and can act quickly.
Table of Contents
What is Alerting in the Elastic Stack?
Alerting allows you to monitor your data and receive notifications when certain conditions are met.
It is a part of Kibana, integrated into Stack Management. Its Use cases:
- Infrastructure monitoring
- Security alerts
- Application performance issues
- Log anomaly detection
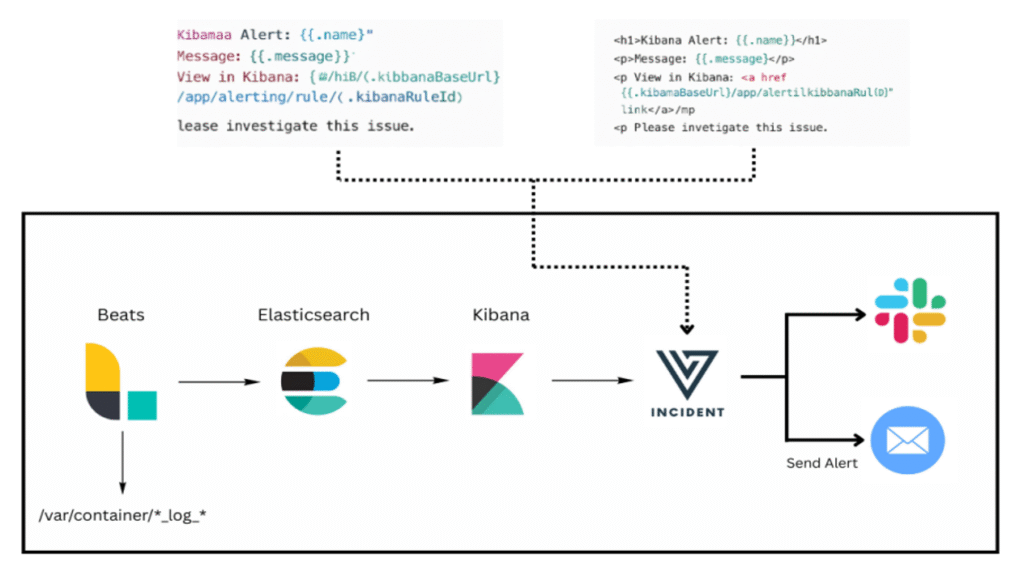
Elastic Stack Alerting Workflow
Key Concepts
- Rule (Alert Rule)
- Definition:
An Alert Rule is the definition of what you want to monitor. It continuously evaluates data in Elasticsearch and determines if specific conditions are met. - Example:
- You want to be alerted when the number of error logs exceeds 50 in the last 5 minutes.
- Rule Type: Log threshold rule
- Criteria: Count of logs where log.level = “error” is greater than 50 over 5 minutes
- Other Examples:
- CPU usage > 80% (metrics index)
- HTTP response time > 2 seconds (APM data)
- Definition:
- Trigger
- Definition:
A Trigger is the condition that, when met, causes the alert rule to fire.
The trigger is part of the alert rule and defines exactly when an action should be taken. - Example:
- In the rule to monitor error logs, the trigger could be:
- “If log error count > 50 within last 5 minutes” → then fire the alert
- You can also define thresholds like:
- Average response time > 2000ms
- Count of failed login attempts > 5 from the same IP
- Definition:
- Action
- Definition:
An Action is what happens when a trigger condition is met.
It notifies the relevant person or system. - Examples:
- Send an email to the support team
- Send a message to a Slack channel
- Call a Webhook to trigger another system (e.g., auto-scale server)
- Create an issue in Jira
- Example Template:
- Subject: High Error Rate Detected
- Message:
We detected more than 50 error logs in the last 5 minutes.
Timestamp: {{context.timestamp}}
Host: {{context.host.name}}
- Definition:
- Connector
- Definition:
A Connector is the integration configuration for an external service where actions are sent. Think of it as a saved endpoint with credentials and settings. You can reuse it across multiple alert rules. - Types of Connectors:
- Email: SMTP settings for sending emails
- Slack: Webhook URL for sending Slack messages
- Webhook: Any HTTP endpoint
- Index: Store alert data back into Elasticsearch
- Jira, ServiceNow, Teams, PagerDuty, etc.
- Example (Email Connector):
- SMTP Host: smtp.gmail.com
- Port: 587
- Username: [email protected]
- Password: [App-specific password]
- Sender: [email protected]
- Once created, this connector can be used in multiple alert rules.
- Definition:
Types of Alert Rules
Elastic Stack provides a rich variety of built-in alert types. These are pre-defined rules tailored for common observability and security use cases, spanning APM, logs, metrics, uptime, and machine learning.
Below is a table outlining the major alert rule types, their use cases, and license requirements:
| Category | Rule Type | Description | License |
| APM and User Experience | APM Anomaly | Alert on anomalies in latency, throughput, or failed transaction rate | Free |
| Error count threshold | Alert when error count in a service exceeds a threshold | Free | |
| Failed transaction rate threshold | Alert when transaction error rate exceeds threshold | Free | |
| Latency threshold | Alert when transaction latency exceeds threshold | Free | |
| Synthetics and Uptime | Synthetics monitor status | Alert when Synthetics monitor is down | Free |
| Synthetics TLS certificate | Alert when a TLS certificate is about to expire | Free | |
| Uptime monitor status | Alert when uptime status is down or availability breached | Free | |
| Uptime TLS | Alert when a TLS certificate in Uptime is expiring | Free | |
| Uptime Duration Anomaly | Alert on anomalous response duration in Uptime monitors | ❗ Platinum only | |
| Infrastructure | Inventory | Alert when monitored infrastructure (e.g., hosts) exceed CPU/memory/disk thresholds | Free |
| Metric threshold | Alert when aggregated metrics exceed a defined value | Free | |
| Logs | Log threshold | Alert when log count or aggregation meets/exceeds threshold | Free |
| Stack Alerts | Elasticsearch query | Alert when an Elasticsearch query returns matching results | Free |
| Observability | Custom threshold | Alert across any Observability data type using custom thresholds | Free |
| Machine Learning | Anomaly detection | Alert based on anomaly detection job results | ❗ Platinum only |
| SLOs | SLO burn rate | Alert when your SLO burn rate is too high over a defined time window | ❗ Platinum only |
These alert types allow teams to address infrastructure health, application performance, and security threats in a proactive way.
Connector Types: Free vs. Paid
Elastic Stack provides multiple connectors to deliver alerts. Some are available for free, while others require a Gold, Platinum, or Enterprise license, depending on the service’s criticality and integration complexity.
Here’s a breakdown of connector types and the license needed:
| Connector | Description | License Required |
| Index | Index data into Elasticsearch | Free |
| Server log | Add a message to Kibana server logs | Free |
| D3 Security | Trigger playbook workflows in D3 SOAR | Gold |
| Send email from your SMTP server | Gold | |
| Jira | Create issues/incidents in Jira | Gold |
| Microsoft Teams | Send messages to MS Teams channels | Gold |
| PagerDuty | Create/close alerts in PagerDuty | Gold |
| Slack | Send messages to Slack channels | Gold |
| Swimlane | Create records in Swimlane SOAR | Gold |
| Tines | Send events to Tines Story | Gold |
| Torq | Trigger Torq automation workflows | Gold |
| Webhook | Send HTTP request to a web service | Gold |
| Webhook – Case Management | Send HTTP request to a case management system | Gold |
| IBM Resilient | Create incident in IBM Resilient | Platinum |
| Opsgenie | Create/close alerts in Opsgenie | Platinum |
| ServiceNow ITOM | Create event in ServiceNow ITOM | Platinum |
| ServiceNow ITSM | Create incident in ServiceNow ITSM | Platinum |
| ServiceNow SecOps | Create incident in ServiceNow SecOps | Platinum |
| TheHive | Create cases and alerts in TheHive | Platinum |
| Amazon Bedrock | Send AI requests to Amazon Bedrock | Enterprise |
| CrowdStrike | Execute response actions via CrowdStrike | Enterprise |
| Google Gemini | Send prompts to Google Gemini AI | Enterprise |
| OpenAI | Send prompts to OpenAI / Azure OpenAI | Enterprise |
| Sentinel One | Send prompts to Google Gemini AI | Enterprise |
Using the right connector for the right alert ensures that the message reaches the correct team and system on time.
Elastic Cloud vs. Self-Managed Licensing
Elastic Stack can be deployed via Elastic Cloud (fully managed by Elastic) or Self-Managed (on your infrastructure). Each has differences in licensing, scalability, and feature availability.
Here’s a quick comparison:
| Feature | Elastic Cloud | Self-Managed (On-Prem) |
| Licensing Model | Subscription-based, managed by Elastic | Free (Basic), or paid licenses (Gold, Platinum, Enterprise) |
| License Activation | Automatically activated through Elastic account | Requires manual upload of license file |
| Scaling & Maintenance | Handled by Elastic (auto-scaling, upgrades, snapshots) | You manage hardware, scaling, backups, and upgrades |
| Connectors Availability | Full access based on plan tier | Limited or license-dependent |
| Trial Access | 30 – day trial available for all features. | Requires enabling trial license manually |
| Elastic Cloud Features | Includes exclusive features (e.g., autoscaling, Elastic AI) | Some advanced features may be unavailable |
| Support | Comes with SLA-backed Support (based on plan) | Requires separate support subscription |
Some alert connectors and rule types (like ML-based alerts, SLO Burn Rate, or AI integrations) are only available on Platinum or Enterprise tiers, whether on Elastic Cloud or self-managed.
Setting Up an Alert in Elastic Stack
Kibana provides an intuitive UI for creating and managing alerts. Here’s how you can set up a new alert from start to finish:
- Navigate to Kibana: Go to “Stack Management” -> “Rules and Connectors”.
- Create a New Rule: Choose the appropriate rule type (e.g., “Index threshold”, “Elasticsearch query”).
- Define Conditions: Specify the query, aggregation, or threshold that triggers the alert.
- Set Schedule: Determine how frequently the rule should check for the condition.
- Configure Actions:
- Add an action.
- Select a connector (e.g., Email, Slack, Webhook).
- Configure the message content using variables (e.g., {{context.timestamp}}, {{context.host.name}}).
- Save the Rule: The rule will start running based on its schedule.
Best Practices for Alerting in Elastic Stack
To maximize effectiveness and reduce alert fatigue, consider the following tips:
- Be Specific with Alert Rules
- Define clear thresholds or queries to reduce noise.
- Use filters to target exact data segments (e.g., service name, host).
- Avoid Alert Fatigue
- Tune thresholds carefully to avoid excessive alerting.
- Use deduplication and throttling options.
- Use Action Groups
- Group similar alert actions (e.g., notify via Slack and PagerDuty) to simplify management.
- Use the Right Connector
- For mission-critical alerts, prefer high-reliability channels like PagerDuty or Opsgenie.
- For logs/metrics debugging, use Index or Server Log.
- Combine Alerts with Dashboards
- Link alerts to Kibana dashboards for quick context and visual analysis.
These best practices help teams stay focused and act efficiently without being overwhelmed by irrelevant alerts.
Common Alerting Use Cases
Alerting in the Elastic Stack supports a wide variety of operational and business needs. Popular use cases include:
- Monitoring system infrastructure (CPU, memory, disk)
- Alerting on security threats (e.g., brute-force login attempts)
- Application performance degradation (e.g., high latency)
- Unusual log patterns or spikes (log anomalies)
- Service Level Objectives (SLO) violations
- Downtime or availability issues (uptime monitors)
Conclusion:
Elastic Stack Alerting brings together the powerful capabilities of Elasticsearch, Kibana, and external systems to ensure you’re never caught off guard by critical issues. Whether hosted on Elastic Cloud or self-managed, with the right rule definitions and connectors in place, you can automate incident response, minimize downtime, and boost operational awareness.
Related Articles:
Elastic Stack Tutorial for Beginners:ELK (Elasticsearch, Logstash, Kibana, Beats)
Reference: