In this article we are going to cover Install Helm 3 on Kubernetes, How to Install Prometheus and Grafana on Kubernetes using Helm 3, Access Prometheus and grafana web UI.
What is Prometheus ?
Prometheus is an open-source systems monitoring and alerting toolkit originally built at SoundCloud. It records real-time metrics in a time series database built using a HTTP pull model, with flexible queries and real-time alerting. It can absorb huge amount of data every second.
Table of Contents
What is Alert Manager ?
The Alertmanager handles alerts sent by client applications such as the Prometheus server. It takes care of deduplicating, grouping, and routing them to the correct receiver integration such as email, PagerDuty, or MS teams etc. It also takes care of silencing and inhibition of alerts.
What is Grafana ?
Grafana is open source visualization and analytics software. It allows you to query, visualize, alert on, and explore your metrics no matter where they are stored. It provides charts, graphs, and alerts for the web when connected to supported data sources such as Prometheus, graphite etc.
What is Helm Chart ?
A Helm Chart is a Package Manager tool for Kubernetes.
Prerequisites
- Kubernetes Cluster with v1.19.0+
#1: Install Helm 3 on Kubernetes Cluster
Install helm3 on Kubernetes Cluster on Kubernetes Cluster using below command
curl -fsSL -o get_helm.sh https://raw.githubusercontent.com/helm/helm/master/scripts/get-helm-3
chmod 700 get_helm.sh
./get_helm.sh
To check helm3 version
helm version
#2: Install Prometheus and Grafana on Kubernetes using Helm 3
Add the latest helm repository in Kubernetes
helm repo add stable https://charts.helm.sh/stable
Add the Prometheus community helm chart in Kubernetes
helm repo add prometheus-community https://prometheus-community.github.io/helm-charts
once added search Prometheus community helm chart to install
helm search repo prometheus-community
You will see available Prometheus and grafana helm chart to install
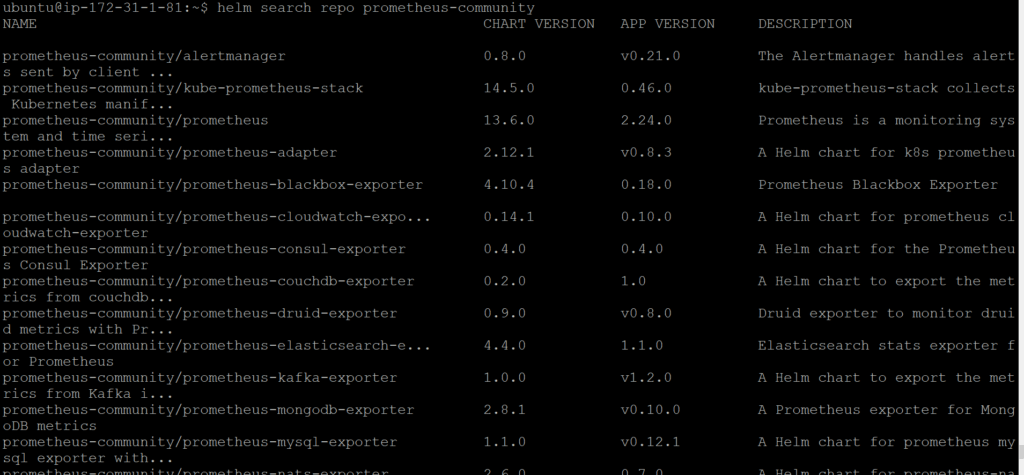
Prometheus and grafana helm chart moved to kube prometheus stack
Below is helm command to install kube-prometheus-stack
helm install [RELEASE_NAME] prometheus-community/kube-prometheus-stack
Lets install stable prometheus-community/kube-prometheus-stack
helm install stable prometheus-community/kube-prometheus-stack
once installed, you will see below output
Output:
helm install stable prometheus-community/kube-prometheus-stack
NAME: stable
LAST DEPLOYED: Fri Apr  9 11:53:08 2021
NAMESPACE: default
STATUS: deployed
REVISION: 1
NOTES:
kube-prometheus-stack has been installed. Check its status by running:
  kubectl --namespace default get pods -l "release=stable"

Visit https://github.com/prometheus-operator/kube-prometheus for instructions on how to create & configure Alertmanager and Prometheus instances using the Operator.
Lets check prometheus and grafana pods
kubectl get pods
Output:
NAME                                                     READY   STATUS    RESTARTS   AGE
alertmanager-stable-kube-prometheus-sta-alertmanager-0   2/2     Running   0          4m3s
prometheus-stable-kube-prometheus-sta-prometheus-0       2/2     Running   1          4m3s
stable-grafana-6fdd68bd8c-m8s59                          2/2     Running   0          4m34s
stable-kube-prometheus-sta-operator-7d89c8b9d8-6rpt5     1/1     Running   0          4m34s
stable-kube-state-metrics-5fd847bcbd-xdl4g               1/1     Running   0          4m34s
stable-prometheus-node-exporter-479lc                    1/1     Running   0          4m34s
stable-prometheus-node-exporter-nzx5h                    1/1     Running   0          4m34s
Lets check prometheus and grafana services
kubectl get svc
Output:
NAME                                      TYPE        CLUSTER-IP       EXTERNAL-IP   PORT(S)                      AGE
alertmanager-operated                     ClusterIP   None             <none>        9093/TCP,9094/TCP,9094/UDP   4m13s
kubernetes                                ClusterIP   100.64.0.1       <none>        443/TCP                      10m
prometheus-operated                       ClusterIP   None             <none>        9090/TCP                     4m13s
stable-grafana                            ClusterIP   100.65.58.48     <none>        80/TCP                       4m44s
stable-kube-prometheus-sta-alertmanager   ClusterIP   100.68.38.188    <none>        9093/TCP                     4m44s
stable-kube-prometheus-sta-operator       ClusterIP   100.67.54.161    <none>        443/TCP                      4m44s
stable-kube-prometheus-sta-prometheus     ClusterIP   100.67.172.242   <none>        9090/TCP                     4m44s
stable-kube-state-metrics                 ClusterIP   100.69.46.211    <none>        8080/TCP                     4m44s
stable-prometheus-node-exporter           ClusterIP   100.66.152.213   <none>        9100/TCP                     4m44s
We have covered Install Prometheus and Grafana on Kubernetes using Helm 3.
#3: Edit Prometheus Service
By default prometheus and grafana service is available within the cluster using ClusterIP, to access it outside lets change it either NodePort or Loadbalancer.
kubectl edit svc stable-kube-prometheus-sta-prometheus
Here we are changing from ClusterIP to LoadBalancer/NodePort
# Please edit the object below. Lines beginning with a '#' will be ignored,
# and an empty file will abort the edit. If an error occurs while saving this file will be
# reopened with the relevant failures.
#
apiVersion: v1
kind: Service
metadata:
  annotations:
    meta.helm.sh/release-name: stable
    meta.helm.sh/release-namespace: default
  creationTimestamp: "2021-04-09T11:53:24Z"
  finalizers:
  - service.kubernetes.io/load-balancer-cleanup
  labels:
    app: kube-prometheus-stack-prometheus
    app.kubernetes.io/managed-by: Helm
    chart: kube-prometheus-stack-14.5.0
    heritage: Helm
    release: stable
    self-monitor: "true"
  name: stable-kube-prometheus-sta-prometheus
  namespace: default
  resourceVersion: "7902"
  selfLink: /api/v1/namespaces/default/services/stable-kube-prometheus-sta-prometheus
  uid: 9042a504-d25f-4122-b6aa-52ed5e53b576
spec:
  clusterIP: 100.67.172.242
  externalTrafficPolicy: Cluster
  ports:
  - name: web
    nodePort: 31942
    port: 9090
    protocol: TCP
    targetPort: 9090
  selector:
    app: prometheus
    prometheus: stable-kube-prometheus-sta-prometheus
  sessionAffinity: None
  type: LoadBalancer
#4: Edit Grafana Service
Now edit the grafana service
kubectl edit svc stable-grafana
Change from ClusterIP to LoadBalancer/NodePort
# Please edit the object below. Lines beginning with a '#' will be ignored,
# and an empty file will abort the edit. If an error occurs while saving this file will be
# reopened with the relevant failures.
#
apiVersion: v1
kind: Service
metadata:
  annotations:
    meta.helm.sh/release-name: stable
    meta.helm.sh/release-namespace: default
  creationTimestamp: "2021-04-09T11:53:24Z"
  finalizers:
  - service.kubernetes.io/load-balancer-cleanup
  labels:
    app.kubernetes.io/instance: stable
    app.kubernetes.io/managed-by: Helm
    app.kubernetes.io/name: grafana
    app.kubernetes.io/version: 7.4.5
    helm.sh/chart: grafana-6.6.4
  name: stable-grafana
  namespace: default
  resourceVersion: "8222"
  selfLink: /api/v1/namespaces/default/services/stable-grafana
  uid: 7ebeb0da-858f-4232-8904-560e7ce83c5b
spec:
  clusterIP: 100.65.58.48
  externalTrafficPolicy: Cluster
  ports:
  - name: service
    nodePort: 31258
    port: 80
    protocol: TCP
    targetPort: 3000
  selector:
    app.kubernetes.io/instance: stable
    app.kubernetes.io/name: grafana
  sessionAffinity: None
  type: LoadBalancer
Verify the service if changed to LoadBalancer
kubectl get svc
Output:
NAME                                      TYPE           CLUSTER-IP       EXTERNAL-IP                                                               PORT(S)                      AGE
alertmanager-operated                     ClusterIP      None             <none>                                                                    9093/TCP,9094/TCP,9094/UDP   46m
kubernetes                                ClusterIP      100.64.0.1       <none>                                                                    443/TCP                      52m
prometheus-operated                       ClusterIP      None             <none>                                                                    9090/TCP                     46m
stable-grafana                            LoadBalancer   100.65.58.48     a7ebeb0da858f42328904560e7ce83c5-996403152.ap-south-1.elb.amazonaws.com   80:31258/TCP                 46m
stable-kube-prometheus-sta-alertmanager   ClusterIP      100.68.38.188    <none>                                                                    9093/TCP                     46m
stable-kube-prometheus-sta-operator       ClusterIP      100.67.54.161    <none>                                                                    443/TCP                      46m
stable-kube-prometheus-sta-prometheus     LoadBalancer   100.67.172.242   a9042a504d25f4122b6aa52ed5e53b57-356305290.ap-south-1.elb.amazonaws.com   9090:31942/TCP               46m
stable-kube-state-metrics                 ClusterIP      100.69.46.211    <none>                                                                    8080/TCP                     46m
stable-prometheus-node-exporter ClusterIP 100.66.152.213 <none> 9100/TCP 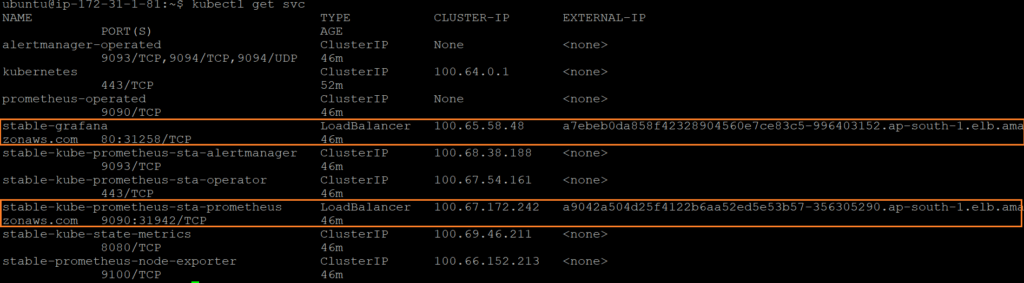
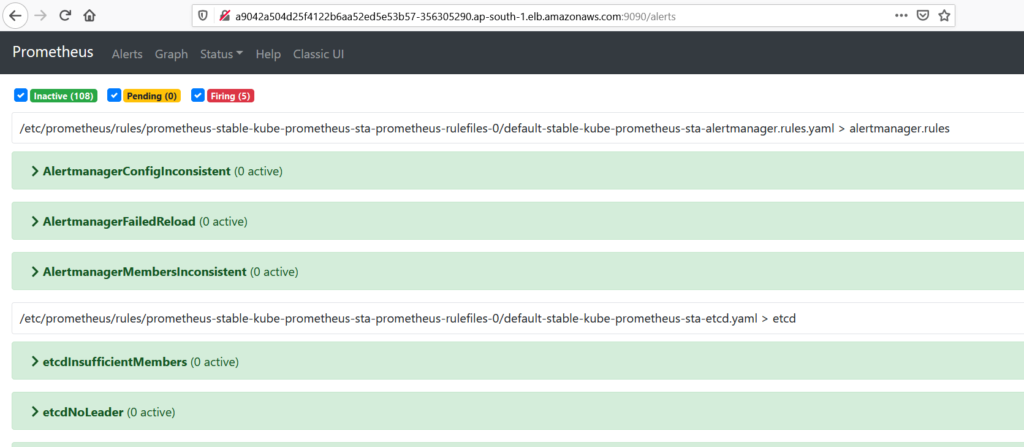
#5: Access Prometheus and Grafana WEB Interface
To access Prometheus web interface copy Loadbalancer URL and port number 9090
http://a9042a504d25f4122b6aa52ed5e53b57-356305290.ap-south-1.elb.amazonaws.com:9090Output:
To access Grafana web interface copy Loadbalancer URL and port number 80
http://a7ebeb0da858f42328904560e7ce83c5-996403152.ap-south-1.elb.amazonaws.com
you will redirected to Grafana dashboard, it will prompt for username and Password, below are default credentials for Grafana
UserName: admin
Password: prom-operator
after successfully logged in Grafana dashboard, click on Manage to see Kubernetes cluster

once clicked on manage, you will see Kubernetes cluster

Conclusion:
We have covered How to Install Prometheus and Grafana on Kubernetes using Helm 3
Related Articles:
Kubernetes cluster Monitoring with Prometheus and Grafana
How to Install Prometheus on Ubuntu 20.04
Reference:
nice, but the configuration on aws console didnt exist ! :'(
Thanks for putting this together. It really simplifies the installation of Prometheus and Grafana. Great job!
Thanks, We are facing some problem in grafana. For some reason if dcgm-exporter service restarts automatically, monitoring data is automatically deleted.
How to save monitoring data outside deployment.