In this article, We are going to demonstrate Kubernetes cluster Monitoring with Prometheus and Grafana.

Kubernetes becomes a complex environment with so many moving resources, monitoring even a small Kubernetes cluster is challenging. Monitoring Kubernetes cluster requires an in depth understanding of the application architecture and functionality in order to design and manage an effective solution.
In this tutorial I will demonstrate the entire process of implementing monitoring on Kubernetes cluster with the tools like Prometheus, alert manager and Grafana.
Before jumping onto the practical things let us first understand about all these tools in brief.
Table of Contents
What is Prometheus ?
Prometheus is an open-source systems monitoring and alerting toolkit originally built at SoundCloud. It records real-time metrics in a time series database built using a HTTP pull model, with flexible queries and real-time alerting. It can absorb huge amount of data every second.
What is Alert Manager ?
The Alertmanager handles alerts sent by client applications such as the Prometheus server. It takes care of deduplicating, grouping, and routing them to the correct receiver integration such as email, PagerDuty, or MS teams etc. It also takes care of silencing and inhibition of alerts.
What is Grafana ?
Grafana is open source visualization and analytics software. It allows you to query, visualize, alert on, and explore your metrics no matter where they are stored. It provides charts, graphs, and alerts for the web when connected to supported data sources such as Prometheus, graphite etc.
NOTE: This Article assumes that you have a Kubernetes cluster up and running and kubectl CLI on your local system.
Our Kubernetes Cluster Environment:
We have one master (control plane node) and two worker nodes.
| Node | IP | HostName | Specs | Kubectl Version | Docker Version |
| Master | 172.42.42.200 | kmaster-ft.example.com | 4 GB RAM, 2 vCPU’s, 64 GB HDD | v1.18.8 | 19.03.6 |
| Worker 1 | 172.42.42.201 | kworker-ft1.example.com | 2 GB RAM, 2 vCPU’s, 64 GB HDD | v1.18.8 | 19.03.6 |
| Worker 2 | 172.42.42.202 | kworker-ft2.example.com | 2 GB RAM, 2 vCPU’s, 64 GB HDD | v1.18.8 | 19.03.6 |
Methods to deploy monitoring environment on Kubernetes:
There are two methods we can deploy monitoring environment on Kubernetes cluster.
The first method is by using the individual yaml configuration files for each resource such as Deployment, stateful sets, services, service accounts, cluster roles etc.
The second and the recommended method is to use Helm package manager. Helm is a package manager for Kubernetes equivalent of yum or apt for Red hat and Ubuntu. Helm deploys charts, which you can think of as a packaged application. It is a collection of all your versioned, pre-configured application resources which can be deployed as one unit.
Helm Installation on Linux
root@kmaster-ft:~/monitoring# wget https://get.helm.sh/helm-v3.3.4-linux-amd64.tar.gz
root@kmaster-ft:/opt# tar -xvzf helm-v3.3.4-linux-amd64.tar.gz
root@kmaster-ft:/opt# mv linux-amd64/helm /usr/local/bin/
verify the helm installation and version:
root@kmaster-ft:/opt# helm version
version.BuildInfo{Version:"v3.3.4", GitCommit:"a61ce5633af99708171414353ed49547cf05013d", GitTreeState:"clean", GoVersion:"go1.14.9"}
Kubernetes cluster Monitoring with Prometheus and Grafana
In Prometheus the time series collection happens via a pull model over HTTP. It sends http requests to target (scrapes) and the response (metrics data) it gets in response gets stored in storage (The time series database “TSDB”).
Configure Persistent storage
A Persistent storage is needed for Prometheus. (It is any storage device that retains data after power to the device is turned off). Persistent storage can help protect critical data from eviction, and reduce the chance of data loss.
In our tutorial we will install NFS Server on Master Node and configure [/home/nfsshare] directory as NFS share as external persistent storage, and also configure dynamic volume provisioning with NFS plugin.
Kubernetes : Dynamic Volume Provisioning (NFS)
To use Dynamic Volume Provisioning feature when using Persistent Storage, it’s possible to create PV (Persistent Volume) dynamically without creating PV manually by Cluster Administrator when created PVC (Persistent Volume Claim) by users.
First configure NFS Server on Master Node and then configure dynamic volume provisioning with NFS provisioner.
NFS : Configure NFS Server on Kubernetes Master
Configure NFS Server to share directories on your Network.
root@kmaster-ft:~/monitoring# apt -y install nfs-kernel-server
Change the domain name in idmapd file:
root@kmaster-ft:~/monitoring# vim /etc/idmapd.conf
# line 6: uncomment and change to your domain name
Domain = example.com
Create an NFS Export Directory:
root@kmaster-ft:~/monitoring# mkdir /home/nfsshare
Change the ownership and permissions of the NFS export directory:
root@kmaster-ft:~/monitoring# chown -R nobody:nogroup /home/nfsshare
root@kmaster-ft:~/monitoring# chmod 777 /home/nfsshare
Restart the NFS service:
root@kmaster-ft:~/monitoring# systemctl restart nfs-server
NFS : Configure NFS Client
Configure NFS Client to mount NFS Share on NFS Client:
root@kworker-ft1:~# apt -y install nfs-common
Update idmapd file:
root@kworker-ft1:~# vim /etc/idmapd.conf
# line 6: uncomment and change to your domain name
Domain = example.com
To mount dynamically when anyone access to NFS Share, Configure AutoFS.
root@kworker-ft1:~# apt -y install autofs
Update /etc/auto.master file:
root@kworker-ft1:~# vim /etc/auto.master
# add to the end
/-    /etc/auto.mount
Update auto.mount file:
root@kworker-ft1:~# cat /etc/auto.mount
/mnt   -fstype=nfs,rw  172.42.42.200:/home/nfsshare
Restart the service:
root@kworker-ft1:~# systemctl restart autofs
Now we have our NFS server setup ready. Lets start configuring NFS Client Provisioner on master node:
root@kmaster-ft:~/monitoring# helm install nfs-client -n kube-system --set nfs.server=172.42.42.200 --set nfs.path=/home/nfsshare stable/nfs-ient-provisioner
NAME: nfs-client
LAST DEPLOYED: Fri Oct 23 09:03:06 2020
NAMESPACE: kube-system
STATUS: deployed
REVISION: 1
TEST SUITE: None
Verify the pods running:
root@kmaster-ft:~/monitoring# kubectl get pods -n kube-system -w
NAME                                                 READY   STATUS    RESTARTS   AGE
calico-node-2vs9l                                    1/1     Running   0          31m
calico-node-c6l89                                    1/1     Running   0          31m
calico-node-z2v8q                                    1/1     Running   0          31m
etcd-kmaster-ft                                      1/1     Running   21         30m
kube-apiserver-kmaster-ft                            1/1     Running   11         30m
kube-controller-manager-kmaster-ft                   1/1     Running   15         30m
kube-proxy-g42ls                                     1/1     Running   0          30m
kube-proxy-hq5dk                                     1/1     Running   0          30m
kube-proxy-v7gk6                                     1/1     Running   0          30m
kube-scheduler-kmaster-ft                            1/1     Running   15         30m
nfs-client-nfs-client-provisioner-77699ff74f-r2fg9   1/1     Running   0          4m54s
Till now we have made our Kubernetes server to have NFS configured as persistent storage for our monitoring resources.
Now lets start deploying the Prometheus.
Kubernetes : Deploy Prometheus
Like the jobs it monitors, Prometheus runs as a pod in your Kubernetes cluster.
root@kmaster-ft:~/monitoring# helm inspect values stable/prometheus > prometheus.yaml
Change the storageClass Name in the output file from previous command.
root@kmaster-ft:~/monitoring# vim prometheus.yaml
alertmanager:
.....
.....
    line 213: uncomment and specify [storageClass] to use
    storageClass: "nfs-client"
.....
.....

server:
.....
.....
    line 803: uncomment and specify [storageClass] to use
    storageClass: "nfs-client"
.....
.....
pushgateway:
.....
.....
    line 1134: uncomment and specify [storageClass] to use
    storageClass: "nfs-client"
Create a separate namespace to deploy our monitoring resources on:
root@kmaster-ft:~/monitoring# kubectl create namespace monitoring
namespace/monitoring created
Deploy Prometheus helm chart:
root@kmaster-ft:~/monitoring# helm install prometheus --namespace monitoring -f prometheus.yaml stable/prometheus
WARNING: This chart is deprecated
NAME: prometheus
LAST DEPLOYED: Fri Oct 23 08:44:49 2020
NAMESPACE: monitoring
STATUS: deployed
REVISION: 1
TEST SUITE: None

Get the Prometheus server URL by running these commands in the same shell:
  export POD_NAME=$(kubectl get pods --namespace monitoring -l "app=prometheus,component=server" -o jsonpath="{.items[0].metadata.name}")
  kubectl --namespace monitoring port-forward $POD_NAME 9090


The Prometheus alertmanager can be accessed via port 80 on the following DNS name from within your cluster:
prometheus-alertmanager.monitoring.svc.cluster.local


Get the Alertmanager URL by running these commands in the same shell:
  export POD_NAME=$(kubectl get pods --namespace monitoring -l "app=prometheus,component=alertmanager" -o jsonpath="{.items[0].metadata.name}")
  kubectl --namespace monitoring port-forward $POD_NAME 9093
#################################################################################
######   WARNING: Pod Security Policy has been moved to a global property.  #####
######            use .Values.podSecurityPolicy.enabled with pod-based      #####
######            annotations                                               #####
######            (e.g. .Values.nodeExporter.podSecurityPolicy.annotations) #####
#################################################################################


The Prometheus PushGateway can be accessed via port 9091 on the following DNS name from within your cluster:
prometheus-pushgateway.monitoring.svc.cluster.local


Get the PushGateway URL by running these commands in the same shell:
  export POD_NAME=$(kubectl get pods --namespace monitoring -l "app=prometheus,component=pushgateway" -o jsonpath="{.items[0].metadata.name}")
  kubectl --namespace monitoring port-forward $POD_NAME 9091

For more information on running Prometheus, visit:
https://prometheus.io/
Verify the pods running:
root@kmaster-ft:~/monitoring# kubectl get pods -n monitoring -o wide
NAME                                            READY   STATUS    RESTARTS   AGE     IP               NODE          NOMINATED NODE   READINESS GATES
create-vs-apply-demo                            1/1     Running   0          3h59m   172.16.213.233   kworker-ft2   <none>           <none>
create-vs-apply-demo-2                          1/1     Running   0          3h46m   172.16.213.37    kworker-ft1   <none>           <none>
prometheus-alertmanager-6b64586d49-t7w5v        2/2     Running   0          4h38m   172.16.213.28    kworker-ft1   <none>           <none>
prometheus-kube-state-metrics-c65b87574-m8sh8   1/1     Running   0          4h38m   172.16.213.247   kworker-ft2   <none>           <none>
prometheus-node-exporter-8lgx9                  1/1     Running   0          4h38m   172.42.42.202    kworker-ft2   <none>           <none>
prometheus-node-exporter-w8b4f                  1/1     Running   0          4h38m   172.42.42.201    kworker-ft1   <none>           <none>
prometheus-pushgateway-7d5f5746c7-pc2nq         1/1     Running   0          4h38m   172.16.213.29    kworker-ft1   <none>           <none>
prometheus-server-f8d46859b-nxbmt               2/2     Running   0          4h38m   172.16.213.252   kworker-ft2   <none>           <none>
Deploy Grafana:
root@kmaster-ft:~/monitoring# helm inspect values stable/grafana > grafana.yaml
Change the storageClassName in the output file from previous command.
root@kmaster-ft:~/monitoring# vim grafana.yaml
line 215: enable [persistence]
line 216: uncomment and change to your [storageClass]
persistence:
  type: pvc
  enabled: true
  storageClassName: nfs-client
Deploy the Grafana helm chart now:
root@kmaster-ft:~/monitoring# helm install grafana --namespace monitoring -f grafana.yaml stable/grafana
WARNING: This chart is deprecated
NAME: grafana
LAST DEPLOYED: Fri Oct 23 09:25:22 2020
NAMESPACE: monitoring
STATUS: deployed
REVISION: 1

1. Get your 'admin' user password by running:

   kubectl get secret --namespace monitoring grafana -o jsonpath="{.data.admin-password}" | base64 --decode ; echo

2. The Grafana server can be accessed via port 80 on the following DNS name from within your cluster:

   grafana.monitoring.svc.cluster.local

   Get the Grafana URL to visit by running these commands in the same shell:

     export POD_NAME=$(kubectl get pods --namespace monitoring -l "app.kubernetes.io/name=grafana,app.kubernetes.io/instance=grafana" -o jsonpath="{.items[0].metadata.name}")
     kubectl --namespace monitoring port-forward $POD_NAME 3000

3. Login with the password from step 1 and the username: admin
Verify the pods running:
root@kmaster-ft:~/monitoring# kubectl get pods -n monitoring -o wide
NAME                                            READY   STATUS    RESTARTS   AGE     IP               NODE          NOMINATED NODE   READINESS GATES
create-vs-apply-demo                            1/1     Running   0          3h59m   172.16.213.233   kworker-ft2   <none>           <none>
create-vs-apply-demo-2                          1/1     Running   0          3h46m   172.16.213.37    kworker-ft1   <none>           <none>
grafana-56b4b9fffc-8tbm2                        1/1     Running   0          3h57m   172.16.213.33    kworker-ft1   <none>           <none>
prometheus-alertmanager-6b64586d49-t7w5v        2/2     Running   0          4h38m   172.16.213.28    kworker-ft1   <none>           <none>
prometheus-kube-state-metrics-c65b87574-m8sh8   1/1     Running   0          4h38m   172.16.213.247   kworker-ft2   <none>           <none>
prometheus-node-exporter-8lgx9                  1/1     Running   0          4h38m   172.42.42.202    kworker-ft2   <none>           <none>
prometheus-node-exporter-w8b4f                  1/1     Running   0          4h38m   172.42.42.201    kworker-ft1   <none>           <none>
prometheus-pushgateway-7d5f5746c7-pc2nq         1/1     Running   0          4h38m   172.16.213.29    kworker-ft1   <none>           <none>
prometheus-server-f8d46859b-nxbmt               2/2     Running   0          4h38m   172.16.213.252   kworker-ft2   <none>           <none>
Verify the services running:
root@kmaster-ft:~/monitoring# kubectl get services --namespace monitoring
NAME                            TYPE        CLUSTER-IP       EXTERNAL-IP   PORT(S)          AGE
grafana                         ClusterIP    10.108.66.249    <none>        80:/TCP          4h8m
prometheus-alertmanager         ClusterIP    10.111.89.244    <none>        80:/TCP          4h48m
prometheus-kube-state-metrics   ClusterIP    10.99.192.201    <none>        8080/TCP         4h48m
prometheus-node-exporter        ClusterIP    None             <none>        9100/TCP         4h48m
prometheus-pushgateway          ClusterIP    10.107.12.231    <none>        9091/TCP         4h48m
prometheus-server               ClusterIP    10.107.106.125   <none>        80/TCP           4h48m
prometheus-service
Till now we are done with our deployments of Prometheus, Alert Manager and Grafana.
Now let us start accessing these resources. We can access them on the local nodes and if you want your Monitoring server and Grafana server to be accessible outside of your cluster as well then you need to expose the respective services.
If you want to access Prometheus Web UI from a host within the cluster, paste the URL below on your web browser. http://prometheus-server.monitoring.svc.cluster.local
Set port forwarding to access Prometheus, alertmanager and Grafana from a client in your local network:
If you set port-fowarding, access the URL below on a client computer in your local network.
http://(Master Node Hostname or IP address):(port)/
root@kmaster-ft:~/monitoring# kubectl port-forward -n monitoring service/prometheus-server --address 0.0.0.0 9090:80
root@kmaster-ft:~/monitoring# kubectl port-forward -n monitoring service/grafana --address 0.0.0.0 3000:80
root@kmaster-ft:~/monitoring# kubectl port-forward -n monitoring service/prometheus-alertmanager --address 0.0.0.0 80:80
To access it from outside of your network which actually happens in real world we need to convert the ClusterIP service type to NodePort.
After that your monitoring resources will be accessible from any outside system by using the IP of any of your cluster nodes and the NodePort assigned.
Note:
A node port exposes the service on a static port on the node IP address. NodePorts are in the 30000-32767 range by default, which means a NodePort is unlikely to match a service’s intended port (for example, 8080 may be exposed as 31020).
Create services for Prometheus , Alert Manager and Grafana
Create following service yaml files.
Prometheus service –
root@kmaster-ft:~/monitoring# cat service.yml
apiVersion: v1
kind: Service
metadata:
  name: prometheus-service
  namespace: monitoring
  annotations:
      prometheus.io/scrape: 'true'
      prometheus.io/port:   '9090'
spec:
  selector:
    app: prometheus
  type: NodePort
  ports:
    - port: 8080
      targetPort: 9090
      nodePort: 30000
Grafana Service –
root@kmaster-ft:~/monitoring# cat service-grafana.yml
apiVersion: v1
kind: Service
metadata:
  name: grafana
  namespace: monitoring
  annotations:
      prometheus.io/scrape: 'true'
      prometheus.io/port:   '3000'
spec:
  selector:
    name: grafana
  type: NodePort
  ports:
    - port: 80
      targetPort: 3000
      nodePort: 30002
Alertmanager Service –
root@kmaster-ft:~/monitoring# cat service-alertmanager.yml
apiVersion: v1
kind: Service
metadata:
  name: prometheus-alertmanager
  namespace: monitoring
  annotations:
      prometheus.io/scrape: 'true'
      prometheus.io/port:   '3000'
spec:
  selector:
    app: prometheus
  type: NodePort
  ports:
    - port: 80
      targetPort: 9093
      nodePort: 30001
Now we have yaml config files created for all the three components. Apply them to create the respective services.
root@kmaster-ft:~/monitoring# kubectl apply -f service.yml
root@kmaster-ft:~/monitoring# kubectl apply -f service-grafana.yml
root@kmaster-ft:~/monitoring# kubectl apply -f service-alertmanager.yml
list out the running services:
root@kmaster-ft:~/monitoring# kubectl get services --namespace monitoring
NAME                            TYPE        CLUSTER-IP       EXTERNAL-IP   PORT(S)          AGE
grafana                         NodePort    10.108.66.249    <none>        80:30002/TCP     4h21m
prometheus-alertmanager         NodePort    10.111.89.244    <none>        80:30001/TCP     5h1m
prometheus-kube-state-metrics   ClusterIP   10.99.192.201    <none>        8080/TCP         5h1m
prometheus-node-exporter        ClusterIP   None             <none>        9100/TCP         5h1m
prometheus-pushgateway          ClusterIP   10.107.12.231    <none>        9091/TCP         5h1m
prometheus-server               ClusterIP   10.107.106.125   <none>        80/TCP           5h1m
prometheus-service              NodePort    10.102.141.191   <none>        8080:30000/TCP   4h30m
Access the UI from browser:
Prometheus Server –
To access Prometheus UI in your browser at port 30000 –

Sample query graph on Prometheus UI :
As soon as it starts, the Prometheus pod will be accumulating data. After a few minutes, you’ll have some records that you can query using Prometheus’s powerful query language.

AlertManager UI –
To access AlertManager UI in your browser at port 30001
http://172.42.42.200:30001/#/alerts

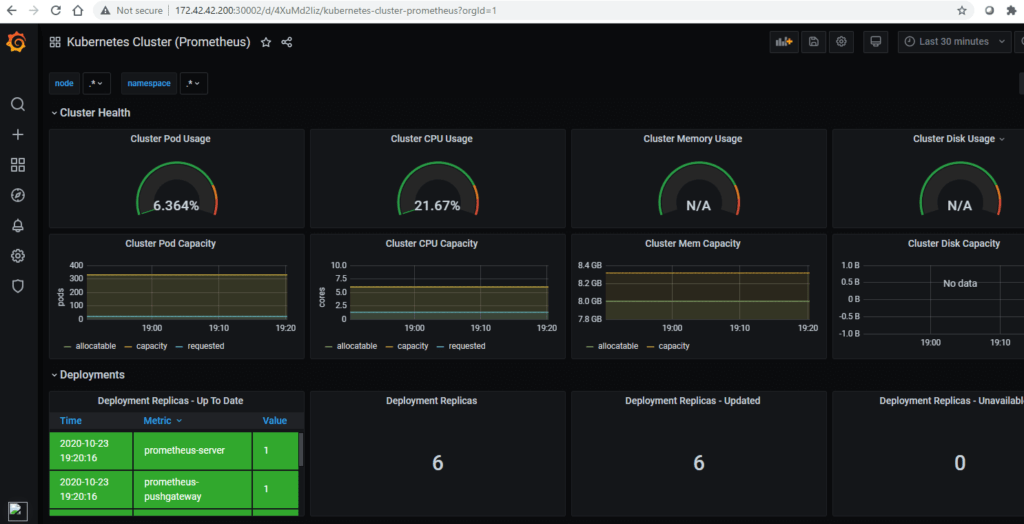
Grafana UI –
To access Grafana UI in your browser at port 30002
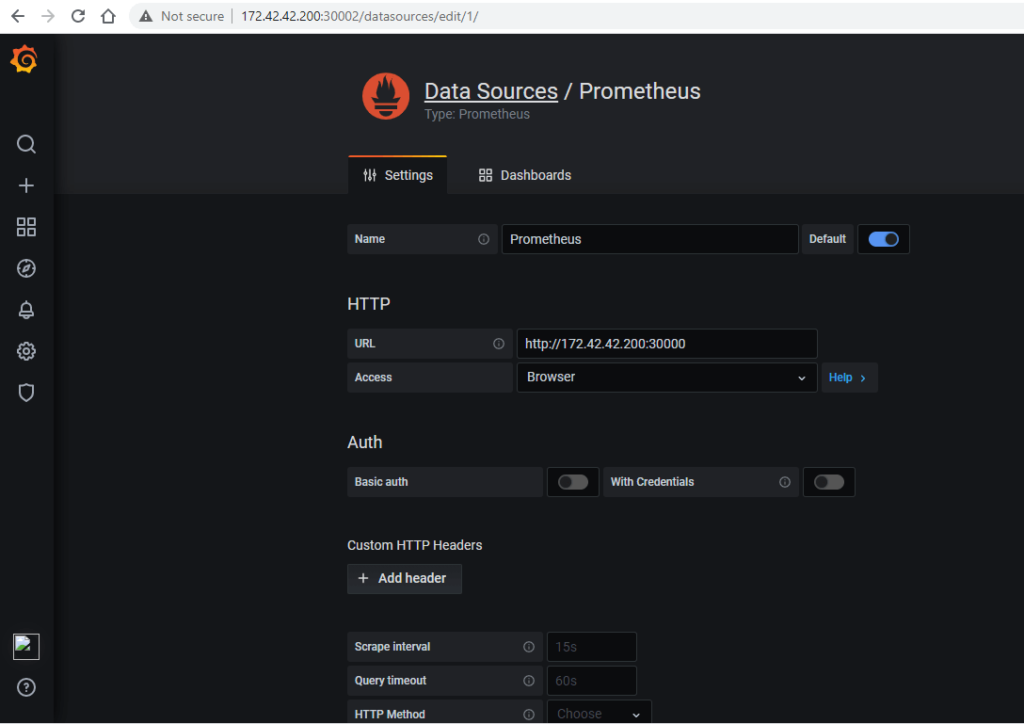
Adding data sources to Grafana:
Add a data source. Move your cursor to the cog on the side menu which will show you the configuration menu. Click Add data source and you will come to the settings page of your new data source. In the Name box, enter a name for this data source. In the Type, select the type of data source. Click Save & Test.
Adding Dashboard templates :
To import a dashboard click the + icon in the side menu, and then click Import. From here you can upload a dashboard JSON file, paste a Grafana.com dashboard URL or paste dashboard JSON text directly into the text area.
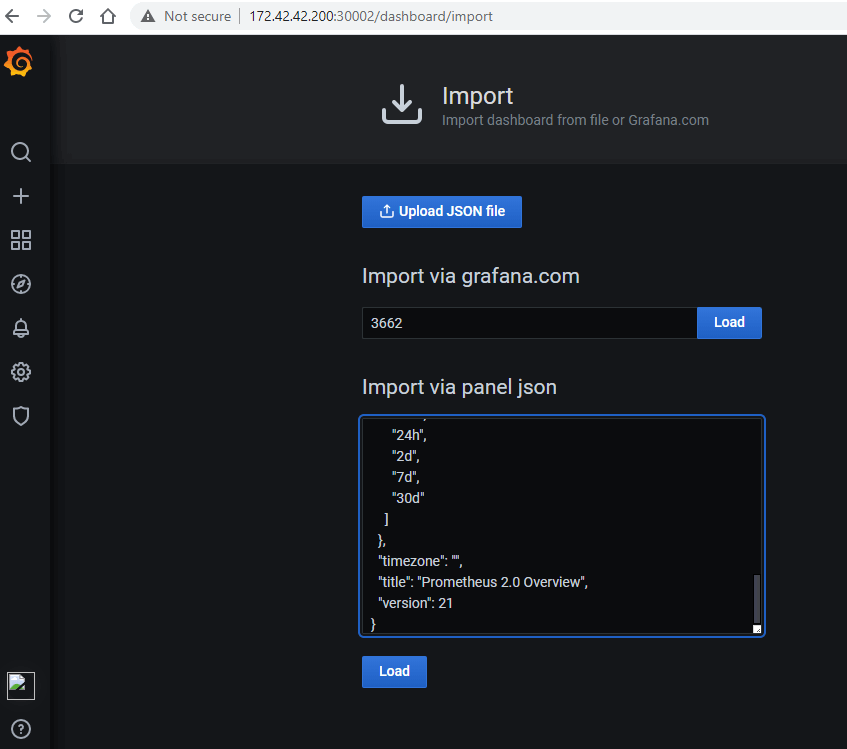
Here are few Grafana dashboard templates which can be used for kubernetes cluster and resource visualization
ID – 3662 JSON – https://grafana.com/api/dashboards/3662/revisions/2/download
ID – 747 https://grafana.com/grafana/dashboards/747 https://grafana.com/api/dashboards/747/revisions/2/download
You can find more dashboards here –
Conclusion:
Now that you have successfully installed Prometheus Monitoring on a Kubernetes cluster, you can track the overall health, performance, and behavior of your system. How Prometheus, alertmanager and Grafana works is out of scope for this tutorial. Will be covered in another tutorial.
I hope you like the demonstration.
Please let us know your feedback below in the comment section.
Related Articles:
Very nice guide, one caveat though: Using NFS as backing store for prometheus is not supported. It can lead to data corruption. More in https://prometheus.io/docs/prometheus/latest/storage/#operational-aspects
You are right here. Prometheus includes a local on-disk time series database, but can be integrated with remote storage systems such as NFS or any third party storage like NetApp. To maintain data across deployments and version upgrades, the data must be persisted to some volume. The article is just to show how to manually control the storage provisioning.