In this article we are going to cover How to Install Prometheus and Grafana on Ubuntu 22.04 LTS.
Table of Contents
What is Prometheus ?
- Prometheus is a open source Linux Server Monitoring tool mainly used for metrics monitoring, event monitoring, alert management, etc.
- Prometheus has changed the way of monitoring systems and that is why it has become the Top-Level project of Cloud Native Computing Foundation (CNCF).
- Prometheus uses a powerful query language i.e. “PromQL”.
- In Prometheus tabs are on and handles hundreds of services and microservices.
- Prometheus use multiple modes used for graphing and dashboarding support.
Prometheus Architecture
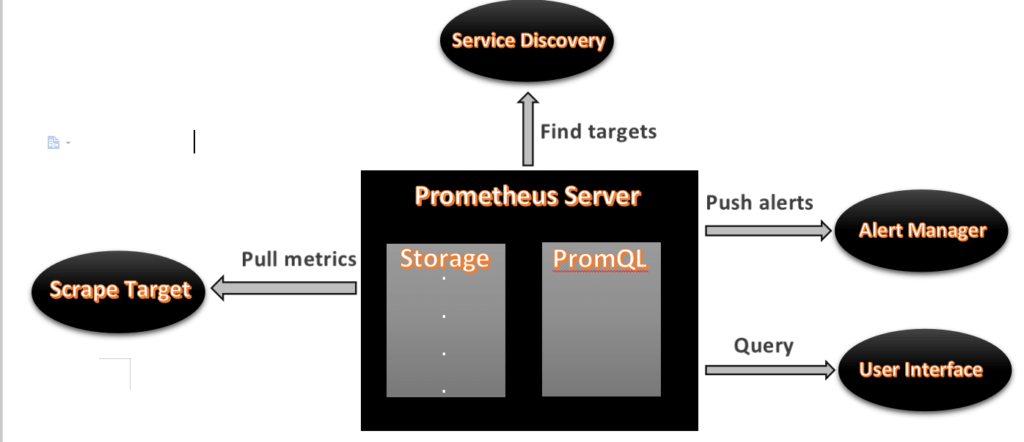
- As above we can see an architecture of Prometheus monitoring tool.
- We made a basic design to understand it easily for you people.
Now lets understand the Prometheus components one-by-one
Prometheus Components
1. Prometheus Server
- Prometheus server is a first component of Prometheus architecture.
- Prometheus server is a core of Prometheus architecture which is divided into several parts like Storage, PromQL, HTTP server, etc.
- In Prometheus server data is scraped from the target nodes and then stored int the database.
1.a. Storage
- Storage in Prometheus server has a local on disk storge.
- Prometheus has many interfaces that allow integrating with remote storage systems.
1.b. PromQL
- Prometheus uses its own query language i.e. PromQL which is very powerful querying language.
- PromQL allows the user to select and aggregate the data.
2. Service Discovery
- Next and very important component of Prometheus Server is the Service Discovery.
- With the help of Service discovery the services are identified which are need to scraped.
- To Pull metrics, identification of services and finding the targets are compulsory needed.
- Through Service discovery we monitor the entities and can also locate its targets.
3. Scrape Target
- Once the services are identified and the targets are ready then we can pull metrics from it and can scrape the target.
- We can export the data of end point using node exporters.
- Once the metrics or other data is pulled, Prometheus stores it in a local storage.
4. Alert Manager
- Alert Manager handles the alerts which may occurs during the session.
- Alert manager handles all the alerts which are sent by Prometheus server.
- Alert manager is one of the very useful component of Prometheus tool.
- If in case any big error or any issue occurs, alert manager manage those alerts and contact with human via E-mail, Text Messages, On-call, or any other chat application service.
5. User Interface
- User interface is also a important component as it builds a bridge between the user and the system.
- In Prometheus, user interface are note that much user friendly and can be used till graph queries.
- For good exclusive dashboards Prometheus works together with Grafana (visualization tool).
- Using Grafana over Prometheus to visualize properly we can use custom dashboards.
- Grafana dashboards displays via pie charts, line charts, tables, good data graphs of CPU usage, RAM utilization, network load, etc with indicators.
- Grafana supports and run with Prometheus by querying language i.e. PromQL.
- To fetch data from Prometheus and to display the results on Grafana dashboards PromQL is used.
What is Grafana ?
- Grafana is a free and open source visualization tool mostly used with Prometheus to which monitor metrics.
- Grafana provides various dashboards, charts, graphs, alerts for the particular data source.
- Grafana allows us to query, visualize, explore metrics and set alerts for the data source which can be a system, server, nodes, cluster, etc.
- We can also create our own dynamic dashboard for visualization and monitoring.
- We can save the dashboard and can even share with our team members which is one of the main advantage of Grafana.
What is Node Exporter ?
- Node exporter is one of the Prometheus exporters which is used to expose servers or system OS metrics.
- With the help of Node exporter we can expose various resources of the system like RAM, CPU utilization, Memory Utilization, disk space.
- Node exporter runs as a system service which gathers the metrics of your system and that gathered metrics is displayed with the help of Grafana visualization tool.
Prerequisites
- Ubuntu with 22.04 Version
- Root user account with sudo privilege.
- Prometheus system user and group.
- Sufficient storage on your system and good internet connectivity.
- Ports Required- 9090 (Prometheus), 3000 (Grafana), 9100 (Node Exporter)
We will update the system repository index by using the following command.
sudo apt update -y
Step #1:Creating Prometheus System Users and Directory
Create a system user for Prometheus using below commnds:
sudo useradd --no-create-home --shell /bin/false prometheus
Create the directories in which we will be storing our configuration files and libraries:
sudo mkdir /etc/prometheus
sudo mkdir /var/lib/prometheus
Set the ownership of the /var/lib/prometheus directory with below command:
sudo chown prometheus:prometheus /var/lib/prometheus
Step #2:Download Prometheus Binary File
Now we will download the latest version of Prometheus. We can copy the download link as per our Operating System from Prometheus download page
Using below command we can download Prometheus, here we are downloading Prometheus 2.46 version, you use above link to download specific version.
You need to inside /tmp :
cd /tmp/
Download the Prometheus setup using wget
wget https://github.com/prometheus/prometheus/releases/download/v2.46.0/prometheus-2.46.0.linux-amd64.tar.gz
Extract the files using tar :
tar -xvf prometheus-2.46.0.linux-amd64.tar.gz
Move the configuration file and set the owner to the prometheus user:
cd prometheus-2.46.0.linux-amd64
sudo mv console* /etc/prometheus
sudo mv prometheus.yml /etc/prometheus
sudo chown -R prometheus:prometheus /etc/prometheus
Move the binaries and set the owner:
sudo mv prometheus /usr/local/bin/
sudo chown prometheus:prometheus /usr/local/bin/prometheus
Step #3:Prometheus configuration file
We have already copied /opt/prometheus-2.26.0.linux-amd64/prometheus.yml file /etc/prometheus directory, verify if it present and should look like below and modify it as per your requirement.
sudo nano /etc/prometheus/prometheus.yml
Step #4:Creating Prometheus Systemd file
Create the service file using below command:
sudo nano /etc/systemd/system/prometheus.service
[Unit]
Description=Prometheus
Wants=network-online.target
After=network-online.target

[Service]
User=prometheus
Group=prometheus
Type=simple
ExecStart=/usr/local/bin/prometheus \
    --config.file /etc/prometheus/prometheus.yml \
    --storage.tsdb.path /var/lib/prometheus/ \
    --web.console.templates=/etc/prometheus/consoles \
    --web.console.libraries=/etc/prometheus/console_libraries

[Install]
WantedBy=multi-user.target
Reload systemd:
sudo systemctl daemon-reload
Start, Enable, Status Prometheus service:
sudo systemctl start prometheus
sudo systemctl enable prometheus
sudo systemctl status prometheus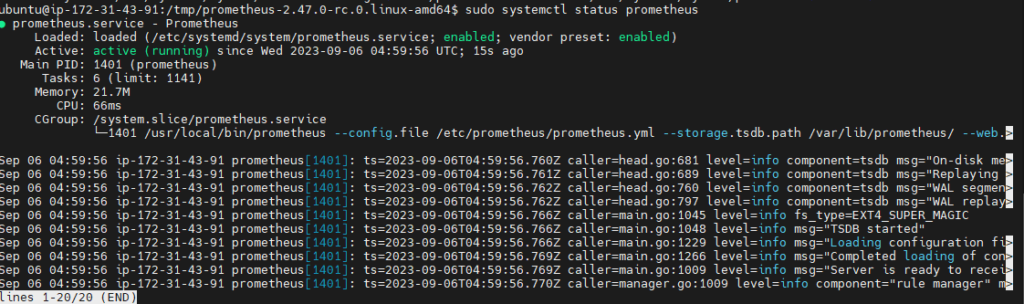
Step #5:Accessing Prometheus in Browser
Now as Prometheus installation and configuration is set up and it is ready to use we can access its services via web interface.Also check weather port 9090 is UP in firewall.
Use below command to enable prometheus service in firewall
sudo ufw allow 9090/tcp
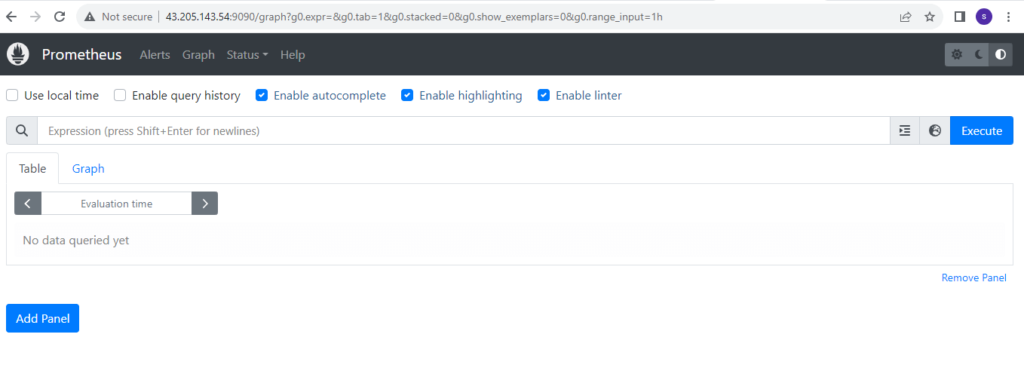
Now Prometheus service is ready to run and we can access it from any web browser.
http://server-IP-or-Hostname:9090.
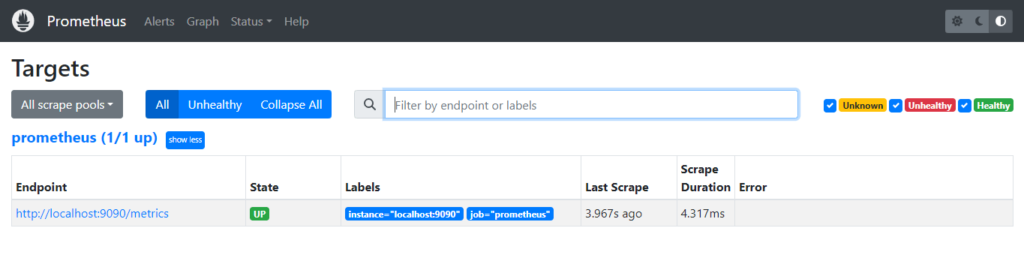
As we can see the Prometheus dashboards, we can also check the target.As we can observe Current state is UP and we can also see the last scrape.
Step #6:Download Node Exporter
Go to the official release page of Prometheus Node Exporter and copy the link of the latest version of the Node Exporter package according to your OS type.
cd /tmp
Now lets run the copied URL with wget command
wget https://github.com/prometheus/node_exporter/releases/download/v1.6.1/node_exporter-1.6.1.linux-amd64.tar.gz
Unzip the downloaded the file using below command
sudo tar xvfz node_exporter-*.*-amd64.tar.gz
Move the binary file of node exporter to /usr/local/bin location
sudo mv node_exporter-*.*-amd64/node_exporter /usr/local/bin/
Create a node_exporter user to run the node exporter service
sudo useradd -rs /bin/false node_exporter
Step #7:Creating Node Exporter Systemd service
Create a node_exporter service file in the /etc/systemd/system directory
sudo nano /etc/systemd/system/node_exporter.service
[Unit]
Description=Node Exporter
After=network.target
[Service]
User=node_exporter
Group=node_exporter
Type=simple
ExecStart=/usr/local/bin/node_exporter
[Install]
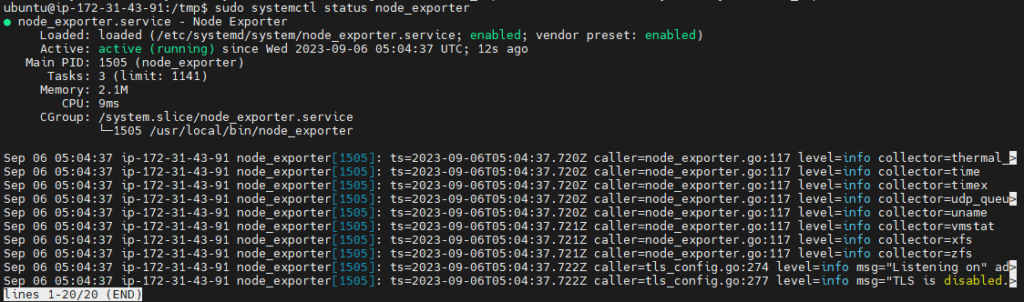
WantedBy=multi-user.targetNow lets start and enable the node_exporter service using below commands
sudo systemctl daemon-reload
sudo systemctl start node_exporter
sudo systemctl enable node_exporter
sudo systemctl status node_exporter
Step #8:Configure the Node Exporter as a Prometheus target
Now to scrape the node_exporter lets instruct the Prometheus by making a minor change in prometheus.yml file
So go to etc/prometheus and open prometheus.yml
sudo nano /etc/prometheus/prometheus.yml
- job_name: 'Node_Exporter'

    scrape_interval: 5s

    static_configs:

      - targets: ['<Server_IP_of_Node_Exporter_Machine>:9100']
Now restart the Prometheus Service
sudo systemctl restart prometheus
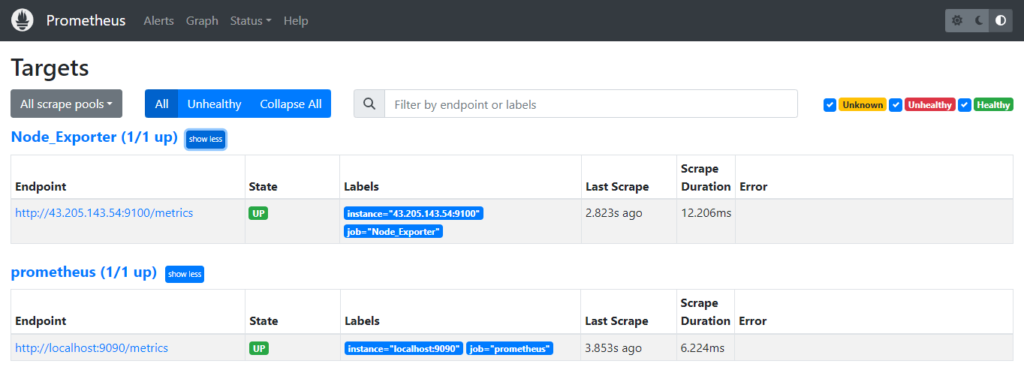
Hit the URL in your web browser to check weather our target is successfully scraped by Prometheus or not
Step #9:Install Grafana on Ubuntu 22.04 LTS
Now lets Install Grafana for wonderful dashboards and data visualization for monitoring systems, servers, services, etc
We can install grafana on Ubuntu either by downloading .deb package from Grafana Download page or using APT which is more easier.
Add the Grafana GPG key in Ubuntu using wget
wget -q -O - https://packages.grafana.com/gpg.key | sudo apt-key add -
Next, add the Grafana repository to your APT sources:
sudo add-apt-repository "deb https://packages.grafana.com/oss/deb stable main"
Refresh your APT cache to update your package lists:
sudo apt update
You can now proceed with the installation:
sudo apt install grafana
Once Grafana is installed, use systemctl to start the Grafana server:
sudo systemctl start grafana-server
Next, verify that Grafana is running by checking the service’s status:
sudo systemctl status grafana-server
sudo systemctl enable grafana-server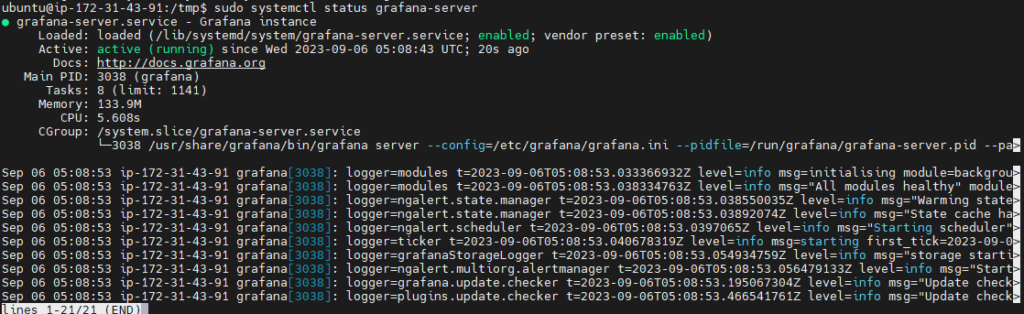
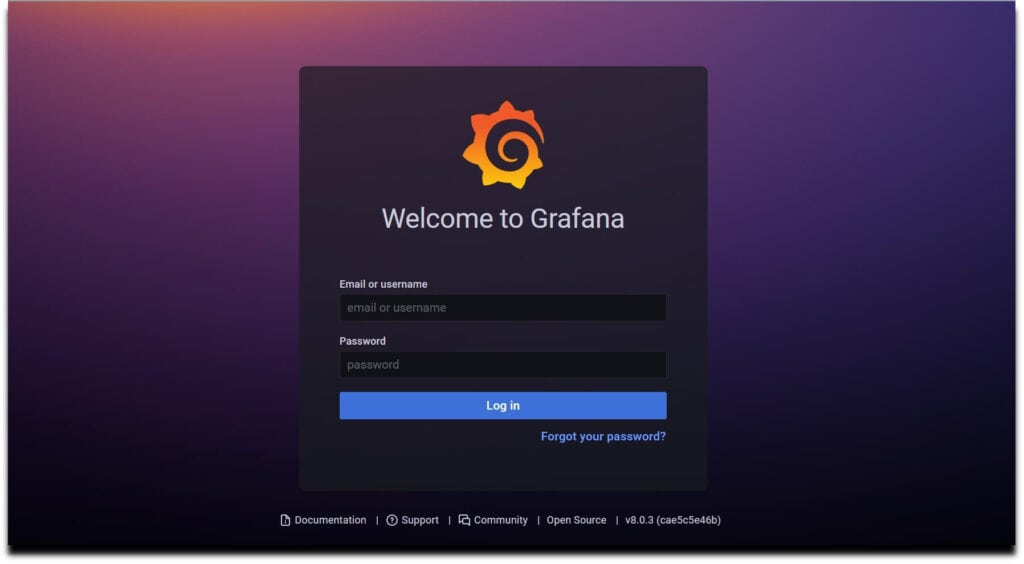
o access Grafana Dashboard open your favorite browser, type server IP or Name followed by grafana default port 3000.
http://your_ip:3000
Here you can see Login page of Grafana now you will have to login with below Grafana default UserName and Password.
Username – admin
Password – admin
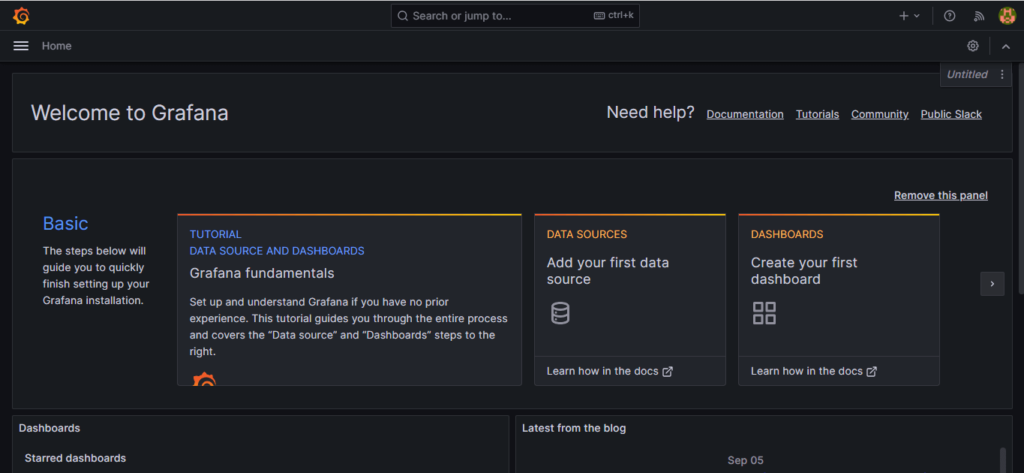
Now here you can see Home Dashboard page of Grafana
Step #10:Configure Prometheus as Grafana DataSource
Configure Prometheus as Grafana DataSource
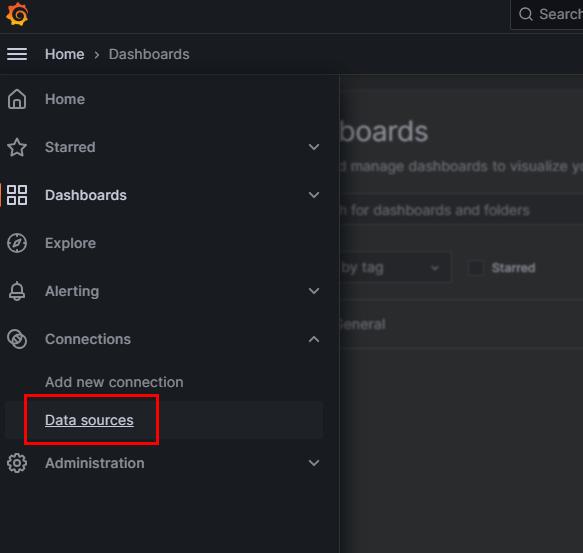
Now lets click on Add Data sources and select Prometheus
Now configure Prometheus data source by providing Prometheus URL
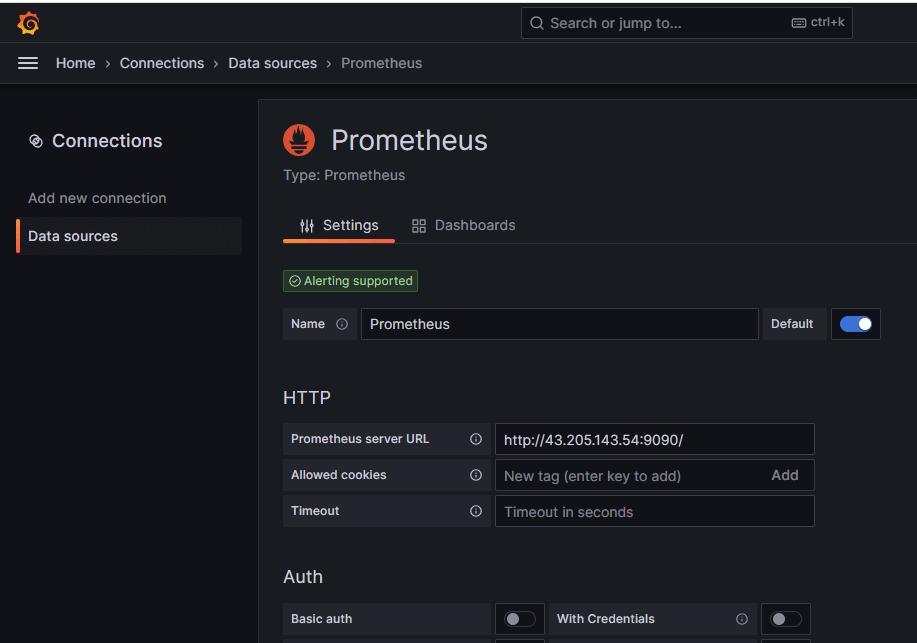
As per your requirement you can do other changes or you can also keep remaining configuration as default.
Now click on Save & test so it will prompt a message Data Source is working.
Step #11:Creating Grafana Dashboard to Monitor Linux Server
Now lets build a dashboard in Grafana so then it will able to reflect the metrics of the Linux system.
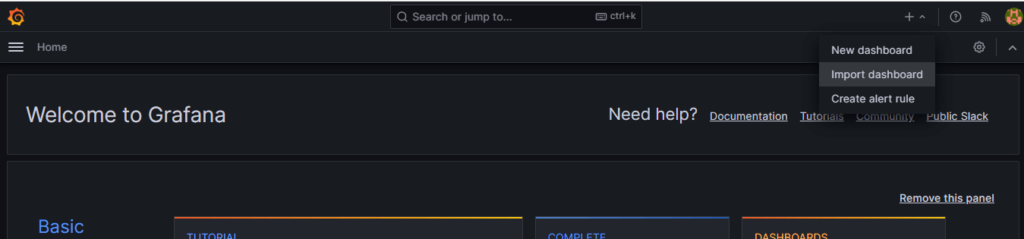
So we will use 14513 to import Grafana.com, Lets come to Grafana Home page and you can see a “+” icon. Click on that and select “Import”
Now provide the Grafana.com Dashboard ID which is 14513 and click on Load
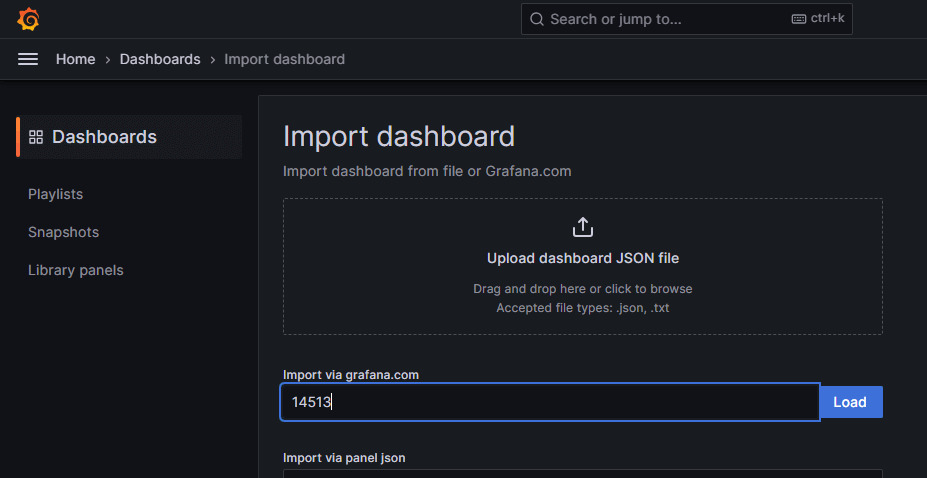
Now provide the name and select the Prometheus Datasource and click on Import.
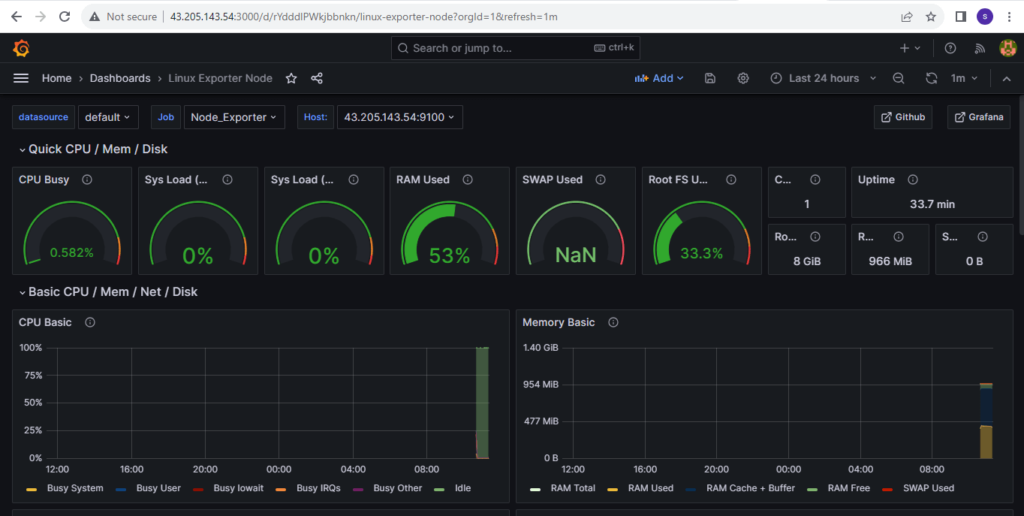
There you are done with the setup. Now your Dashboard is running up!.
Conclusion:
We have covered How to Install Prometheus on Ubuntu 22.04 LTS, Monitoring Linux server with Prometheus and Grafana with Node Exporter
Related Articles:
Thank’s, veray interesting article!
This is very useful. Thank you so much for creating this document.
Hi Shweta very nice work and i will get all the info abt how to install monitoring tools…great work
thank alot its very helpfull for me
Now, that’s a quality content.
Thank you brother. 🙂
Thanks
Thanks. Thats nice