In this article we will learn How to Monitor GitLab Pipelines Using Prometheus and Grafana. Monitoring GitLab pipelines is an essential step in ensuring your development and deployment workflows run smoothly. By tracking Gitlab pipeline performance and health, you can identify issues like slow builds or failed jobs early, saving time and improving efficiency.
Prometheus and Grafana are powerful tools for this purpose. Prometheus collects and stores metrics data, while Grafana visualizes it in a user-friendly way. In this guide, we will set up Prometheus and Grafana from scratch to monitor your GitLab pipelines.
Table of Contents
Prerequisites
- AWS Account with Ubuntu 24.04 LTS EC2 Instance.
- Python, pip and Docker Installed.
- Basic knowledge of Gitlab.
Step #1:Setting Up the Ubuntu Instance
First Update the package list.
sudo apt update
Install Docker and pip if it’s not already installed.
sudo apt install -y docker.io python3-pip
check it version to confirm the installation.
docker --version
pip3 --version
Install Docker-Compose to manage multiple containers.
sudo curl -L "https://github.com/docker/compose/releases/latest/download/docker-compose-$(uname -s)-$(uname -m)" -o /usr/local/bin/docker-compose
Change its permissions.
sudo chmod +x /usr/local/bin/docker-compose
check it version to confirm the installation.
docker-compose --version
Install the Virtual environment.
sudo apt install python3.12-venv
Create a new virtual environment named venv.
python3 -m venv venv
Activate the virtual environment.
source venv/bin/activate
Step #2:Create Project Structure and Files
Create a folder for your project and navigate into it.
mkdir Gitlab-monitoring
cd Gitlab-monitoring
Inside this folder, create subfolder for Prometheus and navigate to it.
mkdir Prometheus
cd Prometheus
create a prometheus configuration file
nano prometheus.yml
add the following code into it.
global:
  scrape_interval: 15s
  evaluation_interval: 15s

scrape_configs:
  - job_name: monitoring

    static_configs:
      - targets: ['<EC2-Public-IP>:8080']

  - job_name: monitoring_manual

    static_configs:
      - targets: ['<EC2-Public-IP>:8500']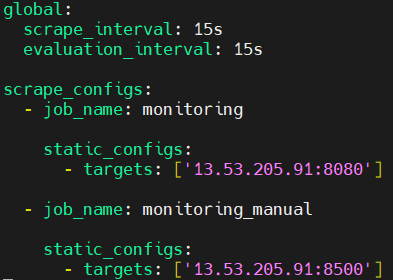
Back to project directory.
cd ..
Create Dockerfile.
nano Dockerfile
add the following code into it.
# set base image (host OS)
FROM python:3.12

WORKDIR /code

# copy the dependencies file to the working directory
COPY requirement.txt .

# install dependencies
RUN pip install -r requirement.txt

COPY . .


# command to run on container start
CMD [ "python", "gcexporter.py" ]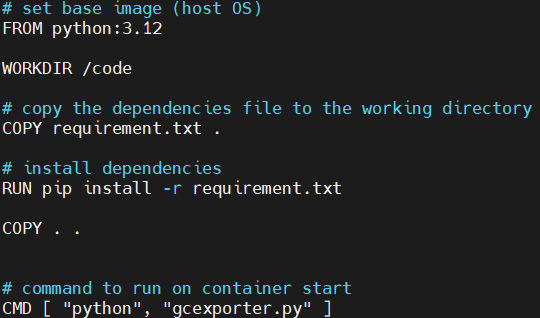
Create a docker-compose.yml file.
nano docker-compose.yml
add following code into it.
version: '3.8'
services:
  grafana:
    image: docker.io/grafana/grafana:latest
    ports:
      - 3000:3000
    environment:
       GF_INSTALL_PLUGINS: grafana-polystat-panel,yesoreyeram-boomtable-panel
    links:
      - prometheus

  prometheus:
      image: docker.io/prom/prometheus:v2.28.1
      ports:
       - 9090:9090
      links:
       - gitlab-ci-pipelines-exporter
      volumes:
       - ./Prometheus/prometheus.yml:/etc/prometheus/prometheus.yml

  gitlab-ci-pipelines-exporter:
    image: docker.io/mvisonneau/gitlab-ci-pipelines-exporter:v0.5.2
    ports:
      - 8080:8080
    environment:
      GCPE_CONFIG: /etc/gitlab-ci-pipelines-exporter.yml
    volumes:
      - type: bind
        source: ./gitlab-ci-pipelines-exporter.yml
        target: /etc/gitlab-ci-pipelines-exporter.yml

  customized_exporter:
        build: .
        ports:
            - "8500:8500"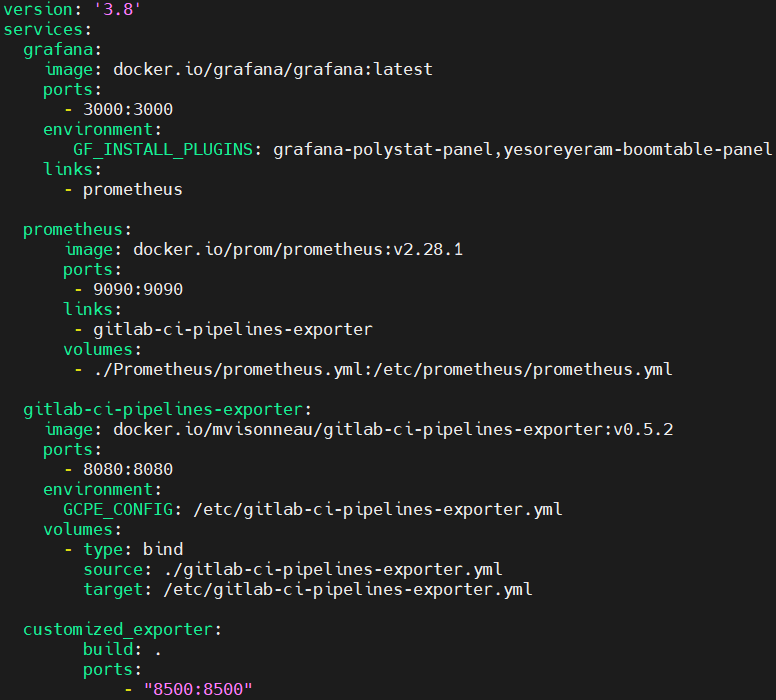
Create a configuration file for the GitLab CI Pipelines Exporter.
nano gitlab-ci-pipelines-exporter.yml
add the following code into it. Get the token from gitlab and project id from your project setting.
log:
  level: info

gitlab:
  url: https://gitlab.com
  token: '<gitlab_token>'

# Example public projects to monitor
projects:
  - name: demo/test_pipeline
    # Pull environments related metrics prefixed with 'stable' for this project
    pull:
      environments:
        enabled: true
      refs:
        branches:
          # Monitor pipelines related to project branches
          # (optional, default: true)
          enabled: true

          # Filter for branches to include
          # (optional, default: "^main|master$" -- main/master branches)
          regexp: ".*"
        merge_requests:
          # Monitor pipelines related to project merge requests
          # (optional, default: false)
          enabled: true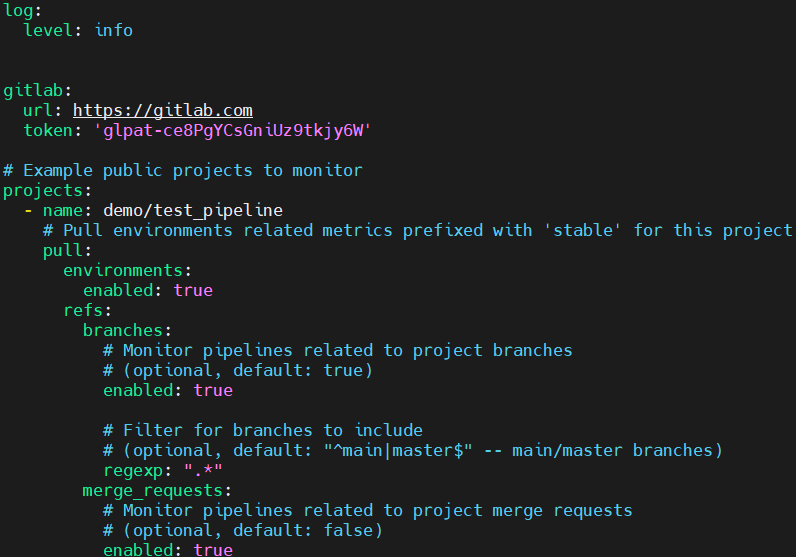
Create a gcexporter.py. This is a customized exporter to retrieve total branch count in the project.
nano gcexporter.py
add the following code into it.
import random
import time
import re
import gitlab
import requests
from requests.auth import HTTPBasicAuth
import json
import time
import random
from prometheus_client import start_http_server, Gauge

group_name='demo'
gitlab_server='https://gitlab.com/'
auth_token= '<gitlab _token>'

gl = gitlab.Gitlab(url=gitlab_server, private_token=auth_token)
group = gl.groups.get(group_name)
project_id= <project_id>
project = gl.projects.get(project_id)
gitlab_branch_count = Gauge('gitlab_branch_count', "Number of Branch Count")
def get_metrics():
   gitlab_branch_count.set(len(project.branches.list()))

if __name__ == '__main__':
    start_http_server(8500)
    while True:
        get_metrics()
        time.sleep(43200)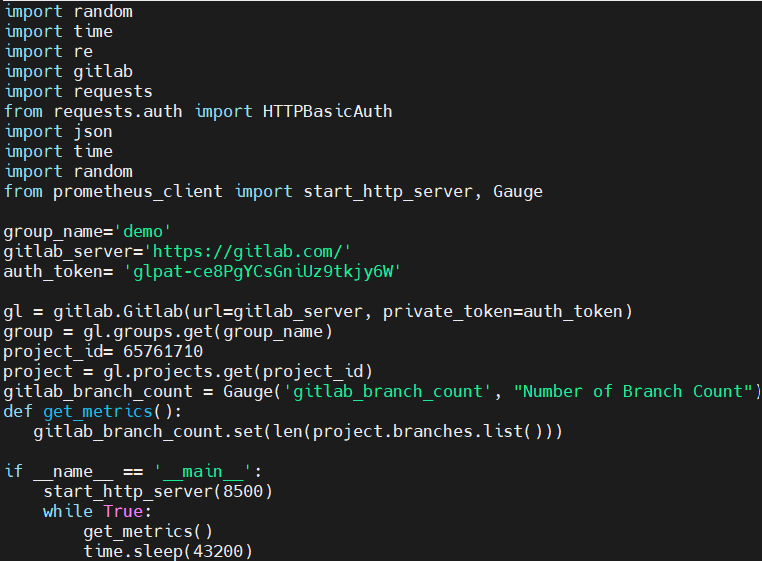
Create a requirement.txt file.
nano requirement.txt
add the following code into it.
python-gitlab==3.1.1
prometheus-client==0.13.1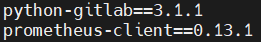
Step #3:Install Python Dependencies
The requirement.txt file contains the dependencies for the custom exporter. So lets run the following command.
pip3 install -r requirement.txt
Monitor GitLab Pipelines Using Prometheus and Grafana
Step #4:Build and Start the Services
Build the Docker containers.
docker-compose build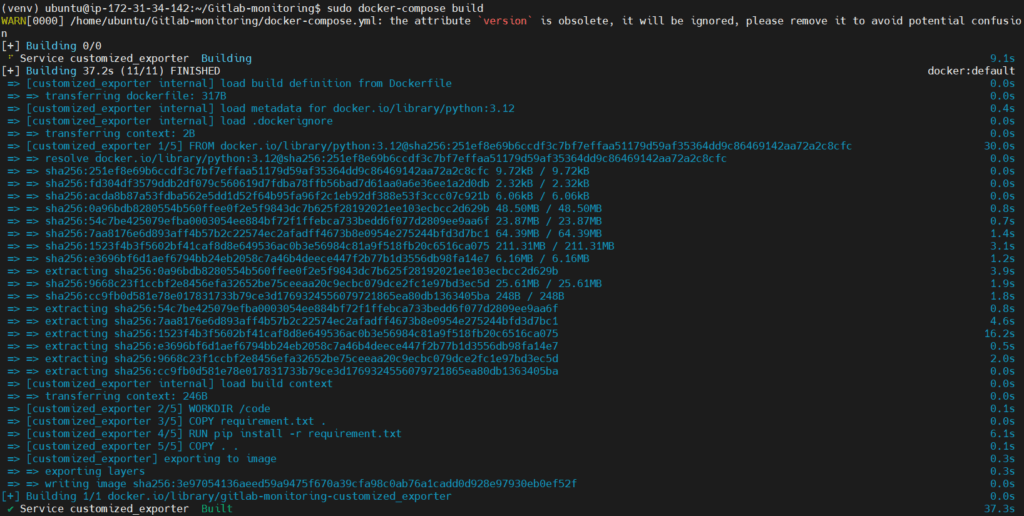
Start the services.
docker-compose up -d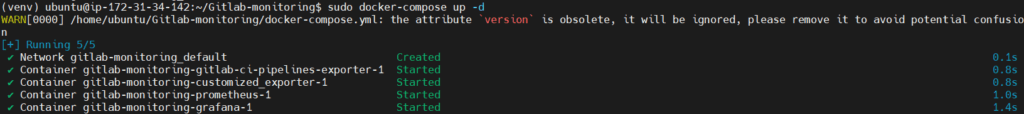
Check running containers.
docker ps -a
Step #5:Access the Services
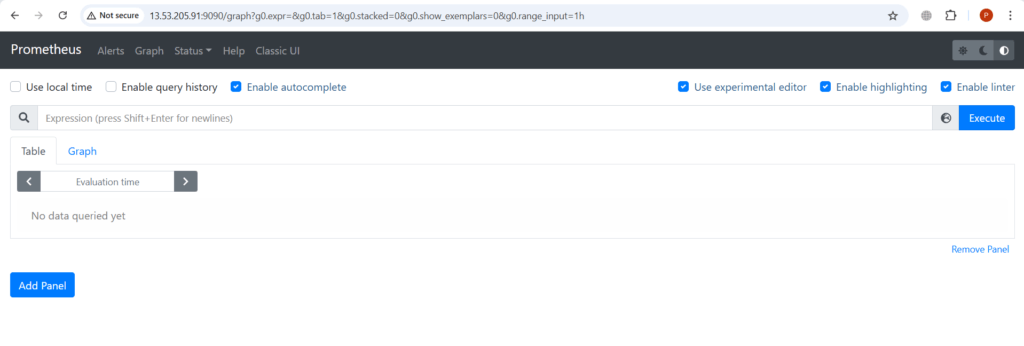
Visit http://<EC2-Public-IP>:9090 to verify data collection. Below you can see the Prometheus UI.
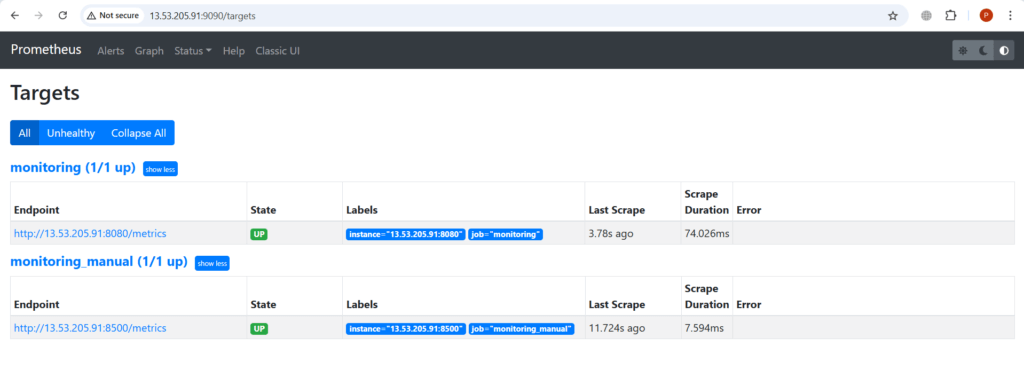
Go to the Status > Targets page to verify that both exporters (monitoring and monitoring_manual) are being scraped successfully.
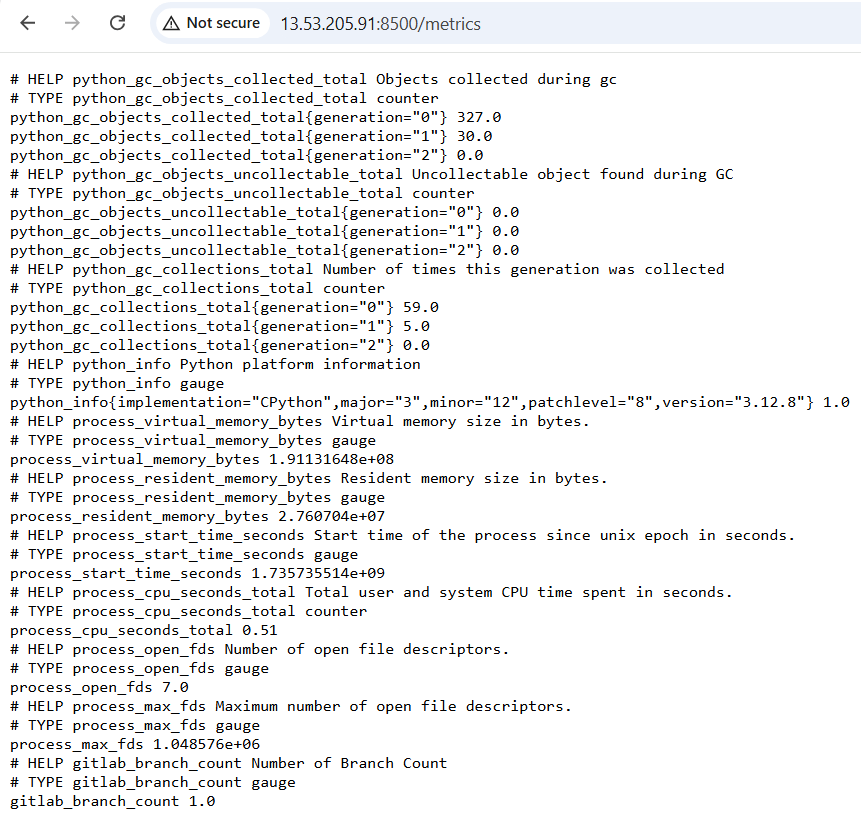
Now the customized metrics should be available. Visit http://<EC2-Public-IP>:8500/metrics.
Visit http://<EC2-Public-IP>:8080/metrics.

Step #6:Configure Grafana and Visualize the metrics
Access grafana by running http://<EC2-Public-IP>:3000.
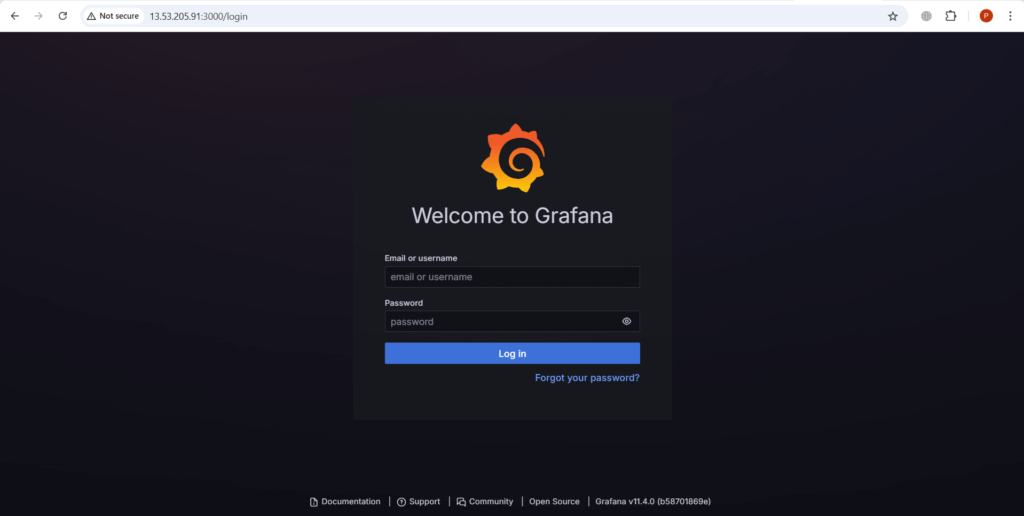
Enter admin as a default Username and Password.
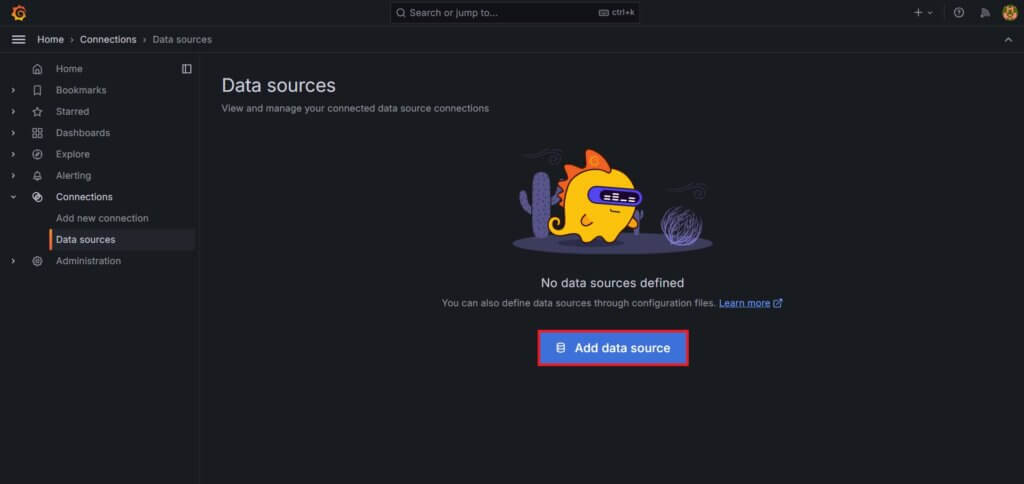
Now go to Connections > Data sources.

Click on Add data source.
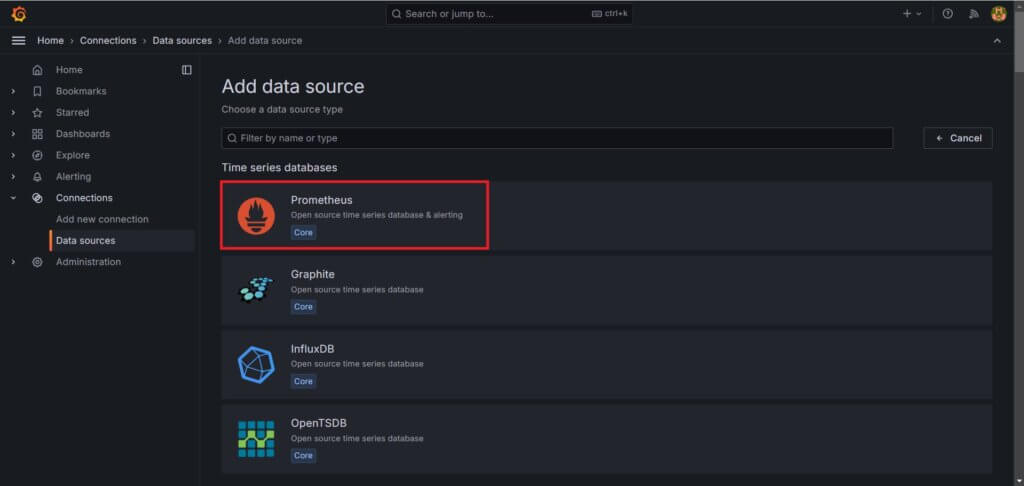
Select Prometheus as a data source.
Enter the your prometheus url.
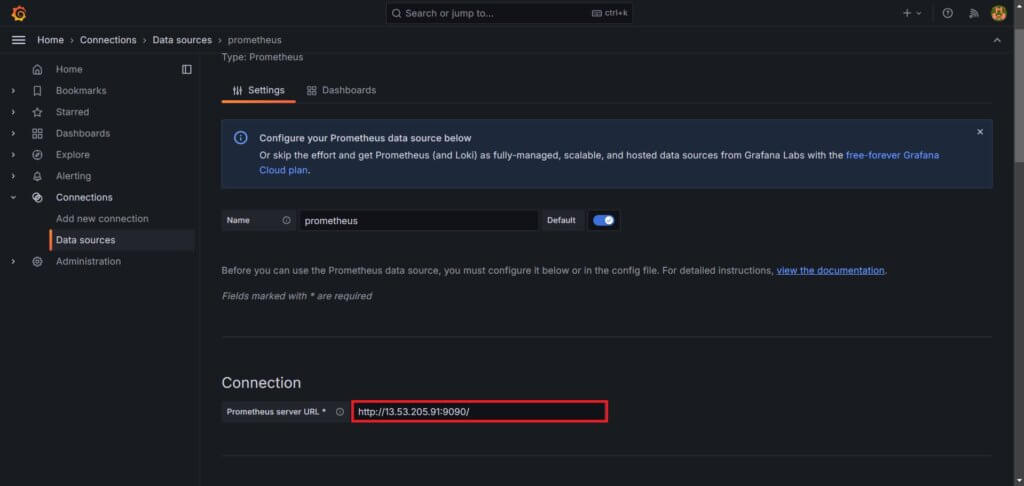
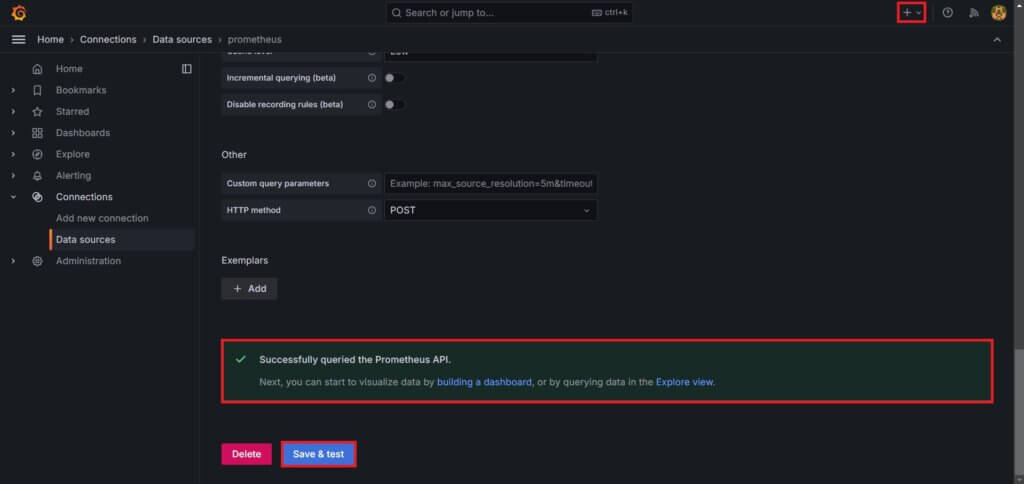
Click on save and test. You will get the message Successfully queried the prometheus API. Then go to “+” icon at up-right corner.
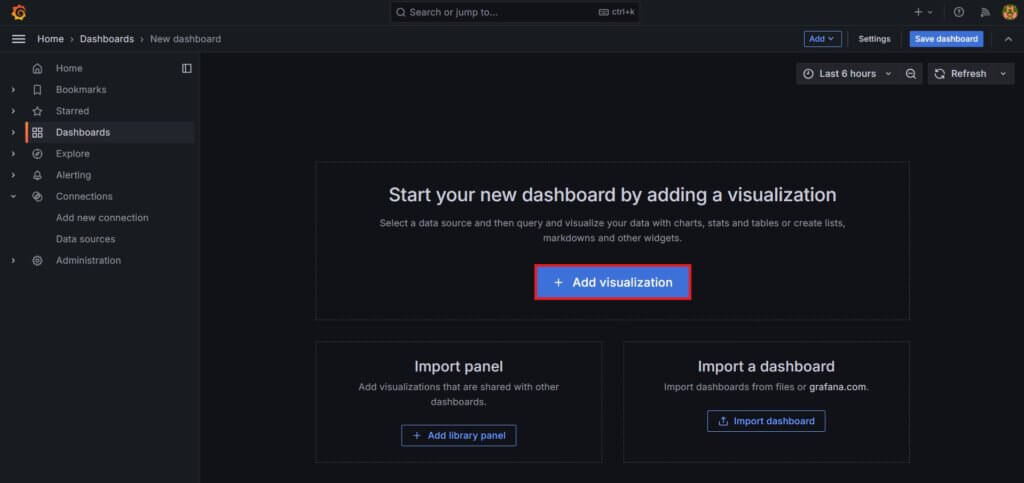
Select New dashboard.

Click on Add visualisation.
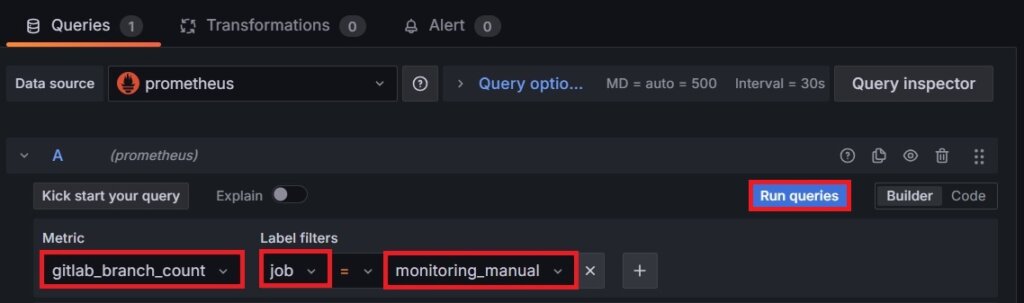
Select Prometheus as a data source.

Enter the query In Metric – gitlab_branch_count. It will tell us the count of existing branches within the project. Also select job = monitoring_manual. Click on Run queries.
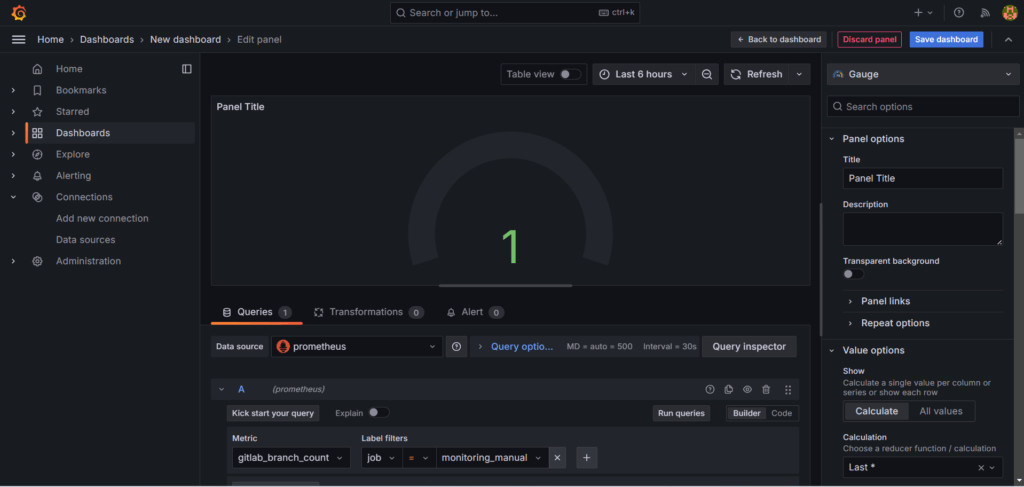
Below is our output it showing that 1 branch is connected to our project, you can run different query. This is a Gauge visualization you can also change it.
Conclusion:
In conclusion, we’ve successfully set up monitoring for GitLab pipelines using Prometheus and Grafana. By setting up Prometheus and Grafana to monitor GitLab pipelines, you can gain valuable insights into your CI/CD workflows. With real-time data and intuitive dashboards, you’ll be better equipped to troubleshoot issues, optimize performance, and ensure smoother deployments.
This setup can easily be expanded to include more metrics or integrated with other tools, making it a versatile choice for developers and DevOps teams.
Related Articles:
Kubernetes Metrics and Logs using Prometheus, Filebeat, and Grafana Loki
Reference: