In this article, we will learn Set up Prometheus and Alert Manager for Kubernetes Cluster with Custom Alerts | How to Set Up Prometheus and AlertManager in Kubernetes with Custom Alerts. Effective monitoring is an essential part of managing Kubernetes clusters. Prometheus, combined with AlertManager, offers a robust solution for tracking the health and performance of your applications. We will guide you through the step-by-step process of setting up Prometheus and AlertManager in Kubernetes, including configuring custom alerts.
Table of Contents
Prerequisites
- AWS Account with Ubuntu 24.04 LTS EC2 Instance.
- Minikube and kubectl, Helm Installed
- Basic knowledge of Kubernetes
Step #1:Set Up Ubuntu EC2 Instance
Update the Package List.
sudo apt update
Installs essential tools like curl, wget and apt-transport-https.
sudo apt install curl wget apt-transport-https -y
Installs Docker, a container runtime that will be used as the VM driver for Minikube.
sudo apt install docker.io -y
Add the current user to the Docker group, allowing the user to run Docker commands without sudo.
sudo usermod -aG docker $USER
Adjust permissions for the Docker socket, enabling easier communication with the Docker daemon.
sudo chmod 666 /var/run/docker.sock
Checks if the system supports virtualization.
egrep -q 'vmx|svm' /proc/cpuinfo && echo yes || echo no
Install KVM and Related Tools.
sudo apt install qemu-kvm libvirt-clients libvirt-daemon-system bridge-utils virtinst libvirt-daemon
Add User to Virtualization Groups.
sudo adduser $USER libvirt
sudo adduser $USER libvirt-qemu
Reload Group.
newgrp libvirt
newgrp libvirt-qemu
Step #2:Install Minikube and kubectl
Download the latest Minikube binary.
curl -LO https://storage.googleapis.com/minikube/releases/latest/minikube-linux-amd64
Install it to /usr/local/bin, making it available system-wide.
sudo install minikube-linux-amd64 /usr/local/bin/minikube
Use minikube version command to confirm the installation.
minikube version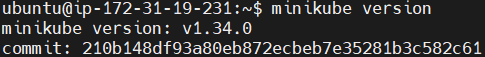
Download the latest version of kubectl (Kubernetes CLI).
curl -LO "https://dl.k8s.io/release/$(curl -L -s https://dl.k8s.io/release/stable.txt)/bin/linux/amd64/kubectl"
Make the kubectl binary executable.
chmod +x ./kubectl
move it to /usr/local/bin
sudo mv kubectl /usr/local/bin/
Use kubectl version command to check the installation.
kubectl version --client --output=yaml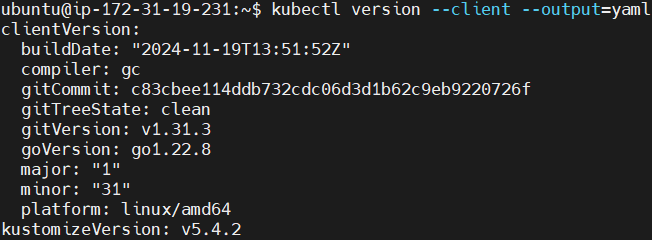
Step #3:Start the Minikube
Start Minikube with Docker as the driver.
minikube start --vm-driver docker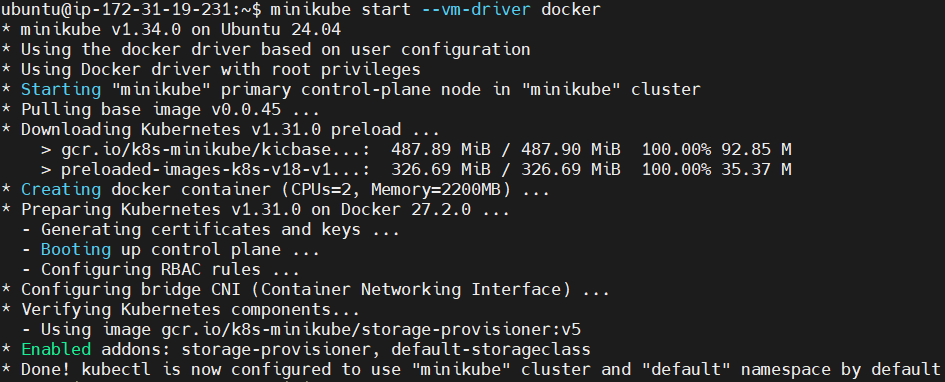
To Check the status of Minikube run the following command.
minikube status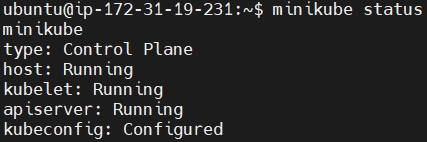
Step #4:Install the Helm
Download the helm, a package manager for Kubernetes.
curl -fsSL -o get_helm.sh https://raw.githubusercontent.com/helm/helm/main/scripts/get-helm-3
Change its permissions.
chmod 700 get_helm.sh
Install the helm.
./get_helm.sh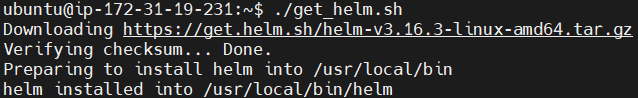
Check its version to confirm the installation.
helm version
Add Prometheus Helm Chart Repository.
helm repo add prometheus-community https://prometheus-community.github.io/helm-charts
update the Helm repositories to fetch the latest charts.
helm repo update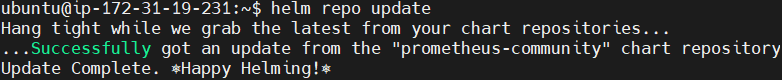
Step #5:Configure Prometheus, Alertmanager and Grafana on Kubernetes Cluster
Create a custom-values.yaml file to configure Prometheus and Grafana services as NodePort
nano custom-values.yaml
Add the following configuration.
prometheus:
  service:
    type: NodePort
grafana:
  service:
    type: NodePort
alertmanager:
  service:
    type: NodePort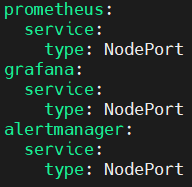
Deploy the Prometheus, Alertmanager and Grafana stack.
helm upgrade --install kube-prometheus-stack prometheus-community/kube-prometheus-stack -f custom-values.yaml
This command will deploy Prometheus, Alertmanager, and Grafana to your cluster with the services exposed as NodePort.
Step #6:Access Prometheus, Alertmanager and Grafana
List the services to get NodePort details.
kubectl get services
Forward the Prometheus service to port 9090.
kubectl port-forward --address 0.0.0.0 svc/kube-prometheus-stack-prometheus 9090:9090
Access the UI of Prometheus on web browser using http://<EC2-Public-IP>:9090.

Open the duplicate tab and Forward the Alertmanager service to port 9093.
kubectl port-forward --address 0.0.0.0 svc/kube-prometheus-stack-alertmanager 9093:9093
Access the UI of Alertmanager on web browser using http://<EC2-Public-IP>:9093.

To access the alertmanager alerts, Click on alerts on Prometheus UI to see them.
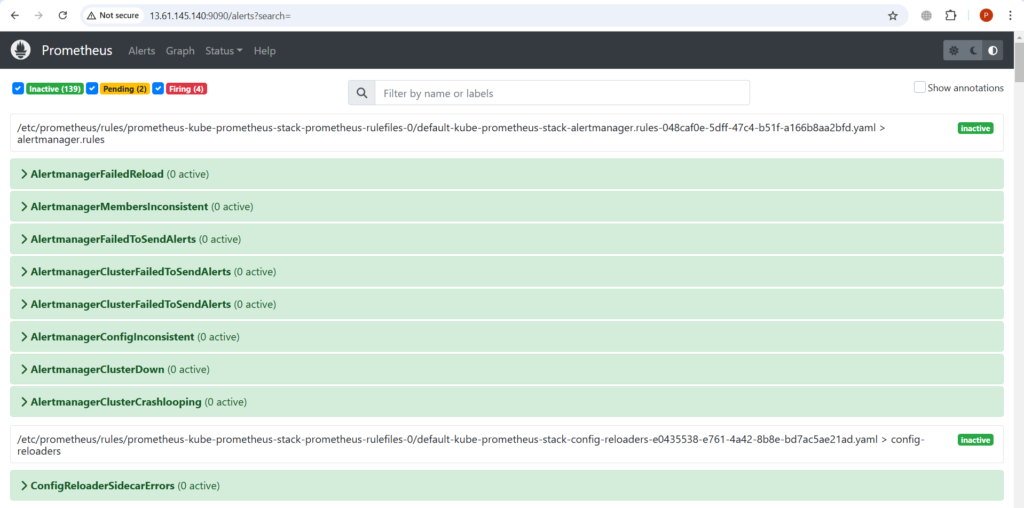
Here you can see the alerts which are in firing state, and you can see them on alertmanager UI also

Open the duplicate tab and Forward the Grafana service to port 3000.
kubectl port-forward --address 0.0.0.0 svc/kube-prometheus-stack-grafana 3000:80
Access the UI of Grafana on web browser using http://<EC2-Public-IP>:3000.

Step #7:Configure Custom Alert Rules
So now we have seen the default alerts configured in prometheus and alertmanager so far.
Next lets try to add the custom alert rules in it to monitor our kubernetes cluster.
Open another duplicate tab. Create and define alert rules in a custom-alert-rules.yaml file.
nano custom-alert-rules.yaml 
add the following content into it.
apiVersion: monitoring.coreos.com/v1
kind: PrometheusRule
metadata:
  labels:
    app: kube-prometheus-stack
    app.kubernetes.io/instance: kube-prometheus-stack
    release: kube-prometheus-stack
  name: kube-pod-not-ready
spec:
  groups:
  - name: my-pod-demo-rules
    rules:
    - alert: KubernetesPodNotHealthy
      expr: sum by (namespace, pod) (kube_pod_status_phase{phase=~"Pending|Unknown|Failed"}) > 0
      for: 1m
      labels:
        severity: critical
      annotations:
        summary: Kubernetes Pod not healthy (instance {{ $labels.instance }})
        description: "Pod {{ $labels.namespace }}/{{ $labels.pod }} has been in a non-running state for longer than 15 minutes.\n  VALUE = {{ $value }}\n  LABELS = {{ $labels }}"
    - alert: KubernetesDaemonsetRolloutStuck
      expr: kube_daemonset_status_number_ready / kube_daemonset_status_desired_number_scheduled * 100 < 100 or kube_daemonset_status_desired_number_scheduled - kube_daemonset_status_current_number_scheduled > 0
      for: 10m
      labels:
        severity: warning
      annotations:
        summary: Kubernetes DaemonSet rollout stuck (instance {{ $labels.instance }})
        description: "Some Pods of DaemonSet {{ $labels.namespace }}/{{ $labels.daemonset }} are not scheduled or not ready\n  VALUE = {{ $value }}\n  LABELS = {{ $labels }}"
    - alert: ContainerHighCpuUtilization
      expr: (sum(rate(container_cpu_usage_seconds_total{container!=""}[5m])) by (pod, container) / sum(container_spec_cpu_quota{container!=""}/container_spec_cpu_period{container!=""}) by (pod, container) * 100) > 80
      for: 2m
      labels:
        severity: warning
      annotations:
        summary: Container High CPU utilization (instance {{ $labels.instance }})
        description: "Container CPU utilization is above 80%\n  VALUE = {{ $value }}\n  LABELS = {{ $labels }}"
    - alert: ContainerHighMemoryUsage
      expr: (sum(container_memory_working_set_bytes{name!=""}) BY (instance, name) / sum(container_spec_memory_limit_bytes > 0) BY (instance, name) * 100) > 80
      for: 2m
      labels:
        severity: warning
      annotations:
        summary: Container High Memory usage (instance {{ $labels.instance }})
        description: "Container Memory usage is above 80%\n  VALUE = {{ $value }}\n  LABELS = {{ $labels }}"
    - alert: KubernetesContainerOomKiller
      expr: (kube_pod_container_status_restarts_total - kube_pod_container_status_restarts_total offset 10m >= 1) and ignoring (reason) min_over_time(kube_pod_container_status_last_terminated_reason{reason="OOMKilled"}[10m]) == 1
      for: 0m
      labels:
        severity: warning
      annotations:
        summary: Kubernetes Container oom killer (instance {{ $labels.instance }})
        description: "Container {{ $labels.container }} in pod {{ $labels.namespace }}/{{ $labels.pod }} has been OOMKilled {{ $value }} times in the last 10 minutes.\n  VALUE = {{ $value }}\n  LABELS = {{ $labels }}"
    - alert: KubernetesPodCrashLooping
      expr: increase(kube_pod_container_status_restarts_total[1m]) > 3
      for: 2m
      labels:
        severity: warning
      annotations:
        summary: Kubernetes pod crash looping (instance {{ $labels.instance }})
        description: "Pod {{ $labels.namespace }}/{{ $labels.pod }} is crash looping\n  VALUE = {{ $value }}\n  LABELS = {{ $labels }}"
Apply the custom alert rules to the kubernetes cluster.
kubectl apply -f custom-alert-rules.yaml
next visit the prometheus UI again to see the custom alert rules (refresh the page).

as you can see we have successfully added the new custom alert rules to our alertmanager.
Step #8:Deploy a Test Application
Now to check our custom alert rules are working we’ll create a application with wrong image tag.
Deploy an Nginx pod to test monitoring and alerting.
kubectl run nginx-pod --image=nginx:lates3
the correct tag is latest but we have written a lates3 to trigger the alert.
check the status of the pod.
kubectl get pods nginx-pod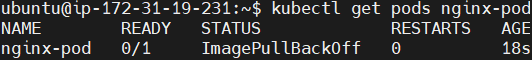
As you can see the pod is not ready and showing an error of ImagePullBackOff.
Now this will trigger the alert since we have created custom alert rules.
Go to the prometheus and alertmanager UI, refresh the page and look for the alert related to pod failure. It should appear at the user inaterface.


Understanding Custom Alert Rules:
Key Components of an Alert Rule:
- Name: Unique alert identifier.
- Expression (expr): PromQL condition.
- For: Time to persist condition before triggering.
- Labels: Metadata to categorize alerts (e.g.,
severity). - Annotations: Dynamic info to help diagnose the issue.
Conclusion:
In conclusion, today we have seen How to Set Up Prometheus and AlertManager in Kubernetes with Custom Alerts. With Prometheus and AlertManager deployed, you can have a robust system for monitoring Kubernetes clusters and applications. Custom alerts enable proactive responses to potential issues, enhancing reliability and performance. By integrating Grafana, you can visualize metrics and alerts for actionable insights. Expand your setup by adding more custom rules and dashboards to meet your operational needs.
Related Articles:
Collect HTTP Metrics for Java App OpenTelemetry and Prometheus
Reference: