In this article we will learn about Monitoring .NET API 5xx Alerts with OpenTelemetry, Prometheus, and Grafana. Monitoring the health of your .NET applications is crucial for ensuring reliability and a good user experience. This article provides a step-by-step guide to setting up a robust monitoring system for .NET 5xx errors using OpenTelemetry, Prometheus, and Grafana. By integrating these powerful tools, you can collect detailed application metrics, store them efficiently, and visualize them in custom dashboards to receive timely alerts on critical issues.
Table of Contents
Prerequisites
- AWS Account with Ubuntu 24.04 LTS EC2 Instance.
- Basic Knowledge of .Net, Opentelemetry, Prometheus and Grafana.
Step #1:Install .NET SDK on Ubuntu
Update and upgrade the package list to ensure you’re installing the latest version.
sudo apt update && sudo apt upgrade -y
We’ll install the .NET 9 SDK using Microsoft’s official script. Download the .NET installation script
wget https://dot.net/v1/dotnet-install.sh -O dotnet-install.sh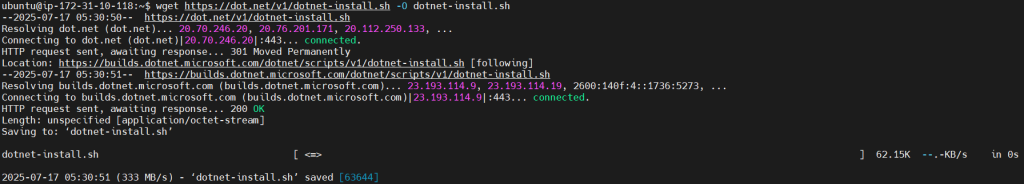
Make the script executable.
chmod +x dotnet-install.sh
Install .NET 9 SDK. This will install the SDK to your user’s home directory.
./dotnet-install.sh --channel 9.0
Make dotnet command available globally, add it to your shell’s PATH.
echo 'export PATH=$PATH:$HOME/.dotnet' >> ~/.bashrc
source ~/.bashrc
Verify installation.
dotnet --version
Step #2:Create a .NET Web API with OpenTelemetry
Create a new directory for the project and navigate to it.
mkdir MyLearningApp
cd MyLearningApp
Create a new minimal web API project in the current directory, disabling HTTPS for simplicity.
dotnet new web -o . --no-https
Install the necessary NuGet packages.
dotnet add package OpenTelemetry.Extensions.Hosting
dotnet add package OpenTelemetry.Instrumentation.AspNetCore
dotnet add package OpenTelemetry.Exporter.Prometheus.AspNetCore --prerelease
dotnet add package OpenTelemetry.Exporter.Console
dotnet add package OpenTelemetry.Instrumentation.Http
dotnet add package OpenTelemetry.Instrumentation.Runtime
dotnet add package Swashbuckle.AspNetCore
dotnet add package Microsoft.AspNetCore.OpenApi
Now, replace the content of the default Program.cs file with your API logic, including the new OpenTelemetry configuration for metrics and logging.
nano Program.cs
Replace the existing content with the following code.
using Microsoft.AspNetCore.Http;
using Microsoft.AspNetCore.Mvc;
using Microsoft.OpenApi.Models;
using OpenTelemetry.Metrics;
using OpenTelemetry.Resources;
using OpenTelemetry.Trace;
using OpenTelemetry.Logs;
using OpenTelemetry.Exporter;
using OpenTelemetry.Instrumentation.AspNetCore;
using OpenTelemetry.Instrumentation.Http;
using OpenTelemetry.Instrumentation.Runtime;

var builder = WebApplication.CreateBuilder(args);

// Basic Console Logger
builder.Logging.ClearProviders();
builder.Logging.AddSimpleConsole(options =>
{
    options.TimestampFormat = "[HH:mm:ss] ";
    options.SingleLine = true;
});

// Add OpenTelemetry Metrics with Prometheus Exporter
builder.Services.AddOpenTelemetry()
    .ConfigureResource(resource => resource
        .AddService("MyLearningApp"))
    .WithMetrics(metrics =>
    {
        metrics.AddAspNetCoreInstrumentation();
        metrics.AddHttpClientInstrumentation();
        metrics.AddRuntimeInstrumentation();
        metrics.AddPrometheusExporter();
    });

// Add services
builder.Services.AddControllers();
builder.Services.AddEndpointsApiExplorer();
builder.Services.AddSwaggerGen(options =>
{
    options.SwaggerDoc("v1", new OpenApiInfo { Title = "MyLearningApp API", Version = "v1" });
});

var app = builder.Build();

// Enable Prometheus scraping endpoint
app.UseOpenTelemetryPrometheusScrapingEndpoint(); // exposes /metrics

// Swagger
app.UseSwagger();
app.UseSwaggerUI();

// Minimal Test Endpoint with proper OpenAPI response documentation
app.MapGet("/api/test/{input}", ([FromRoute] string input, ILogger<Program> logger) =>
{
    if (input.ToLower() == "success")
    {
        logger.LogInformation("Received 'success' input. Returning 200 OK.");
        return Results.Ok("Input was correct! (200 OK)");
    }
    else
    {
        logger.LogError("Received wrong input: '{input}'. Returning 500 Internal Server Error.", input);
        return Results.Problem("Something went wrong! (500 Error)", statusCode: 500);
    }
})
.WithName("TestEndpoint")
.WithOpenApi(operation => {
    operation.Summary = "Test endpoint that returns 200 or 500 based on input.";
    operation.Responses["200"] = new OpenApiResponse { Description = "Input was correct!" };
    operation.Responses["500"] = new OpenApiResponse { Description = "Something went wrong!" };
    return operation;
});

app.Run();
Explanation of the Code:
- Imports & Logging:
- You import essential ASP.NET Core, OpenTelemetry, and Swagger namespaces.
- Logging is set up with
AddSimpleConsole()for clean and timestamped log output.
- OpenTelemetry Metrics Setup:
- OpenTelemetry is configured with a resource name (
MyLearningApp). - Metrics are collected from:
- ASP.NET Core (
AddAspNetCoreInstrumentation) - HTTP Client calls (
AddHttpClientInstrumentation) - .NET runtime metrics (
AddRuntimeInstrumentation)
- ASP.NET Core (
- Metrics are exposed to Prometheus using
AddPrometheusExporter().
- OpenTelemetry is configured with a resource name (
- Services & Swagger:
- Adds Swagger for API documentation with
AddSwaggerGen. - Swagger is configured with a title and version.
- Adds Swagger for API documentation with
- Prometheus Metrics Endpoint:
app.UseOpenTelemetryPrometheusScrapingEndpoint()makes the metrics available athttp://localhost:5000/metrics.
- Minimal API Endpoint
/api/test/{input}:- This endpoint returns:
- 200 OK if input is
"success". - 500 Internal Server Error otherwise.
- 200 OK if input is
- Logs are generated based on input value.
- Swagger (OpenAPI) metadata is added for this endpoint to describe its responses.
- This endpoint returns:
Run the application, listening on all network interfaces at port 5000.
dotnet run --urls "http://0.0.0.0:5000"
To access API, navigate to http://<EC2-Public-IPv4-Address>/swagger
http://<EC2-IP-Address>:5000/swagger
Write success as an input and execute it, you will get a 200 response code.

But if you write something else instead of it you will get 500 response code.

Go back to terminal and you can see the logs generated there,

Step #3:Install and Configure Prometheus
Create Prometheus user.
sudo useradd --no-create-home --shell /bin/false prometheus
Create necessary directories.
sudo mkdir /etc/prometheus /var/lib/prometheus
Download the latest Prometheus binary.
wget https://github.com/prometheus/prometheus/releases/download/v3.4.2/prometheus-3.4.2.linux-amd64.tar.gz
Extract the archive.
tar -xvf prometheus-3.4.2.linux-amd64.tar.gz
Navigate into the extracted Prometheus directory.
cd prometheus-3.4.2.linux-amd64
Move the Prometheus binaries to /usr/local/bin.
sudo mv prometheus promtool /usr/local/bin/
Set ownership for the binaries.
sudo chown prometheus:prometheus /usr/local/bin/prometheus /usr/local/bin/promtool
Navigate back to home directory.
cd
Set ownership for the binaries.
sudo chown -R prometheus:prometheus /etc/prometheus /var/lib/prometheus
Create and configure Prometheus config file.
sudo nano /etc/prometheus/prometheus.yml
Paste the following content into the file.
global:
  scrape_interval: 15s

scrape_configs:
  - job_name: 'dotnetapp'
    static_configs:
- targets: ['localhost:5000'] 
Set ownership for the config file.
sudo chown prometheus:prometheus /etc/prometheus/prometheus.yml
Create a systemd service for Prometheus.
sudo nano /etc/systemd/system/prometheus.service
Paste the following content into the file.
[Unit]
Description=Prometheus Monitoring
Wants=network-online.target
After=network-online.target

[Service]
User=prometheus
Group=prometheus
Type=simple
ExecStart=/usr/local/bin/prometheus \
  --config.file=/etc/prometheus/prometheus.yml \
  --storage.tsdb.path=/var/lib/prometheus \
  --web.console.templates=/etc/prometheus/consoles \
  --web.console.libraries=/etc/prometheus/console_libraries \
  --web.listen-address=:9090

Restart=always
RestartSec=10
SyslogIdentifier=prometheus

[Install]
WantedBy=multi-user.target
Reload, enable and start Prometheus.
sudo systemctl daemon-reload
sudo systemctl enable prometheus
sudo systemctl start prometheus
Navigate to http://<EC2-Public-IPv4-Address>:9090

Go to “Status” -> “Target health”.

You should see dotnetapp target with state UP.

Go back and then to “Graph” and try querying some metrics, and Execute it.
http_server_request_duration_seconds_count
Step #4:Install and Configure Grafana
Install dependencies for Grafana.
sudo apt-get install -y apt-transport-https software-properties-common wget
Add Grafana’s GPG key.
sudo mkdir -p /etc/apt/keyrings/
sudo wget -q -O /etc/apt/keyrings/grafana.key https://apt.grafana.com/gpg.key
Add the Grafana APT repository.
echo "deb [signed-by=/etc/apt/keyrings/grafana.key] https://apt.grafana.com stable main" | sudo tee -a /etc/apt/sources.list.d/grafana.list
Update apt cache.
sudo apt-get update
Install Grafana.
sudo apt-get install grafana -y
Enable and start Grafana service.
sudo systemctl enable grafana-server
sudo systemctl start grafana-server
Open the Grafana configuration file to configure SMTP settings for sending alert emails.
sudo nano /etc/grafana/grafana.ini
change the SMTP configuration like shown below.
[smtp]
enabled = true
host = smtp.gmail.com:587
user = [email protected]
password = your_app_password
;cert_file =
;key_file =
skip_verify = false
from_address = [email protected]
from_name = Grafana Alerts
ehlo_identity = grafana.example.com
Restart Grafana to apply the new configuration.
sudo systemctl restart grafana-server
Navigate to http://<EC2-Public-IPv4-Address>:3000
The default login is Username : admin, Password: admin.

You will be prompted to change the password on first login. You can change it or just skip it.

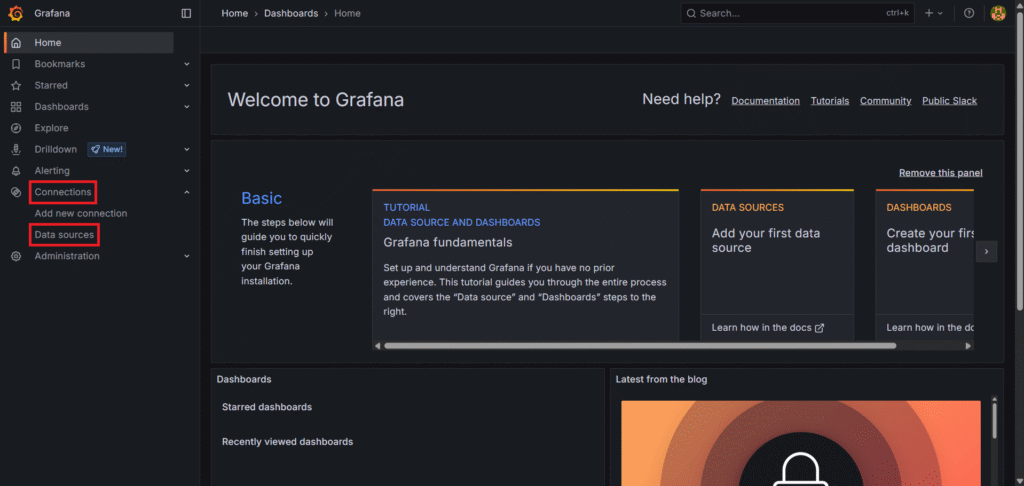
You will see the Home the page of grafana.

Now go to Connections from the left sidebar then go to Data sources.
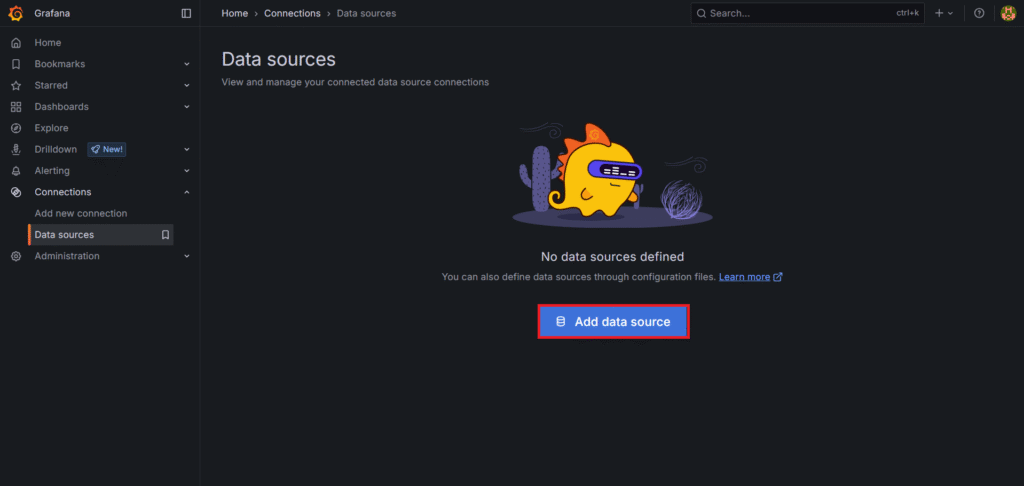
Click Add Data Source
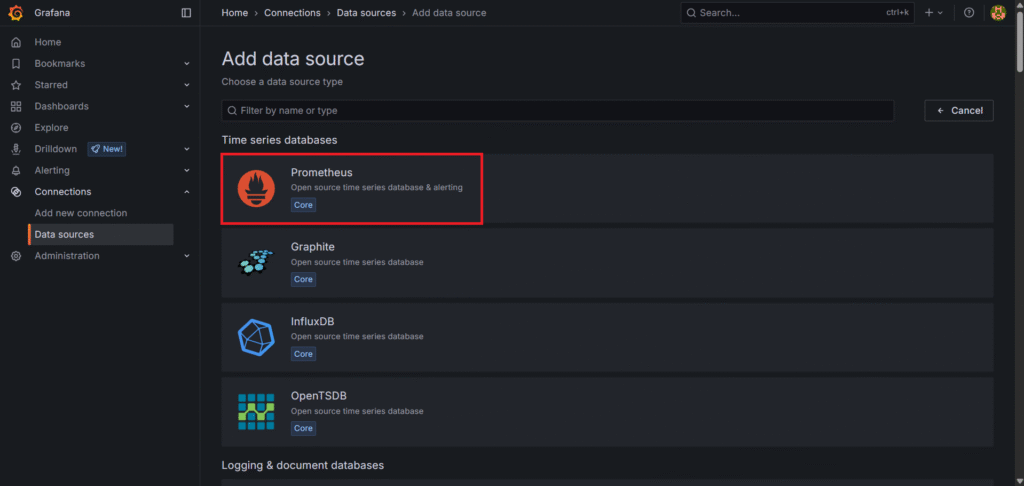
Choose Prometheus as a Data source
Set URL: http://<EC2-Public-IPv4-Address>:9090

Click Save & Test. It should say “Successfully queried the Prometheus API“.

Step #5:Create Dashboard in Grafana
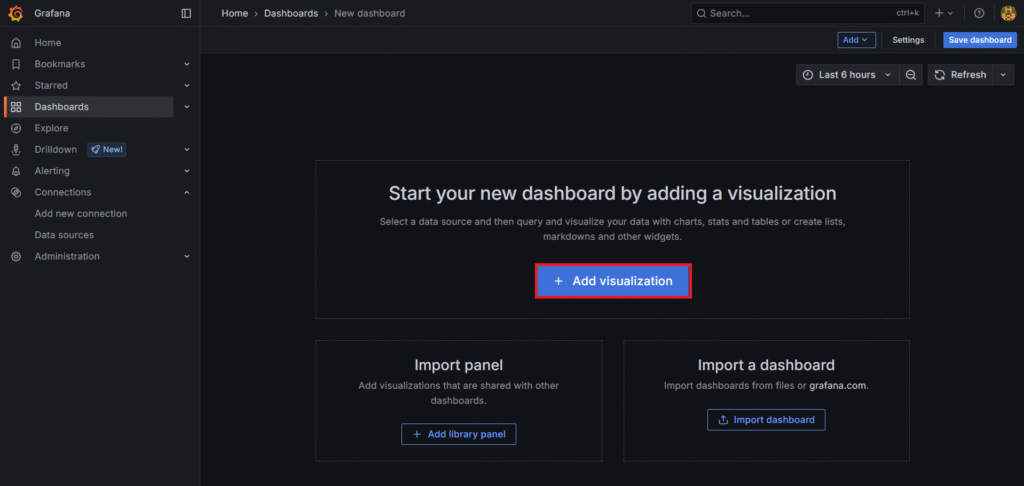
Click “+ ” icon -> New Dashboard at the top-right corner.

Click Add visualization.
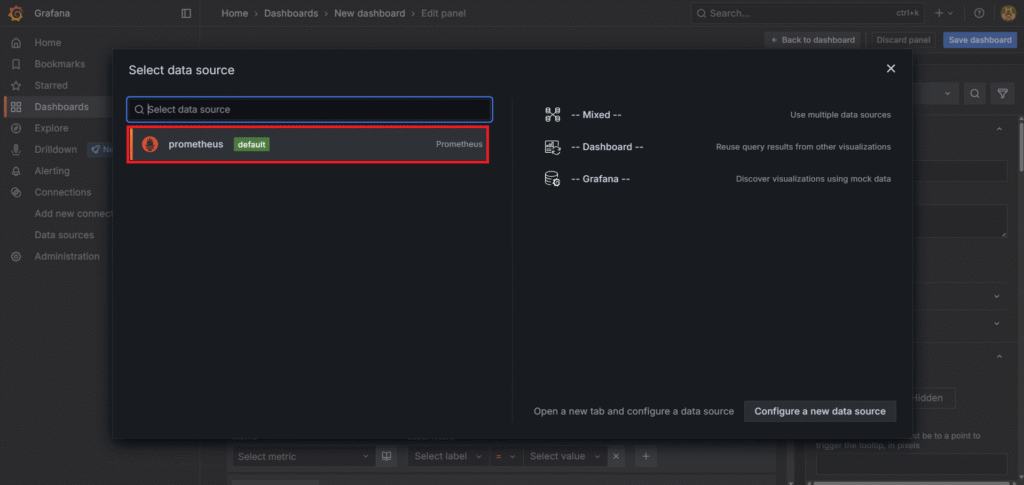
Select Prometheus as a date source.
Select Time series as a visualization. Enter a below Promql query in the Metrics browser. Click on Run queries. Then click on Save dashboard. With a name like .Net API Monitoring.
rate(http_server_request_duration_seconds_count[1m])

Step #6:Set Up 5XX Alert in Grafana
Now go to Alert rules and click on New alert rule.

Enter a name like Email Alert then write a same query used in panel. Set alert condition is below 5.
rate(http_server_request_duration_seconds_count[1m])
Then create a new folder (.Net Alert) or select the one you have created already. You can keep the Pending period 1m and Keep firing for None as it is. If you want to keep firing alert then change the Keep firing for from none to your suitable time.

Now lets select a contact point where it will send a alert. If you don’t have it just create a new one.

Click on Create contact point.

Give it a Name like Email Alert select Integration Email and enter the email address where you want to receive alert. Then click on Save contact point.

Now back to the alert rule select the Contact point we have just created Email Alert. Click on Link dashboard and panel.

Select the dashboard and alert you have just created and click on Confirm.

You can see below dashboard and panel added. Now click on Save rule and exit.

Now when the alerting condition is met you will see the alert being fired.

open your email and you will see the fired alert.


Conclusion:
Monitoring 5XX errors is essential for detecting issues in your .NET applications before they escalate. With OpenTelemetry providing standardized instrumentation, Prometheus efficiently collecting metrics, and Grafana giving real-time visualization and alerting, you now have a powerful observability stack. This setup helps teams act on problems quickly, improve uptime, and deliver a better experience to end users.
By combining minimal API design with Prometheus and Grafana alerts, developers can create lightweight, production-ready systems with proactive error monitoring built-in.
Related Articles:
.NET API Availability Monitoring Using OpenTelemetry, Prometheus and Grafana
Reference: