In this article, we are going to cover Monitoring Java API 5xx alerts with OpenTelemetry, Prometheus, and Grafana.
Table of Contents
Prerequisites:
- AWS Account with Ubuntu 24.04 LTS EC2 Instance.
- Basic understanding of Java, Maven, Spring Boot, OpenTelemetry, Prometheus, and Grafana.
Step #1:Install Essential Software (Java and Maven)
Update System Packages:
sudo apt update
sudo apt upgrade -y
Install Java Development Kit (JDK 17):
sudo apt install openjdk-17-jdk -y
After installation, verify Java:
java -version
javac -version
Output would be like:
openjdk version "17.0.15" 2025-04-15
OpenJDK Runtime Environment (build 17.0.15+6-Ubuntu-0ubuntu124.04)
OpenJDK 64-Bit Server VM (build 17.0.15+6-Ubuntu-0ubuntu124.04, mixed mode, sharing)
Install Apache Maven:
sudo apt install maven -y
Verify Maven installation:
mvn -v
You should see output similar to this:
Apache Maven 3.8.7 (b89d5959fc9c8535bc84a1ddf69ab5e2432a7860)
Maven home: /usr/share/maven
Java version: 17.0.10, vendor: Private Build, runtime: /usr/lib/jvm/java-17-openjdk-amd64
Default locale: en_US, platform encoding: UTF-8
OS name: "linux", version: "6.5.0-1018-aws", arch: "amd64", family: "unix"
Step #2:Create the Project Directory and pom.xml file
Now we will create the main directory for your Spring Boot project and then create its essential pom.xml file
Create the Root Project Directory:
mkdir ~/my-otel-app
cd ~/my-otel-app
Create a pom.xml file:
This file is the Project Object Model (POM) for Maven. It defines your project’s structure, dependencies (libraries your app needs), and how it should be built.
nano pom.xml
Run the following command:
nano pom.xml
An open editor will open paste the following content inside it:
<?xml version="1.0" encoding="UTF-8"?>
<project xmlns="http://maven.apache.org/POM/4.0.0" xmlns:xsi="http://www.w3.org/2001/XMLSchema-instance"
         xsi:schemaLocation="http://maven.apache.org/POM/4.0.0 https://maven.apache.org/xsd/maven-4.0.0.xsd">
    <modelVersion>4.0.0</modelVersion>
    <parent>
        <groupId>org.springframework.boot</groupId>
        <artifactId>spring-boot-starter-parent</artifactId>
        <version>3.2.7</version> <relativePath/> </parent>
    <groupId>com.example</groupId>
    <artifactId>my-otel-app</artifactId>
    <version>0.0.1-SNAPSHOT</version>
    <name>my-otel-app</name>
    <description>Demo project for OpenTelemetry Spring Boot</description>

    <properties>
        <java.version>17</java.version>
    </properties>

    <dependencies>
        <dependency>
            <groupId>org.springframework.boot</groupId>
            <artifactId>spring-boot-starter-web</artifactId>
        </dependency>

        <dependency>
            <groupId>org.springframework.boot</groupId>
            <artifactId>spring-boot-starter-actuator</artifactId>
        </dependency>

        <dependency>
            <groupId>org.springdoc</groupId>
            <artifactId>springdoc-openapi-starter-webmvc-ui</artifactId>
            <version>2.5.0</version> </dependency>

        <dependency>
            <groupId>org.springframework.boot</groupId>
            <artifactId>spring-boot-starter-test</artifactId>
            <scope>test</scope>
        </dependency>

    </dependencies>

    <build>
        <plugins>
            <plugin>
                <groupId>org.springframework.boot</groupId>
                <artifactId>spring-boot-maven-plugin</artifactId>
            </plugin>
        </plugins>
    </build>

</project>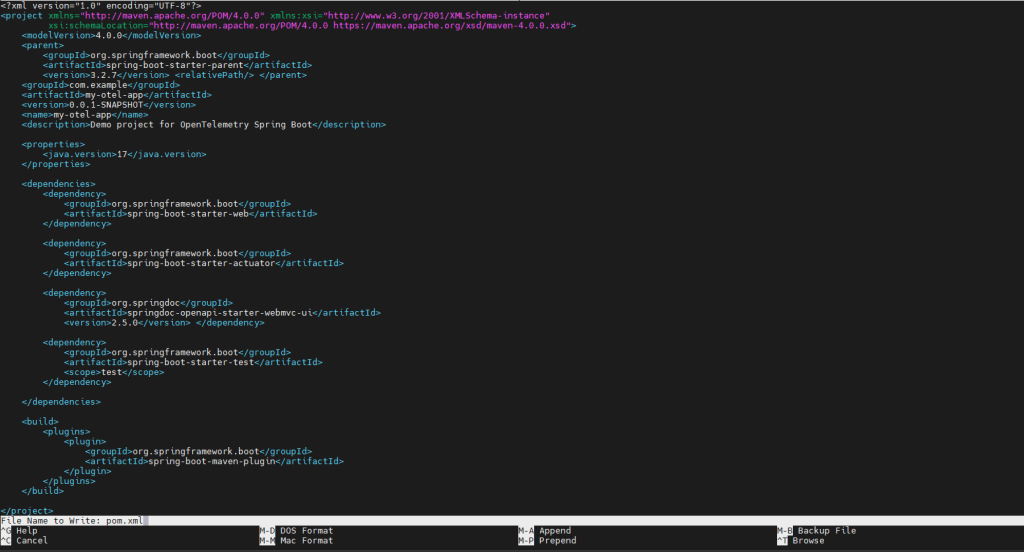
Save the file by pressing Ctrl+x; it will ask, “Save modified buffer? (Y/N/C)”. Type Y (for Yes). nano will confirm the file name just press the Enter key.
Step #3:Create Java Source Directory and Main Application Class
Now we will create Java Source Directory Structure and Main Application Class. So first we will create Java Source Directory Structure which is created using the following command:
mkdir -p src/main/java/com/example/myotelapp
Create MyOtelAppApplication.java:
This is the main class that Spring Boot uses to start your application. Use nano to create and edit this file inside the newly created directory structure.
nano src/main/java/com/example/myotelapp/MyOtelAppApplication.java
An open editor will open paste the following content inside it:
package com.example.myotelapp;

import org.slf4j.Logger;
import org.slf4j.LoggerFactory;
import org.springframework.boot.SpringApplication;
import org.springframework.boot.autoconfigure.SpringBootApplication;
import jakarta.annotation.PostConstruct; // Make sure to use jakarta for Spring Boot 3+

@SpringBootApplication
public class MyOtelAppApplication {

    private static final Logger logger = LoggerFactory.getLogger(MyOtelAppApplication.class);

    public static void main(String[] args) {
        SpringApplication.run(MyOtelAppApplication.class, args);
    }

    @PostConstruct
    public void logApplicationStartup() {
        logger.info("MyOtelAppApplication has started successfully!");
        logger.debug("This is a debug log message during startup.");
    }
}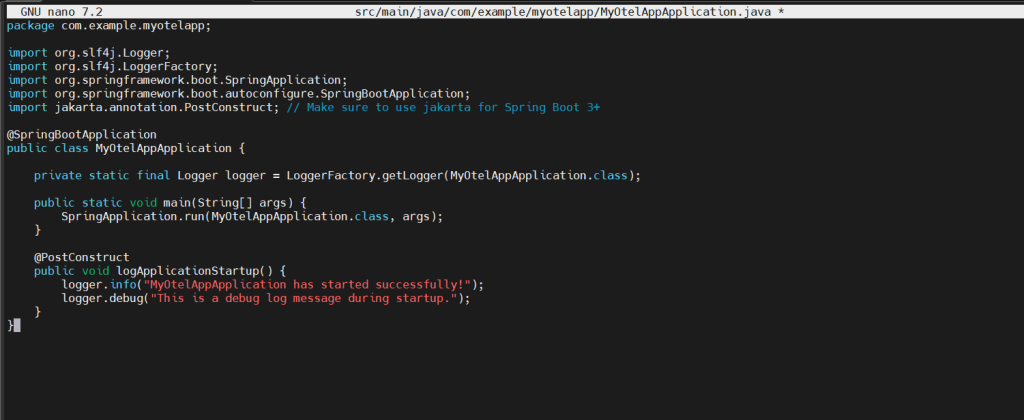
Save the file by pressing Ctrl+x; it will ask, “Save modified buffer? (Y/N/C)”. Type Y (for Yes). nano will confirm the file name just press the Enter key.
Step #4:Create the REST Controller Class with Error Handling
This step involves creating the Spring Boot REST controller that will handle incoming web requests. This controller will include multiple endpoints.
Create MyController.java file:
You will create this file in the same directory as your main application class (MyOtelAppApplication.java). Ensure you are still in your ~/my-otel-app directory.
nano src/main/java/com/example/myotelapp/MyController.java
An open editor will open paste the following content inside it:
package com.example.myotelapp;
import org.slf4j.Logger;
import org.slf4j.LoggerFactory;
import org.springframework.http.HttpStatus;
import org.springframework.http.ResponseEntity;
import org.springframework.web.bind.annotation.GetMapping;
import org.springframework.web.bind.annotation.RequestParam;
import org.springframework.web.bind.annotation.RestController;
@RestController
public class MyController {
private static final Logger logger = LoggerFactory.getLogger(MyController.class);
@GetMapping("/hello")
public String hello(@RequestParam(value = "name", defaultValue = "World") String name) {
logger.info("Received request for /hello with name: {}", name);
String message = String.format("Hello, %s! From MyOtelApp.", name);
logger.debug("Sending response: {}", message);
return message;
}
@GetMapping("/greeting")
public String greeting() {
logger.info("Received request for /greeting.");
try {
Thread.sleep(100); // Simulate some work
logger.debug("Simulated work completed for /greeting.");
} catch (InterruptedException e) {
Thread.currentThread().interrupt();
logger.error("Greeting interrupted", e);
}
return "Greetings from OpenTelemetry-enabled App!";
}
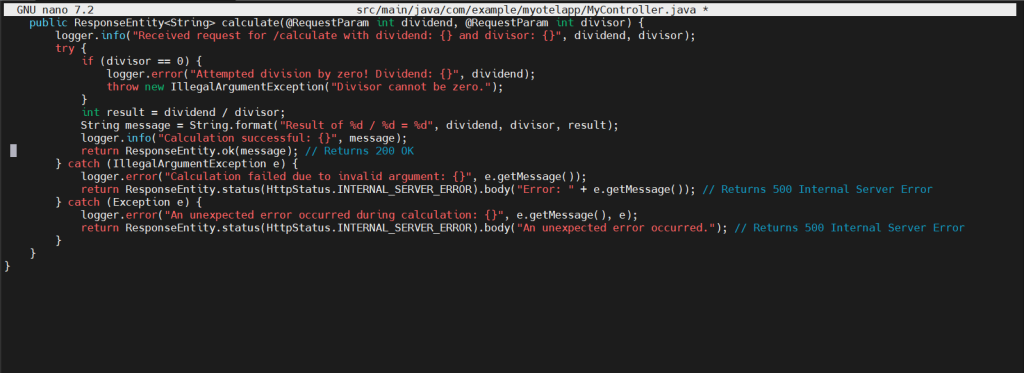
@GetMapping("/calculate")
public ResponseEntity<String> calculate(@RequestParam int dividend, @RequestParam int divisor) {
logger.info("Received request for /calculate with dividend: {} and divisor: {}", dividend, divisor);
try {
if (divisor == 0) {
logger.error("Attempted division by zero! Dividend: {}", dividend);
throw new IllegalArgumentException("Divisor cannot be zero.");
}
int result = dividend / divisor;
String message = String.format("Result of %d / %d = %d", dividend, divisor, result);
logger.info("Calculation successful: {}", message);
return ResponseEntity.ok(message); // Returns 200 OK
} catch (IllegalArgumentException e) {
logger.error("Calculation failed due to invalid argument: {}", e.getMessage());
return ResponseEntity.status(HttpStatus.INTERNAL_SERVER_ERROR).body("Error: " + e.getMessage()); // Returns 500 Internal Server Error
} catch (Exception e) {
logger.error("An unexpected error occurred during calculation: {}", e.getMessage(), e);
return ResponseEntity.status(HttpStatus.INTERNAL_SERVER_ERROR).body("An unexpected error occurred."); // Returns 500 Internal Server Error
}
}
}
Save the file by pressing Ctrl+x; it will ask, “Save modified buffer? (Y/N/C)”. Type Y (for Yes). nano will confirm the file name just press the Enter key.
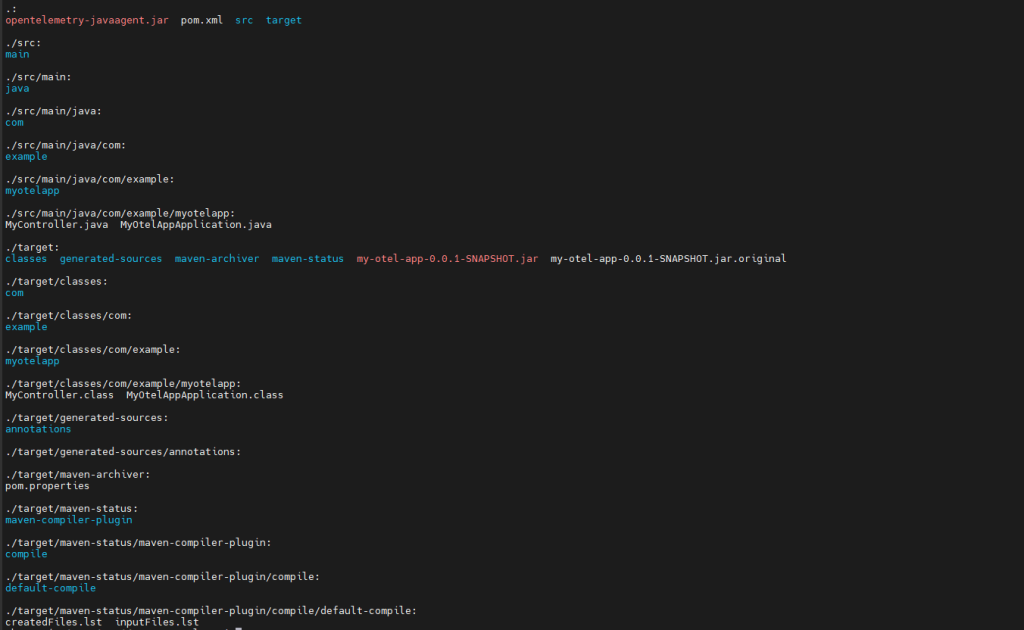
Verify the file structure by using the following command:
ls -R
Output should be like this:
Step #5:Build the Spring Boot Application and Download the OpenTelemetry Java Agent
Build the Spring Boot Application:
Ensure you are in the root of your project directory (~/my-otel-app) before running this command. This command tells Maven to clean up any previous build artifacts, download any necessary dependencies and then compile your Java code and package it.
cd ~/my-otel-app # Ensure you are in the correct directory
mvn clean package -DskipTests
Output should be like this:

Now download the OpenTelemetry Java Agent by running the following command:
wget https://github.com/open-telemetry/opentelemetry-java-instrumentation/releases/download/v2.17.1/opentelemetry-javaagent.jar
Verify the download by running the following command:
ls
It should look like this:

Step #6:Run the Application with OpenTelemetry Logging Exporter
In this step we will execute the Spring Boot application along with the OpenTelemetry Java Agent.
Execute the Spring Boot Application with the Java Agent by executing the following command:
java -Dotel.traces.exporter=logging \
     -Dotel.metrics.exporter=logging \
     -Dotel.logs.exporter=logging \
     -Dotel.exporter.otlp.traces.endpoint=none \
     -Dotel.exporter.otlp.metrics.endpoint=none \
     -Dotel.exporter.otlp.logs.endpoint=none \
     -javaagent:./opentelemetry-javaagent.jar \
     -jar target/my-otel-app-0.0.1-SNAPSHOT.jar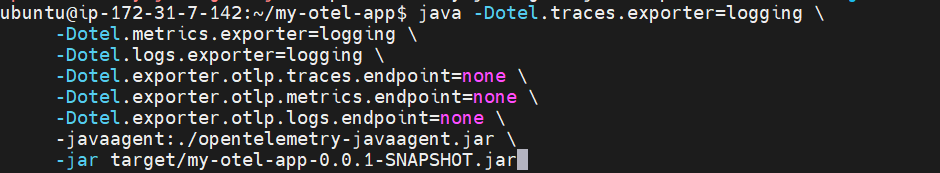
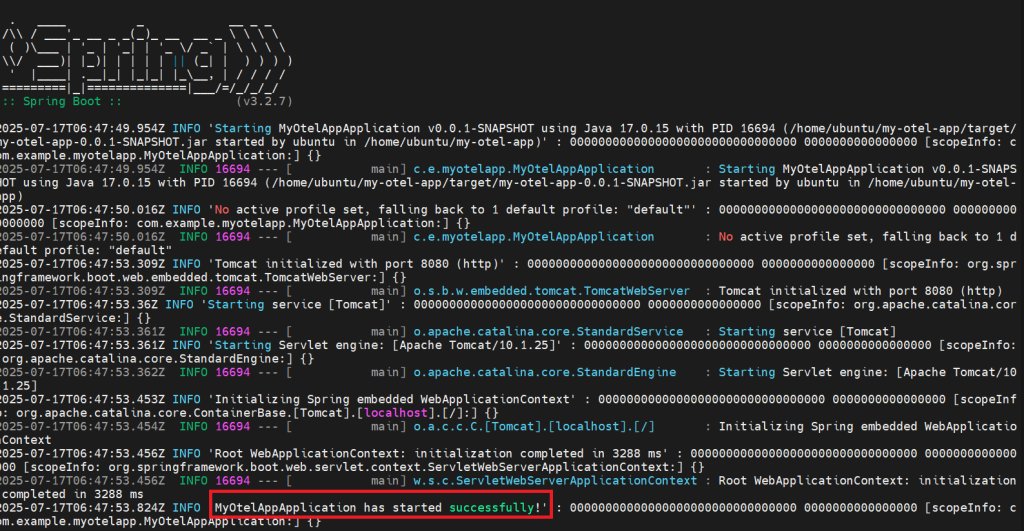
If you see the output like the following, then the task is done:
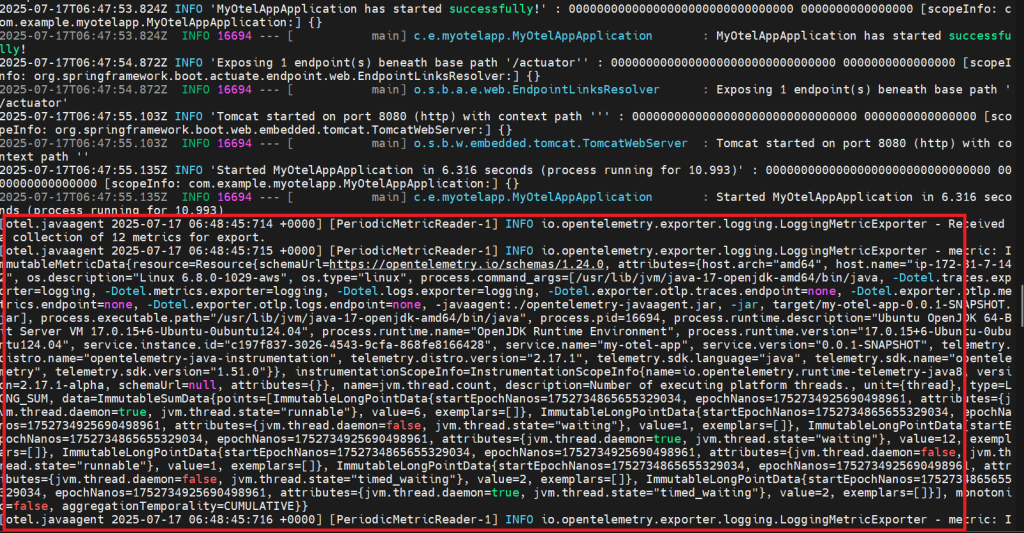
If you see like the following, then don’t worry it is part of the task only.
Step #7:Interact with Your Spring Boot Application and Observe Telemetry (including Errors)
In this part, we will interact with the application’s web endpoints from the browser using Swagger UI. We will specifically trigger both successful (200 OK) and error (500 Internal Server Error) responses. As we do, the OpenTelemetry agent will automatically capture traces and enrich the application logs, and all of this telemetry will be printed directly to the same terminal where the Spring Boot app is running.
Access Swagger UI:
Open a web browser on the system. Navigate to the Swagger UI provided by the Spring Boot application.
http://<YOUR_EC2_PUBLIC_IP>:8080/swagger-ui.html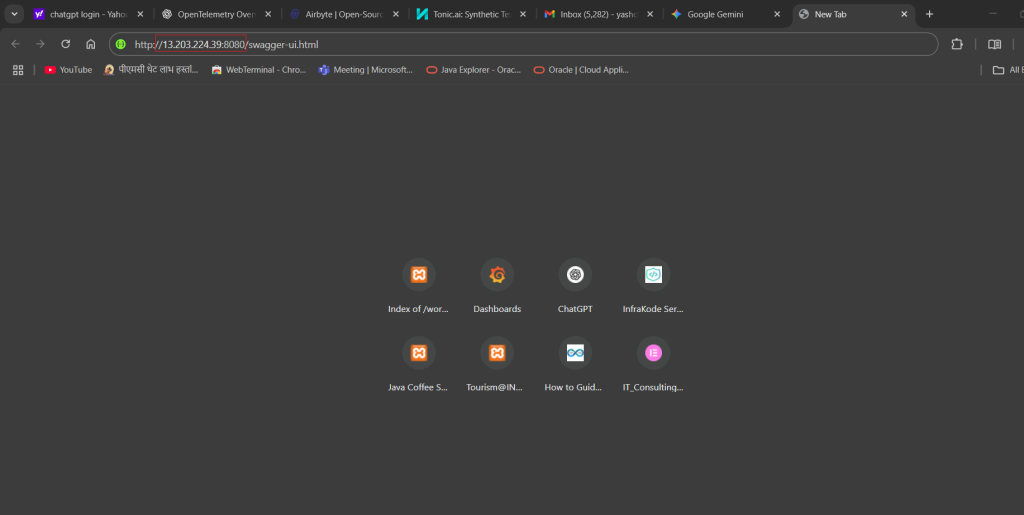
Here the IP address is different, you have to replace it with your IP address. You will see the interface like the below:
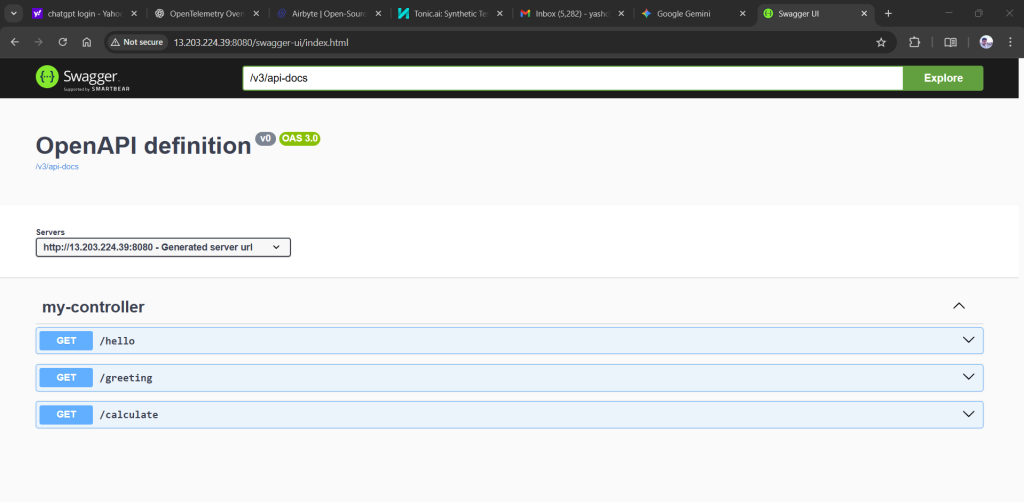
Make API Calls and Observe Responses in Swagger UI:
Once the Swagger UI loads in your browser, you will see a list of your application’s API endpoints. You just need to test those endpoints.
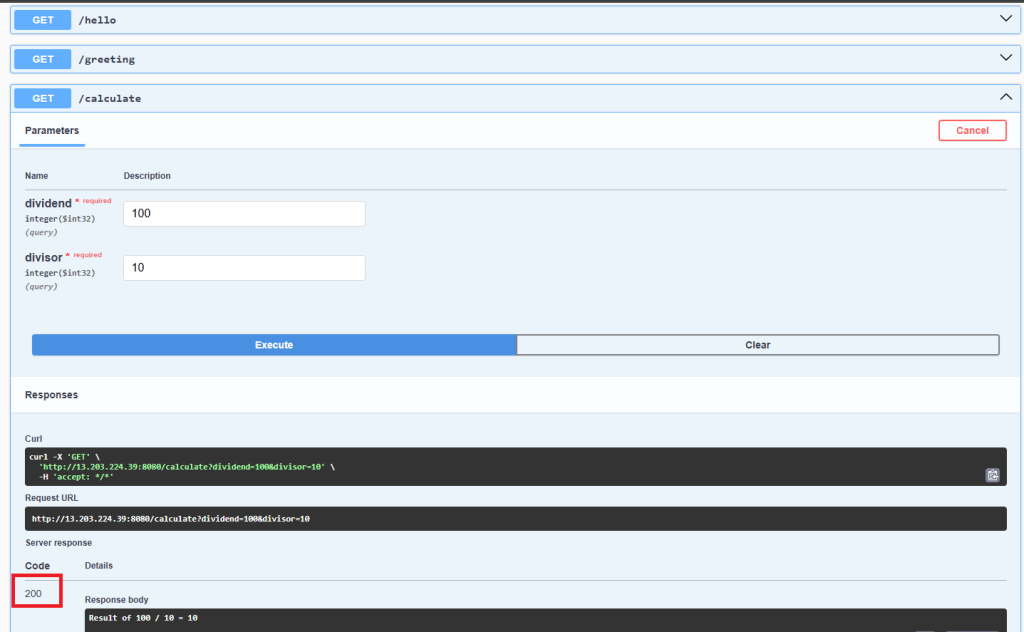
For e.g: Test the /calculate endpoint for a 200 OK (successful calculation) by entering the values. You will see the following output:
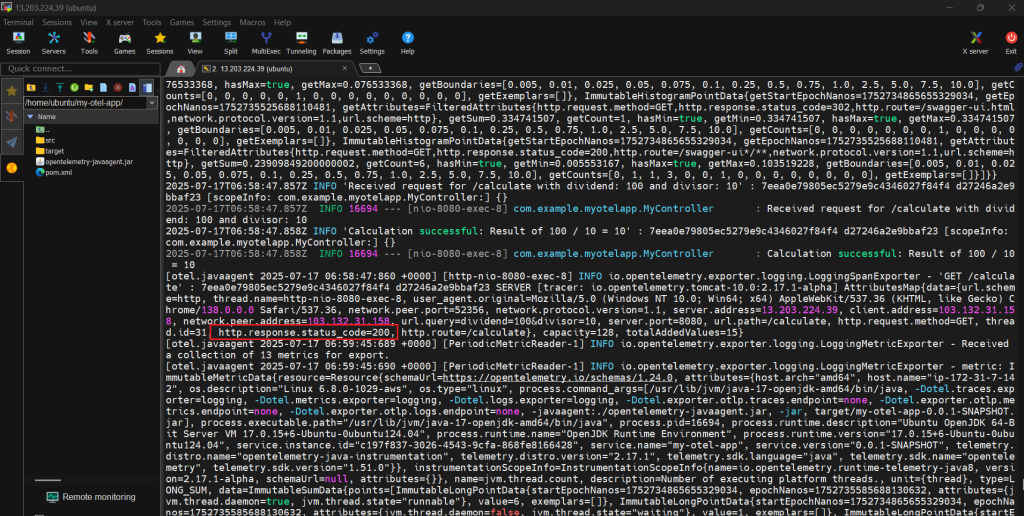
Observe Telemetry in the EC2 Terminal:
Immediately switch back to your terminal where your Spring Boot application is still running. As you make these API calls in your browser, new telemetry data (traces, logs) will stream into the console output. You will be able to see the output like the below:
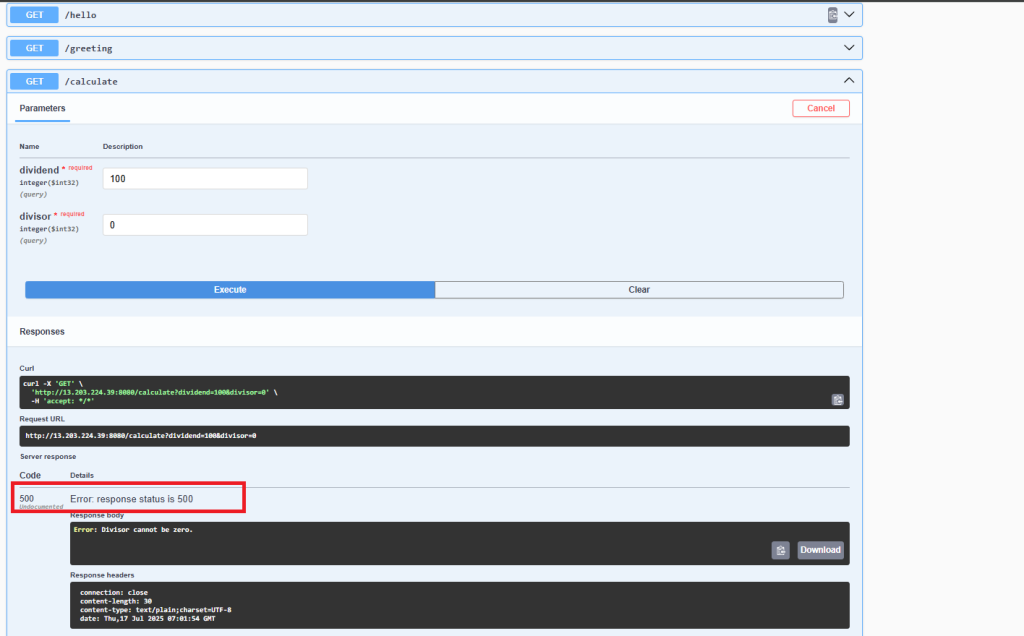
The following output you will be able to see if any error will be occured:

Step #8:Setting up Prometheus to collect metrics from your Spring Boot application through the OpenTelemetry Java Agent.
Stop your running Spring Boot Application by pressing the key Ctrl+C. This step is important because we need to change how the OpenTelemetry agent starts with your application.
Modify and restart Spring Boot Application with Prometheus Exporter by entering the following command:
java -javaagent:./opentelemetry-javaagent.jar \
     -Dotel.traces.exporter=logging \
     -Dotel.metrics.exporter=prometheus \
     -Dotel.exporter.prometheus.port=9464 \
     -Dotel.logs.exporter=logging \
     -jar target/my-otel-app-0.0.1-SNAPSHOT.jar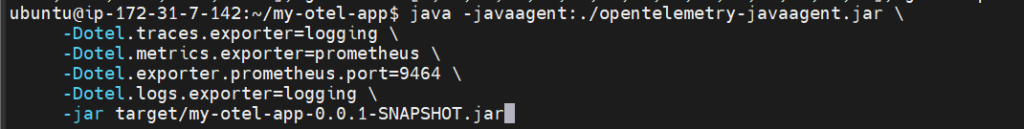
Install Prometheus on EC2:
Open the new terminal or make the duplicate of the tab. Go to the home directory by entering the following command:
cd ~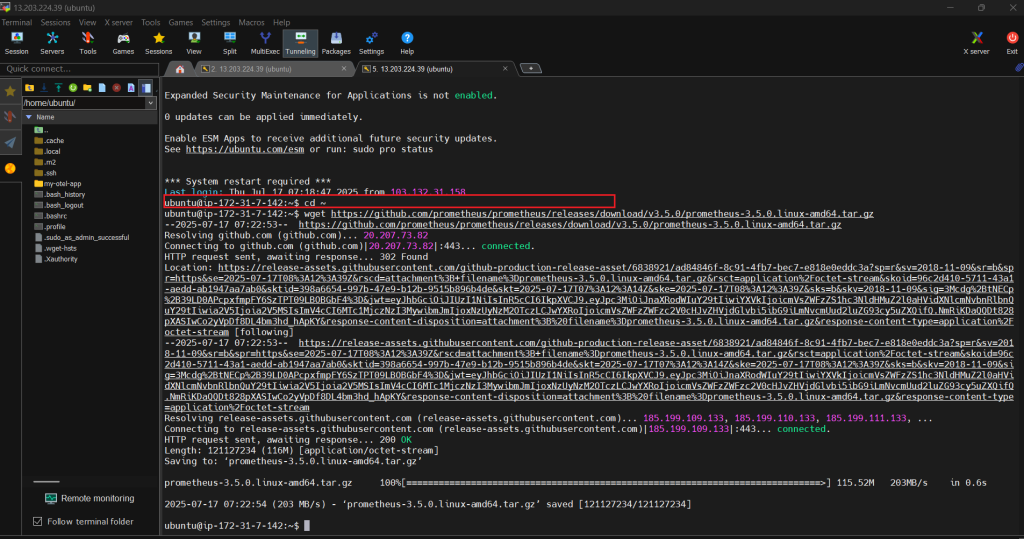
Now we need to download the Prometheus server software. Open your web browser and go to the official Prometheus download page: https://prometheus.io/download/
Look for the linux-amd64 version. It will be a file ending with .tar.gz. Copy its link address and paste it in the terminal, but make sure to add “wget” before the link.
wget https://github.com/prometheus/prometheus/releases/download/v3.5.0/prometheus-3.5.0.linux-amd64.tar.gz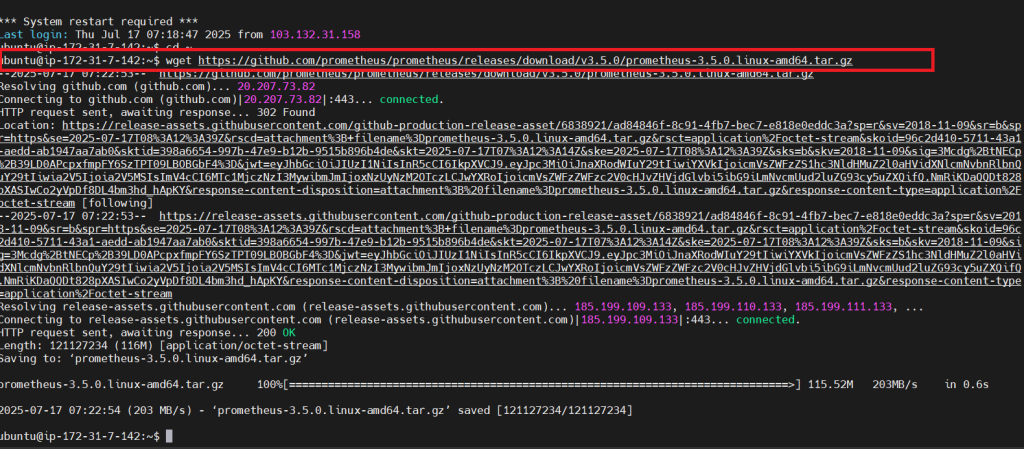
After the download finishes, you need to extract the contents of the downloaded file. In your terminal, type this command and press Enter:
tar -xvf prometheus-3.5.0.linux-amd64.tar.gz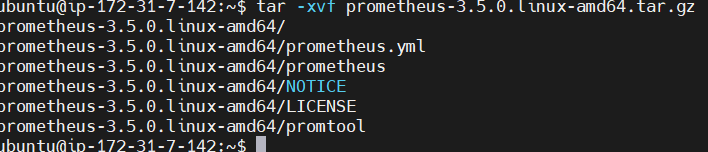
Change into the Prometheus directory by executing the following command:
cd prometheus-3.5.0.linux-amd64/
Run the following command:
nano prometheus.yml
An open editor will open paste the following content inside it:
# ... (there will be other lines above this) ...

# A scrape configuration containing exactly one endpoint to scrape:
# Here it's Prometheus itself.
scrape_configs:
  - job_name: 'prometheus'
    static_configs:
      - targets: ['localhost:9090']

  # --- START OF NEW JOB FOR YOUR SPRING BOOT APP VIA OTEL AGENT ---
  - job_name: 'my-otel-app'
    metrics_path: /metrics # This is the standard path where OTel agent exposes Prometheus metrics
    static_configs:
      - targets: ['localhost:9464'] # This is the port for the OpenTelemetry agent's Prometheus exporter
  # --- END OF NEW JOB ---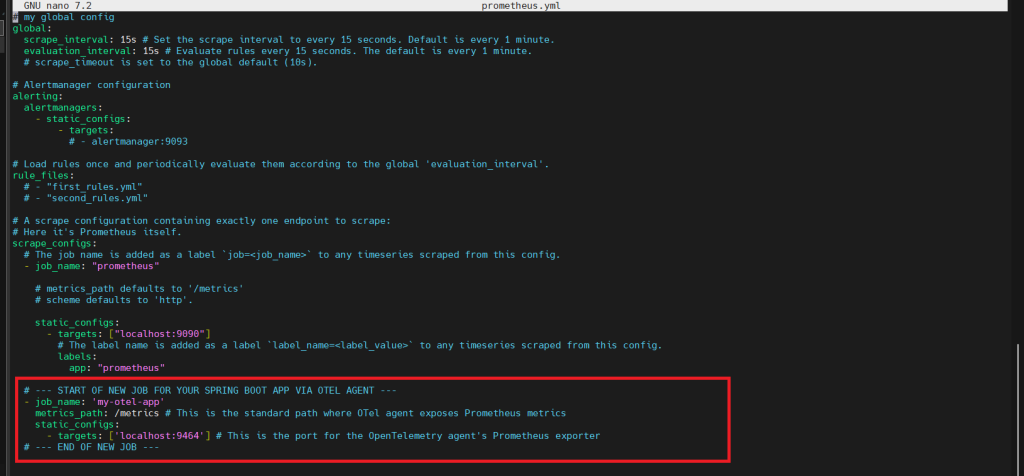
You’ll see a section like this. Don’t change the existing job_name entry. Instead, carefully add a new job below it, exactly as shown.
Save the file by pressing Ctrl+x; it will ask, “Save modified buffer? (Y/N/C)”. Type Y (for Yes). nano will confirm the file name just press the Enter key.
Step #9: Start the Prometheus Server
Start the Prometheus Server by executing the following command in your current terminal:
./prometheus --config.file=prometheus.yml
You should look something like the below:

Now open the new tab in your browser and access Prometheus UI and verify metrics.
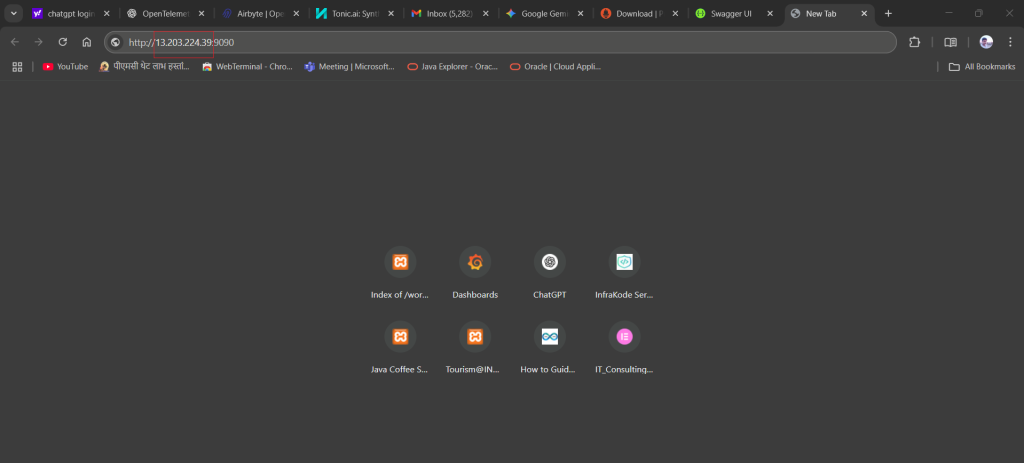
You will see the interface like below:
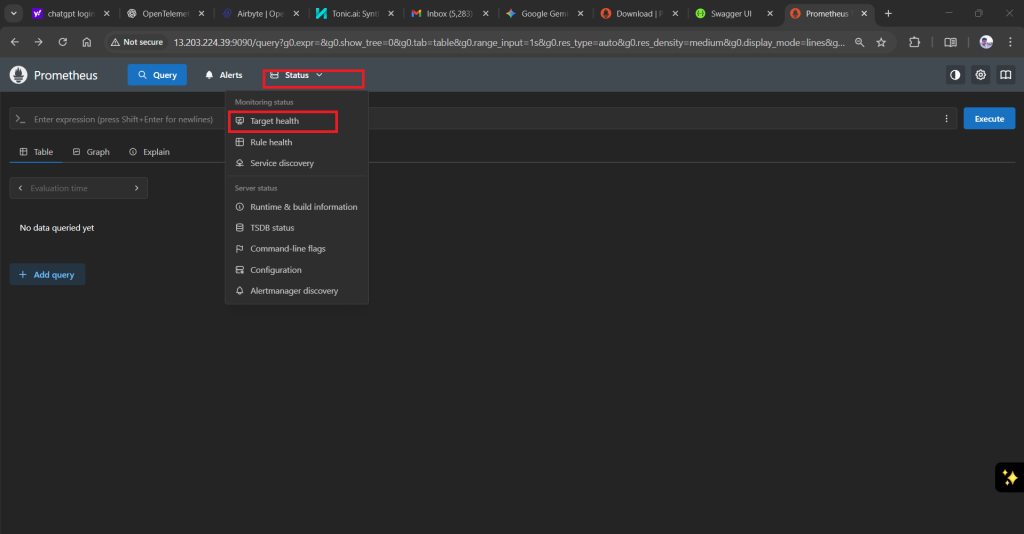
Go to the target health option and see the state is up (it should be in green colour) or not.

Execute the query in the expression box.
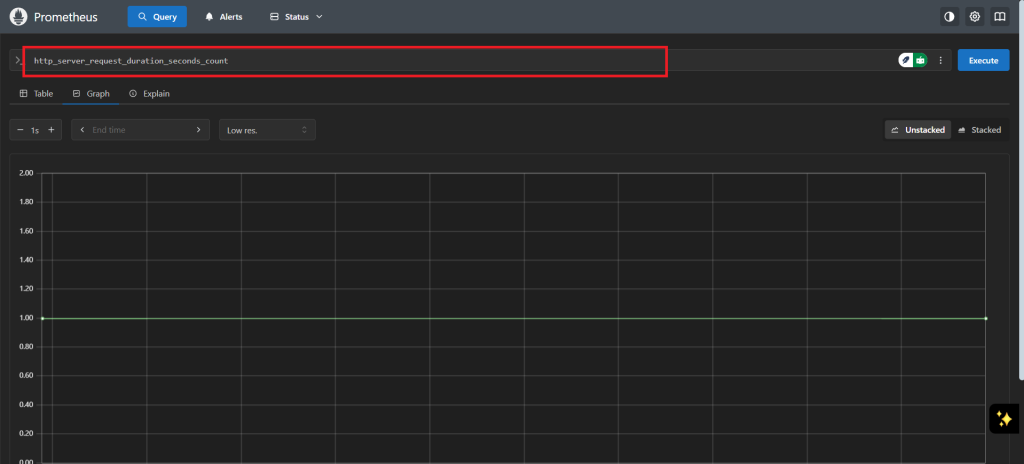
You can make some changes in the swagger and can again check the difference.

Step #10: Adding Grafana
Install Grafana on EC2 by running the following command.
sudo apt-get install -y apt-transport-https software-properties-common wget
Add the Grafana GPG key.
sudo wget -q -O /usr/share/keyrings/grafana.key https://apt.grafana.com/gpg.key
Add the Grafana repository to your APT sources. This tells your system where to find Grafana packages.
echo "deb [signed-by=/usr/share/keyrings/grafana.key] https://apt.grafana.com stable main" | sudo tee /etc/apt/sources.list.d/grafana.list
Update your APT package list by executing the following command:
sudo apt-get update
Install Grafana by executing the following command:
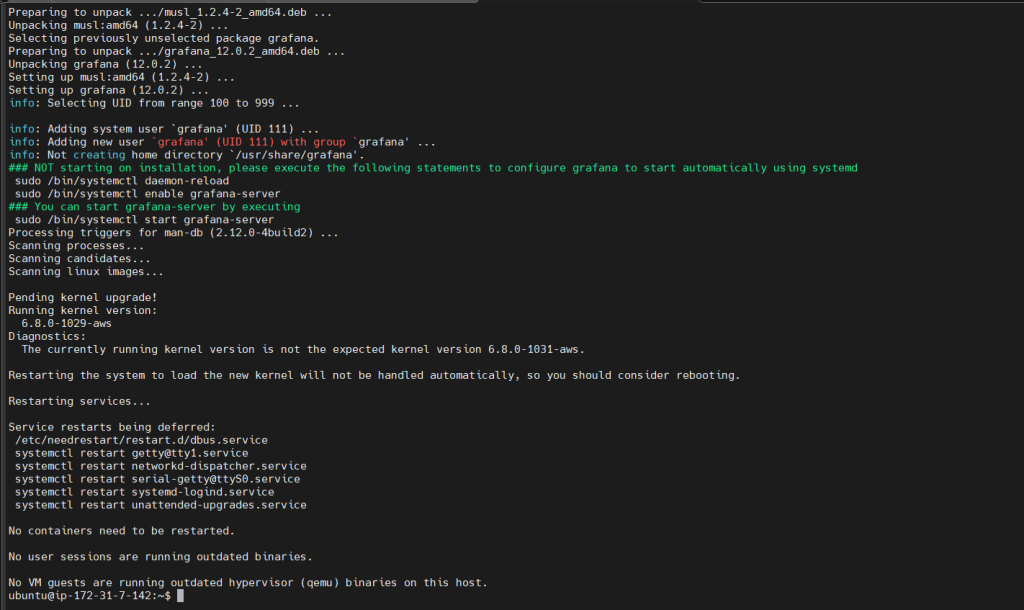
sudo apt-get install grafana -y
You should see the output like below:
Reload the systemd daemon:
sudo systemctl daemon-reload
Enable Grafana to start automatically on boot:
sudo systemctl enable grafana-server
Step 11#:Start the Grafana service
Start the Grafana service by executing the following command.
sudo systemctl start grafana-server
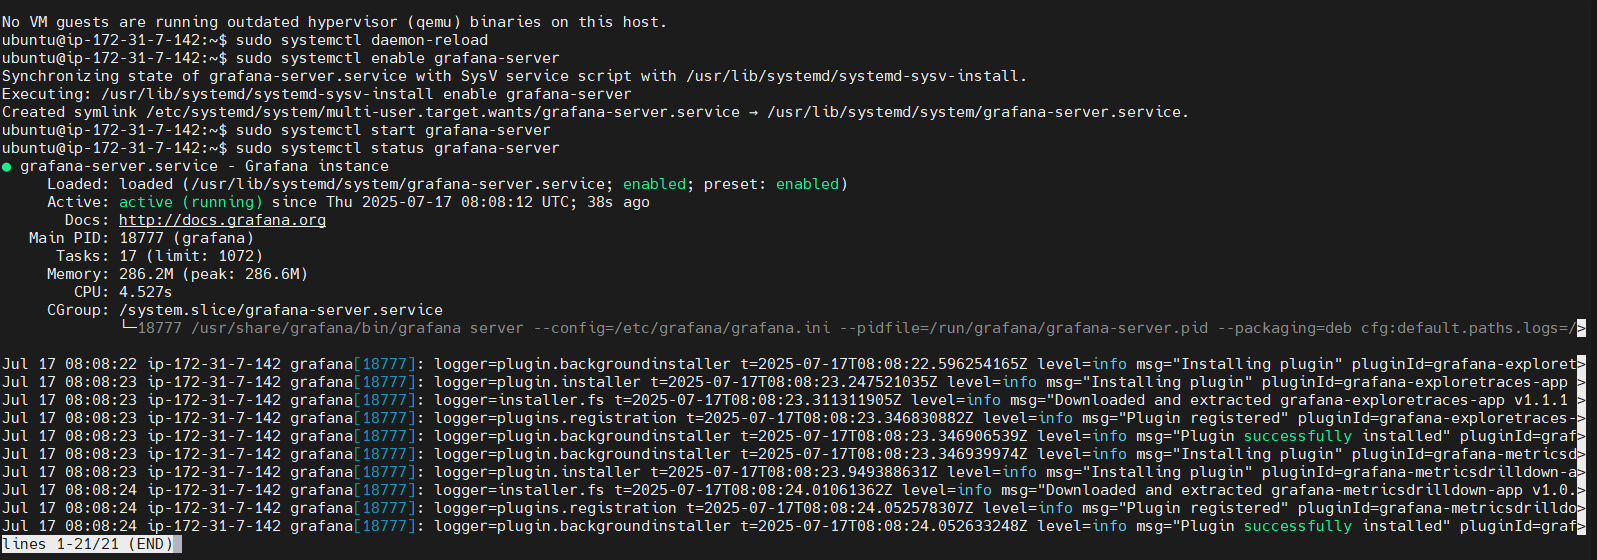
Check the Grafana service status by executing the following command.
sudo systemctl status grafana-server
You should look the output like the below:
Step 12#:Access Grafana UI
Access Grafana UI in your browser. Open a new tab in your web browser and type the following URL
http://YOUR_EC2_PUBLIC_IP:3000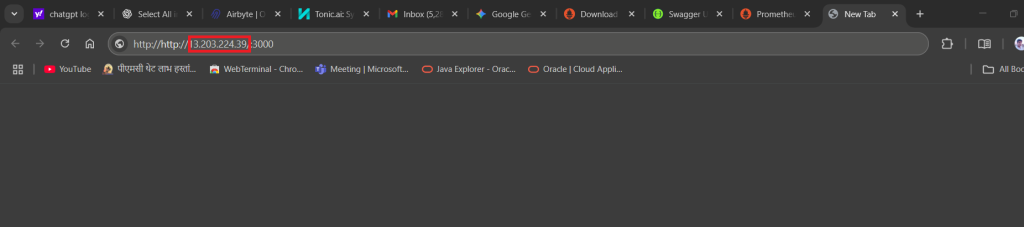
you should see like this.

Enter the username and password as admin which is default.
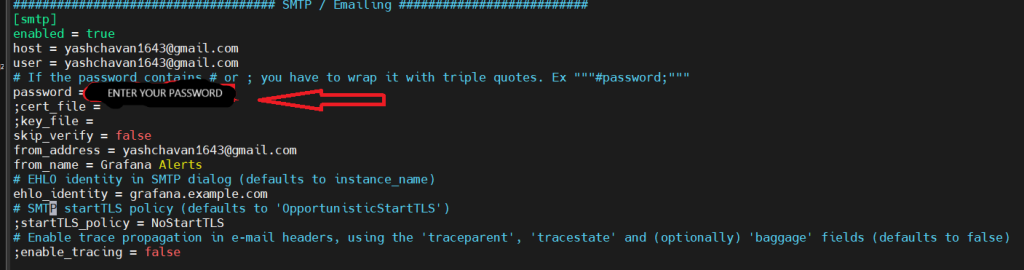
Run the following command:
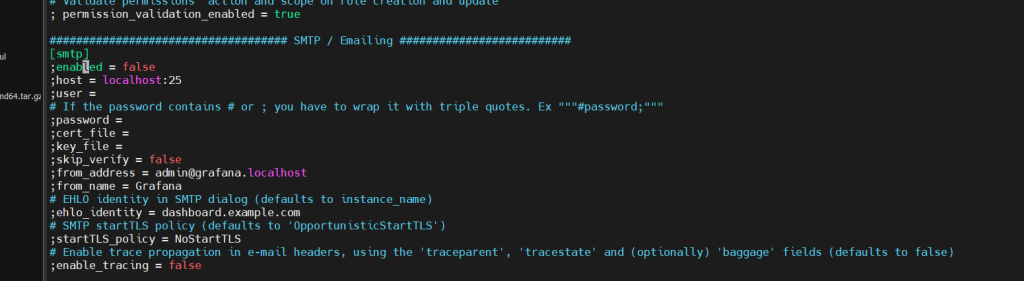
sudo nano /etc/grafana/grafana.ini
Do the following changes:
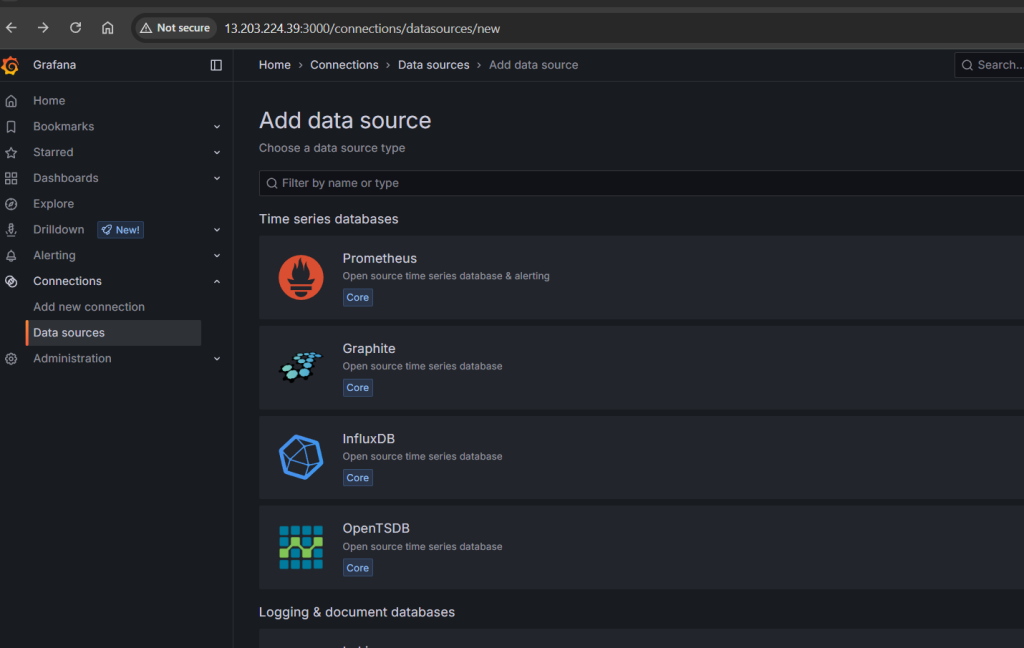
Step 13#:Add the Data Source
Add the data source as Prometheus.
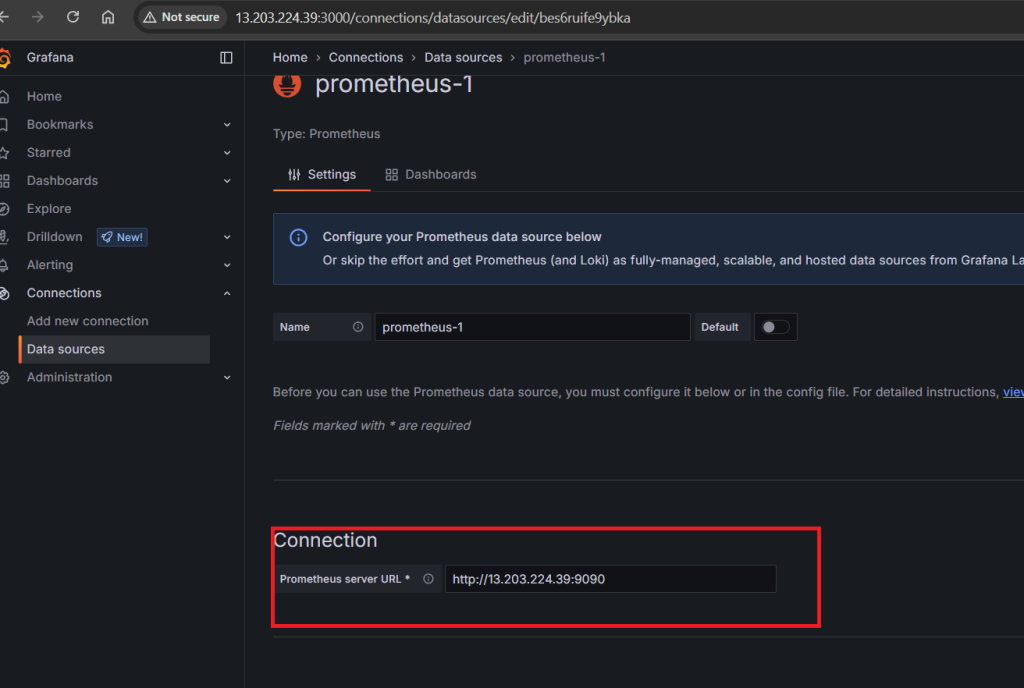
Here add your IP address.
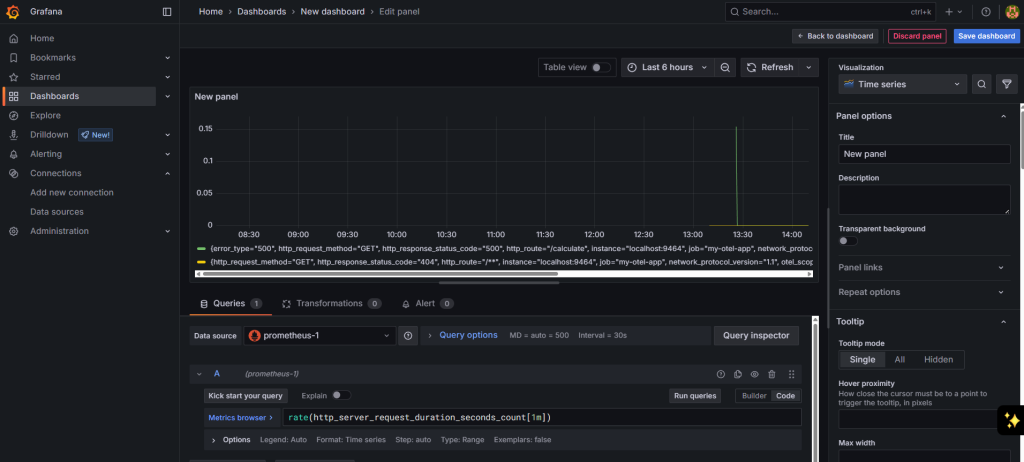
Step 14#:Create the Dashboards
Go to the dashboard section and create the new dashboard.

Run the following command in your terminal:
sudo systemctl restart grafana-server
You will be see the dashboard like the following:
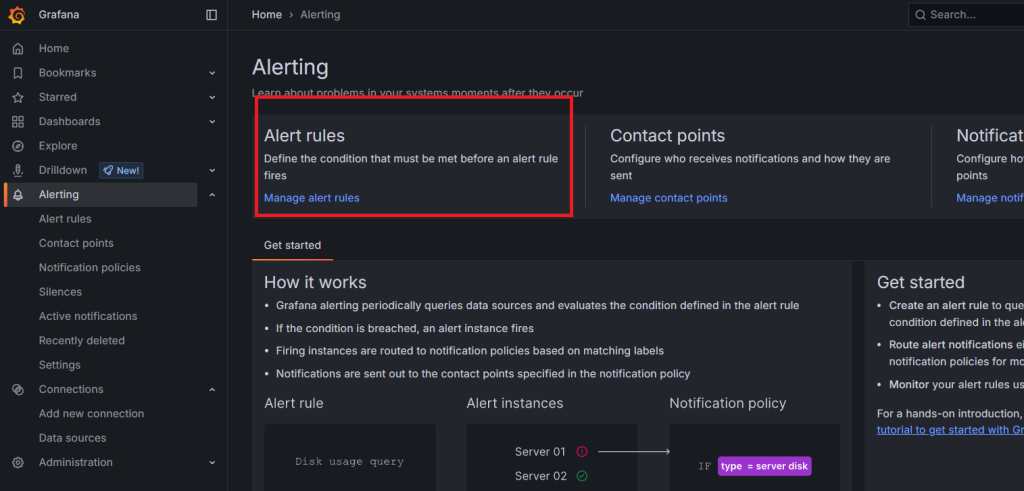
Step 15#:Setting Up the Alerts
Go to the Alerting Section in left side.
Create the new Alert rule and make sure you enter the following query which is there in the image:
rate(http_server_request_duration_seconds_count[1m])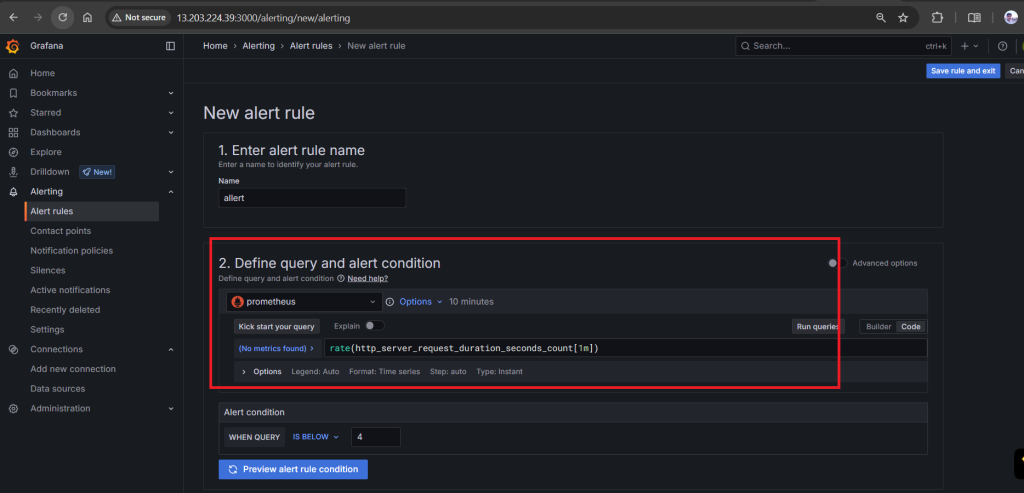
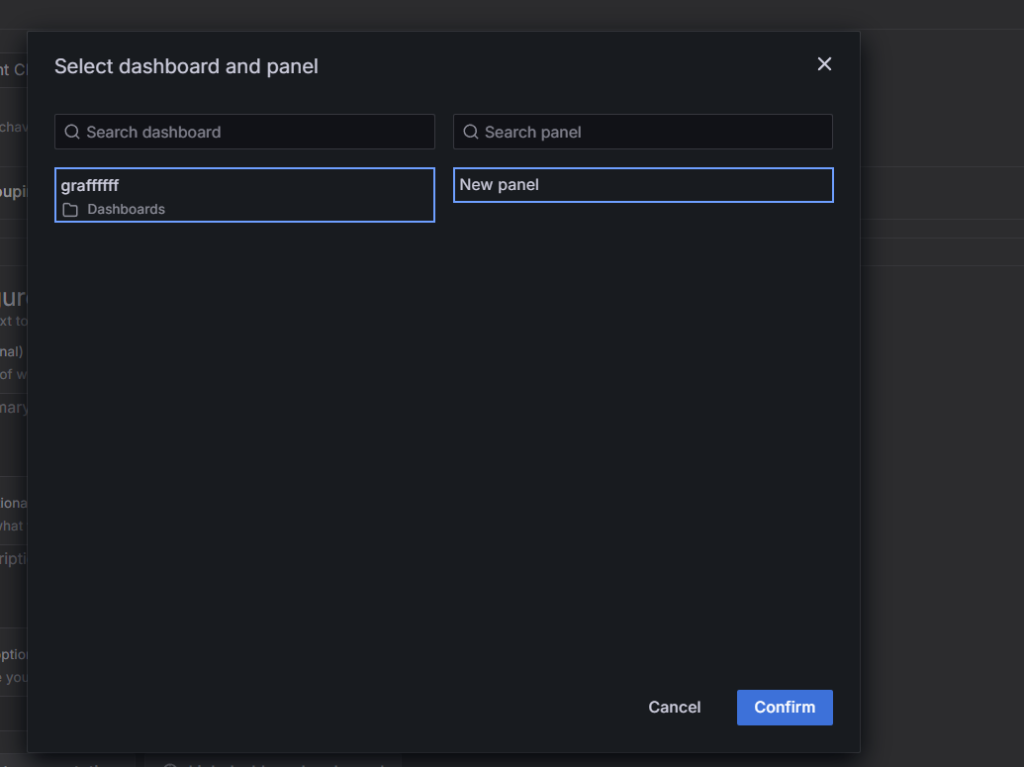
Set up the other things like contact details and the select the dashboard and panel.
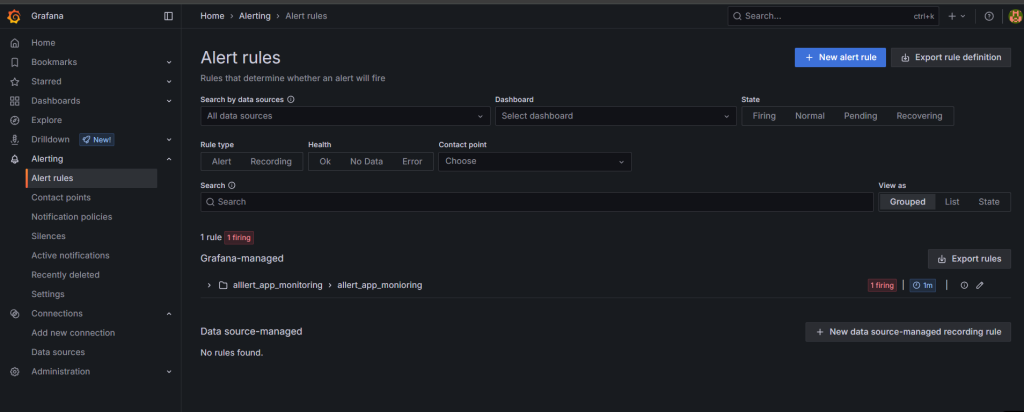
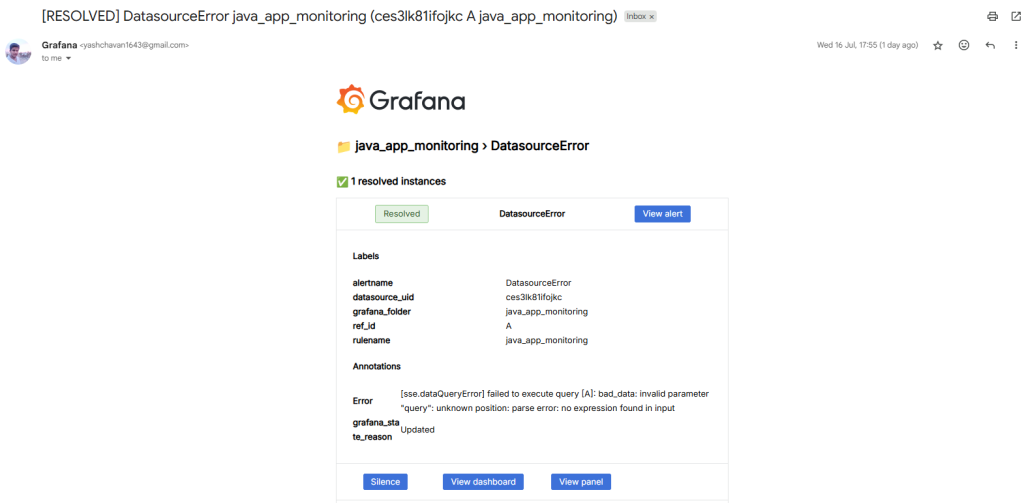
Once done wait for the firing, when the firing is done you will receive an notification through email.
Conclusion:
Combining OpenTelemetry, Prometheus, and Grafana provides a powerful and flexible solution for monitoring 5xx errors in Java APIs. This approach not only helps to detect and visualize failures in real-time but also offers deep insights into application behavior through distributed tracing and metrics. As systems grow in complexity, having this level of observability becomes essential for maintaining performance, reducing downtime, and accelerating debugging.
Related Articles:
Install Spring Boot Application on Ubuntu 24.04 LTS
Reference: