In this article we are going to cover Understanding Prometheus Configuration File.

In this article, we’ll explore the basics of understanding Prometheus configuration, demystifying the process for newcomers to monitoring setups. Let’s uncover how Prometheus configurations work and how they enable effective monitoring of your systems.
Table of Contents
What is Prometheus Configuration File?
The Prometheus configuration file is a YAML-based document that outlines how Prometheus should scrape, collect, and process metrics from various targets. It defines parameters such as scrape intervals, targets to scrape, and rules for alerting, providing the blueprint for effective monitoring setups.
How Prometheus Determines What to Scrape and When?
Prometheus relies on its configuration file to determine what targets to scrape and the frequency at which scraping should occur. This mechanism is essential for maintaining an up-to-date view of the system’s health and performance. Here’s how Prometheus accomplishes this:
- Static Configuration:
- In the Prometheus configuration file, administrators can statically define targets that Prometheus should scrape.
- These targets include endpoints where applications or services expose metrics, typically over HTTP.
- Static configurations explicitly list the targets and associated job names, allowing for straightforward management and monitoring.
- Service Discovery:
- Prometheus supports various service discovery mechanisms, such as DNS, Kubernetes, Consul, EC2, and more.
- Service discovery enables Prometheus to dynamically discover targets based on predefined rules and configurations.
- For example, in a Kubernetes environment, Prometheus can automatically discover and scrape pods labeled with specific annotations or running in predefined namespaces.
- Scrape Interval:
- The scrape_interval parameter in the global configuration section determines how frequently Prometheus should scrape targets.
- Administrators can adjust this interval based on the desired level of granularity and resource utilization.
- Shorter intervals provide more frequent updates but may increase resource consumption, while longer intervals reduce overhead but offer less real-time visibility.
- Job Configuration:
- Each job defined in the Prometheus configuration file specifies a set of targets to scrape and the associated scraping parameters.
- Job configurations include the job_name, metrics_path (if different from the default), static_configs (for static target definitions), and scrape_interval.
- By organizing targets into logical groups (jobs), administrators can manage and monitor distinct components or services effectively.
- Relabeling and Target Filtering:
- Prometheus allows administrators to apply relabeling configurations to manipulate target labels before scraping.
- Relabeling rules can filter out irrelevant targets, modify labels for consistency, or route targets to specific endpoints.
- This capability enhances flexibility and control over the scraping process, ensuring that only relevant metrics are collected and stored.
By combining static configurations, service discovery mechanisms, and scraping parameters, Prometheus dynamically determines what targets to scrape and when to scrape them.
Prerequisites
To follow this tutorial, you will need:
- AWS Ubuntu 22.04 LTS Instance.
- User with sudo access (see the Initial Server Setup with Ubuntu 22.04 tutorial for details).
- Install Prometheus on Ubuntu Server and Enable Port:9090
Understanding Default Prometheus Configuration File
The default prometheus.yml file serves as the main configuration file for Prometheus, defining how Prometheus should scrape, collect, and process metrics from various targets within your infrastructure.
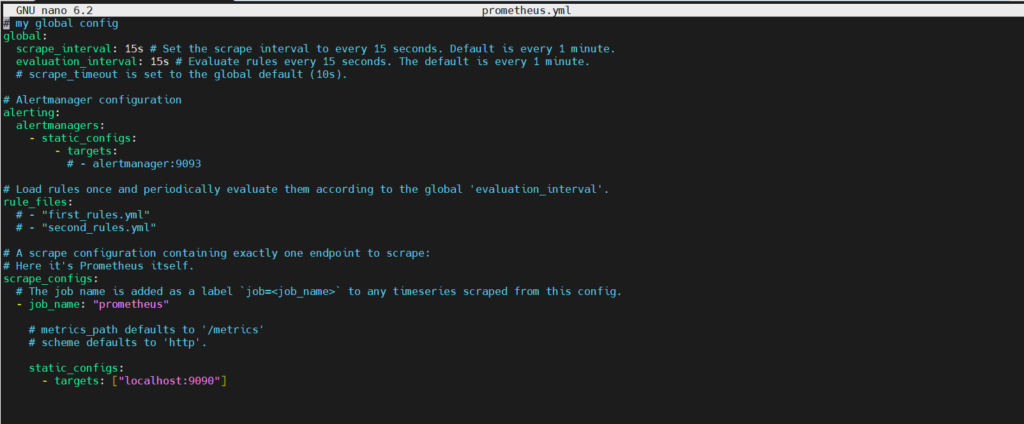
Let’s break down the configuration provided in the prometheus.yml file:
1]Global Configuration in Prometheus
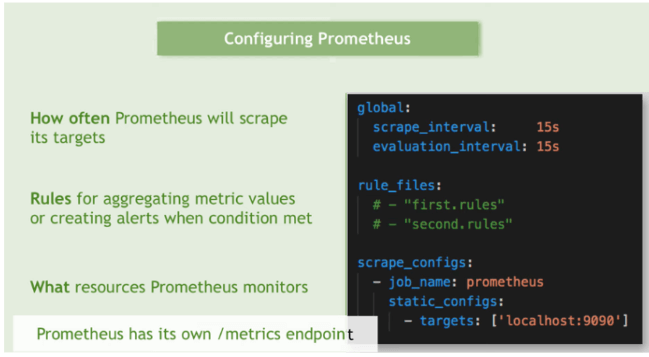
The global section sets configurations that apply universally across Prometheus:
global: scrape_interval: 15s evaluation_interval: 15s
- scrape_interval: This parameter determines how frequently Prometheus will scrape targets for metrics. In this case, it’s set to 15 seconds, meaning Prometheus will collect metrics from configured targets every 15 seconds.
- evaluation_interval: This parameter specifies the interval at which Prometheus evaluates rules and generates alerts. It’s also set to 15 seconds in this configuration.
2]Alertmanager Configuration in Prometheus
The alerting section configures how Prometheus communicates with Alertmanager:
alerting:
  alertmanagers:
    - static_configs:
        - targets:
- alertmanagers: This defines a list of Alertmanager instances that Prometheus can send alerts to.
- static_configs: This specifies static configurations for Alertmanager targets. However, in the provided configuration, there are no targets specified.
3]Rule Files in Prometheus
The rule_files section defines which rule files Prometheus should load and periodically evaluate:
rule_files:
  # - "first_rules.yml"
  # - "second_rules.yml"
This section is currently commented out (lines start with #), meaning no rule files are being loaded at the moment. Rule files contain alerting and recording rules written in Prometheus Query Language (PromQL).
4]Scrape Configurations in Prometheus
The scrape_configs section defines targets that Prometheus will scrape for metrics:
scrape_configs:
  - job_name: "prometheus"
    static_configs:
      - targets: ["localhost:9090"]
- job_name: Specifies a label that Prometheus will attach to scraped metrics, allowing for easier identification and filtering.
- static_configs: Indicates that the targets are statically defined within the configuration file.
- targets: Specifies the endpoints (in this case, localhost:9090) from which Prometheus will scrape metrics. localhost:9090 is the default address where the Prometheus server itself exposes its metrics.
Different Prometheus Configuration file types and it uses
Prometheus configuration files can vary significantly based on the requirements of the monitoring environment and the complexity of the infrastructure being monitored. Here are several types of Prometheus configuration files and their common uses:
- Basic Configuration File:
- Use: Basic configuration files include essential settings such as scrape intervals, targets, and basic alerting configurations.
- Example Use Case: Setting up Prometheus to monitor a single application or service with straightforward metrics.
- Advanced Configuration File:
- Use: Advanced configuration files incorporate additional features like relabeling, custom service discovery, and federation configurations for scalability.
- Example Use Case: Monitoring complex environments with multiple services, microservices, and diverse metric endpoints.
- High Availability Configuration File:
- Use: High availability configuration files configure Prometheus in a redundant, highly available mode using clustering mechanisms.
- Example Use Case: Ensuring continuous monitoring and minimal downtime for critical systems by deploying Prometheus in a high availability setup.
- Cloud-Native Configuration File:
- Use: Cloud-native configuration files leverage service discovery mechanisms specific to cloud platforms like AWS, GCP, or Azure.
- Example Use Case: Monitoring services deployed in cloud environments with dynamic infrastructure using cloud-specific service discovery mechanisms.
- Microservices Configuration File:
- Use: Microservices configuration files are structured to monitor numerous small services, often using dynamic service discovery and label-based routing.
- Example Use Case: Monitoring a microservices architecture where services are frequently added, removed, or scaled dynamically.
- Scalable Configuration File:
- Use: Scalable configuration files include federation setups, sharding strategies, and remote storage configurations to handle large volumes of metrics data.
- Example Use Case: Scaling Prometheus to monitor extensive infrastructures across multiple regions or data centers.
- Security Configuration File:
- Use: Security-focused configuration files enable TLS encryption, authentication mechanisms, and access control lists to secure Prometheus endpoints and communication channels.
- Example Use Case: Ensuring data privacy and integrity in production environments by securing Prometheus communication and access.
- Custom Configuration File:
- Use: Custom configuration files are tailored to specific monitoring requirements, incorporating unique features, integrations, and best practices relevant to the organization’s infrastructure and applications.
- Example Use Case: Implementing specialized monitoring setups for specific industries, compliance requirements, or proprietary systems.
Each type of Prometheus configuration file serves a distinct purpose and can be customized and combined to meet the monitoring needs of different environments, from small-scale deployments to large, distributed systems.
Placeholder types in Prometheus Configuration
To specify which configuration file to load, use the –config.file flag.
The file is written in YAML format, defined by the scheme described below. Brackets indicate that a parameter is optional. For non-list parameters the value is set to the specified default.
Generic placeholders are defined as follows:
<boolean>: a boolean that can take the valuestrueorfalse<duration>: a duration matching the regular expression((([0-9]+)y)?(([0-9]+)w)?(([0-9]+)d)?(([0-9]+)h)?(([0-9]+)m)?(([0-9]+)s)?(([0-9]+)ms)?|0), e.g.1d,1h30m,5m,10s<filename>: a valid path in the current working directory<float>: a floating-point number<host>: a valid string consisting of a hostname or IP followed by an optional port number<int>: an integer value<labelname>: a string matching the regular expression[a-zA-Z_][a-zA-Z0-9_]*. Any other unsupported character in the source label should be converted to an underscore. For example, the labelapp.kubernetes.io/nameshould be written asapp_kubernetes_io_name.<labelvalue>: a string of unicode characters<path>: a valid URL path<scheme>: a string that can take the valueshttporhttps<secret>: a regular string that is a secret, such as a password<string>: a regular string<size>: a size in bytes, e.g.512MB. A unit is required. Supported units: B, KB, MB, GB, TB, PB, EB.<tmpl_string>: a string which is template-expanded before usage
A valid example file can be found Prometheus official GitHub Repo
# my global config
global:
  scrape_interval: 15s # Set the scrape interval to every 15 seconds. Default is every 1 minute.

  evaluation_interval: 15s # Evaluate rules every 15 seconds. The default is every 1 minute.

  # scrape_timeout is set to the global default (10s).

  is_enabled: true  # Placeholder for a boolean value
  # Placeholder for duration
  my_duration: 1h30m

  my_file: data.txt

  my_threshold: 0.75

  # Placeholder for an integer value
  my_replicas: 3

  # Placeholder for a URL path
  my_path: /metrics

 # Placeholder for a URL scheme
  my_scheme: http


  # Placeholder for a secret
  my_secret: "my_secret_password123"

  # Placeholder for a size in bytes
  my_size: 512MB

  # Placeholder for a template-expanded string
  my_tmpl_string: "metric_${job_name}_status"


# Alertmanager configuration
alerting:
  alertmanagers:
    - static_configs:
        - targets:
          # - alertmanager:9093

# Load rules once and periodically evaluate them according to the global 'evaluation_interval'.
rule_files:
  # - "first_rules.yml"
  # - "second_rules.yml"
    - "${data.txt}"
# A scrape configuration containing exactly one endpoint to scrape:
# Here it's Prometheus itself.
scrape_configs:
  # The job name is added as a label `job=<job_name>` to any timeseries scraped from this config.
  - job_name: "prometheus"

    # metrics_path defaults to '/metrics'
    # scheme defaults to 'http'.

    static_configs:
      - targets: ["${scheme}://13.235.80.11:9090"]


    # Set URL path for scraping metrics
    metrics_path: ${path}

    # Set the number of replicas
    replicas: ${int}
    threshold: ${float}
    scheme: ${scheme}

    # Use secret for authentication
    password: ${secret}


   # Set maximum file size for scraping
    max_file_size: ${size}


   # Use template-expanded string for metric name
    metric_name: ${tmpl_string}
These placeholders provide a clear and structured way to define various types of values and parameters within a Prometheus configuration file. They ensure consistency and help users understand the expected format and data types for different configuration options.
Best Practices for Prometheus Configuration Files
- Modularization:
- Break down configuration into manageable chunks using separate files for different components or environments.
- Use tooling like docker-compose or configuration management tools for effective management.
- Version Control:
- Store Prometheus configuration files in version control systems like Git for tracking changes and enabling collaboration.
- Documentation:
- Maintain detailed documentation alongside configuration files to facilitate understanding and troubleshooting.
- Testing and Validation:
- Utilize Prometheus’s built-in configuration testing capabilities to ensure correctness and reliability.
Advanced Features and Use Cases
- Remote Write and Remote Read:
- Enable Prometheus to ingest and query data from external storage systems like Thanos or Cortex.
- Alerting Rules:
- Define alerting rules within Prometheus configuration files to trigger alerts based on predefined conditions.
- Federation:
- Aggregate metrics from multiple Prometheus instances using federation, allowing centralized monitoring across distributed environments.
Conclusion:
In conclusion, understanding Prometheus configuration is fundamental for setting up effective monitoring systems. With the basics covered, beginners can navigate Prometheus configuration files with confidence, customizing monitoring environments to suit their specific needs.
Related Articles:
How to Install Prometheus on Ubuntu 22.04 LTS
Secure Grafana with Nginx, Reverse Proxy and Certbot
Reference: