In this article we are going to cover Vectors in Prometheus with Examples, What are vectors in Prometheus, Instant and Range vector in prometheus with examples.
Table of Contents
What are Vectors in Prometheus?
In Prometheus, a vector is a fundamental concept used to represent sets of related time series. It’s like a container holding multiple time series, each tracking a specific aspect of a metric.
In a simple sentence “a set of related timeseries is called a vector“, all data is in the context of some timestamp. The series that maps a timestamp to recorded data is called a timeseries
Types of Vectors in Prometheus
There are two main types of vectors in Prometheus
1:Instant Vector in Prometheus
An instant vector in Prometheus represents a set of time series, each containing a single data point with the same timestamp. This means it captures the current state of various metrics at a specific moment in time.
Below are some key point about Instant Vector in Prometheus
- Represent a single snapshot of data at a specific timestamp.
- Useful for monitoring current values like system stats, resource usage, etc.
- Use case: Capture the current state of metrics like system stats, resource usage, etc.
- Display: Often shown in graphs with a static time range (e.g., last 5 minutes).
- Cannot: Cannot show trends over time; use range vectors for that.
up: Indicates whether a target is currently reachable (1) or not (0). - You can directly select a metric name to get an instant vector. Use label selectors to filter specific time series within the vector. PromQL functions like
count(),min(),max(), etc., can be applied to instant vectors for aggregation.
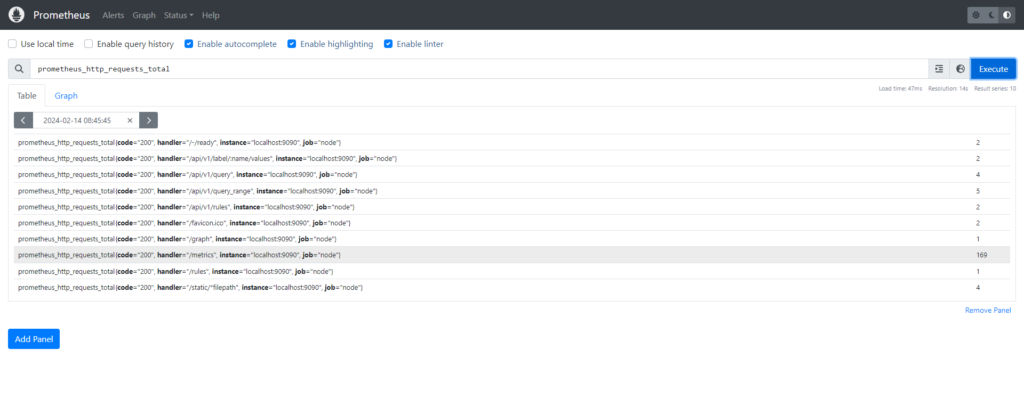
Examples: http_requests_total, up.
prometheus_http_requests_total: Shows the total number of HTTP requests received by each endpoint at the moment.
prometheus_http_requests_total
While instant vectors themselves only represent a single data point across all series at a specific timestamp, several functions can be applied to manipulate and analyze them. Here’s an overview:
Aggregation Functions in Instant Vector:
- These functions summarize an entire instant vector into a single value:
count(): Calculates the total number of series in the vector.min(): Returns the minimum value across all series.max(): Returns the maximum value across all series.avg(): Calculates the average value across all series.sum(): Returns the sum of all values across all series.stddev(): Calculates the standard deviation of values across all series (note: requires native histograms).stdvar(): Calculates the population variance of values across all series (note: requires native histograms).
Comparison Operators in Instant Vector:
- These operators compare values between two instant vectors element-wise, resulting in an instant vector with boolean (true/false) values:
>,<,>=,<=,==,!=
Arithmetic Operators in Instant Vector:
- These operators perform calculations between two instant vectors element-wise, resulting in an instant vector with numerical values:
+,-,*,/
Label Operations in instant vector:
- Functions like
label_replace()andlabel_join()modify the label sets of series within an instant vector.
Other Notable Functions in intant vector:
abs(): Returns the absolute value of each element in the vector.ceil(): Rounds each element up to the nearest integer.floor(): Rounds each element down to the nearest integer.exp(): Calculates the mathematical exponent of each element.ln(): Calculates the natural logarithm of each element.
Some points to keep Remember in instant vector:
- Instant vector functions operate on the current snapshot of data.
- For analyzing trends and changes over time, use range vectors and functions like
rate()andincrease().
2:Range Vector in Prometheus:
Range Vector in Prometheus Represent a set of time series with a range of data points over time for each series.
- Used to visualize trends, calculate rates, and perform aggregations over time.
- Use case: Show trends and changes in metrics over time intervals.
- Display: Often used in graphs with a specified time range (e.g., last hour).
- Can: Show trends and be used with functions like
rate()andincrease()to analyze changes over time. - Range vector queries specify a time duration in square brackets
- Both types of vectors can be filtered using label selectors.
- Examples: rate(prometheus_http_requests_total{code=”200″}[5m]) – will calculate the rate of successful HTTP requests (status code 200) over the past 5 minutes.
rate(prometheus_http_requests_total{code="200"}[5m])

Average CPU usage in percentage [0 … 100]% per each node for the last 5 minutes:
100 * avg(1 - rate(node_cpu_seconds_total{mode="idle"}[5m])) by (instance)

Below are some Range vector functions in Prometheus
changes(range-vector)absent_over_time(range-vector)delta(range-vector)deriv(range-vector)holt_winters(range-vector, scalar, scalar)idelta(range-vector)irate(range-vector)predict_linear(range-vector, scalar)rate(range-vector)resets(range-vector)avg_over_time(range-vector)min_over_time(range-vector)max_over_time(range-vector)sum_over_time(range-vector)count_over_time(range-vector)quantile_over_time(scalar, range-vector)stddev_over_time(range-vector)stdvar_over_time(range-vector)
Difference between Instant and Range Vector in Prometheus
| Features | Instant Vector | Range Vector |
| Data points | Single data point at a specific timestamp | Multiple data points over a time interval |
| Use case | Current state monitoring | Trend analysis, aggregation, rate calculations |
| Charting | Suitable for static time ranges (e.g., last 5 minutes) | Shows data points over time |
| Display | Static time range graphs | Time range graphs with trend lines |
| PromQL functions | count(), min(), max() | rate(), increase(), etc. |
Conclusion:
In this article we have covered Vectors in Prometheus with Examples, What are vectors in Prometheus, Instant and Range vector in prometheus with examples.
Related Articles:
Prometheus Tutorial for Beginners
Reference: