In this article, we delve into the intricacies of Prometheus recording rules, exploring their significance and syntax to optimize monitoring configurations. Understanding recording rules is key to enhancing query performance and scalability in Prometheus deployments.
Table of Contents
Types of Rules in Prometheus
Prometheus supports two primary types of rules that can be configured and evaluated periodically:
Recording Rules: Recording rules are designed for pre-calculating frequently used or computationally intensive queries. The outcomes of these rules are stored as separate time series data, enhancing query efficiency.
Example: A recording rule could compute the average response time of an API endpoint over a specific time window. This pre-calculated metric can then be readily queried for analysis or incorporated into dashboards.
Alerting Rules: Alerting rules enable users to define conditions that trigger alerts to external services such as Slack, based on PromQL queries. These rules help monitor systems and respond promptly to anomalous conditions or thresholds.
Example: An alerting rule might specify that if the CPU usage of a server exceeds 90% for more than 5 minutes, an alert should be sent to the operations team via Slack, indicating a potential performance issue.
What are Recording Rules in Prometheus?
Prometheus recording rules are pre-defined expressions written in PromQL (Prometheus Query Language) that compute complex aggregations, transformations, or filters over raw time series data. These rules allow users to create new time series data from existing metrics, optimizing query performance and enabling efficient monitoring and alerting.
For example, a recording rule might compute the 5-minute moving average of CPU usage across multiple servers, simplifying querying and analysis tasks.
Why to use Rules in Prometheus?
Rules in Prometheus are used to precompute and organize metrics, optimizing query performance and facilitating advanced monitoring and alerting capabilities. They enable users to define complex computations, aggregations, or transformations on raw time series data, improving efficiency and scalability in monitoring setups.
For example,
100 - (100 * node_memory_MemFree_bytes / node_memory_MemTotal_bytes)
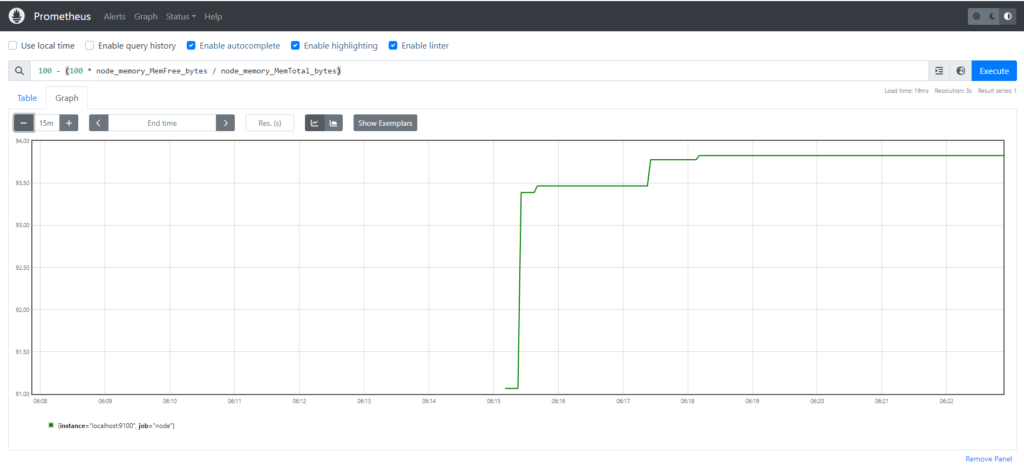
This is quite useful as it describes the percentage of available memory on a server monitored by the Prometheus Node Exporter. Instead of manually typing this query each time we need this information, we can establish a recording rule. This rule executes at specified intervals, computing the data and storing it as a time series, making it readily accessible for analysis and alerting.
Rule File Components in Prometheus
A rule file uses the following basic template:
groups:
  - name:
  rules:
  - alert:
  expr:
  for:
  labels:
annotations:- Groups: A collection of rules that are run sequentially at a regular interval
- Name: Name of group
- Rules: The rules in the group
- Alert: A valid label name
- Expr: The condition required for the alert to trigger
- For: The minimum duration for an alert’s expression to be true (active) before updating to a firing status
- Labels: Any additional labels attached to the alert
- Annotations: A way to communicate actionable or contextual information such as a description or runbook link
Best Practices for Prometheus Recording Rules
To leverage recording rules effectively and maintain a robust monitoring infrastructure, consider the following best practices:
- Keep Rules Simple and Specific: Write recording rules that encapsulate specific metrics or computations. Complex rules may hinder readability and performance.
- Optimize Expressions: Ensure that recording rules are optimized to minimize computational overhead. Utilize PromQL functions judiciously and avoid unnecessary aggregations.
- Use Labels Wisely: Leverage labels to differentiate and categorize time series data effectively. Incorporate labels in recording rules to enhance query granularity and facilitate targeted alerting.
- Regularly Review and Refactor Rules: Periodically review existing recording rules to identify potential optimizations or obsolete rules. Refactor rules as necessary to align with evolving monitoring requirements and best practices.
- Document Rules and Intentions: Document each recording rule comprehensively, outlining its purpose, inputs, and expected outputs. Clear documentation facilitates collaboration and ensures the maintainability of monitoring configurations.
- Test and Validate Rules: Test recording rules in a staging or development environment to validate their correctness and performance impact. Monitor rule execution and refine as needed before deploying to production.
Prerequisites
To follow this tutorial, you will need:
- 2 AWS Ubuntu 22.04 LTS Instance.
- User with sudo access (see the Initial Server Setup with Ubuntu 22.04 tutorial for details).
- Install Prometheus and Node Exporter on Ubuntu Server and Enable Port:9090 & 9100
Steps to add Recording rules in Prometheus
Step#1:Create prometheus.myrule.yml File
You can create prometheus.myrule.yml file in the same directory where prometheus.yml is stored, e.g.
sudo nano /etc/prometheus/prometheus.myrule.yml
groups:
  - name: custom_rules
    rules:
      - record: node_memory_MemFree_percent
        expr: 100 - (100 * node_memory_MemFree_bytes / node_memory_MemTotal_bytes)
Let’s break down the configuration in detail:
- Group Name: custom_rules: This is the name of the group that contains a set of custom rules. It’s likely used in a monitoring or metric system to define specific behaviors or calculations.
- Rules:
- Record Name: node_memory_MemFree_percent: This represents a record or metric name. It’s likely used to store or represent the percentage of free memory on a system node.
- Expression: The expression is a mathematical formula used to calculate the percentage of free memory. It’s represented using the following formula:\text{Percentage of Free Memory} = 100 – \left( \frac{100 \times \text{node_memory_MemFree_bytes}}{\text{node_memory_MemTotal_bytes}} \right)
- node_memory_MemFree_bytes: This represents the amount of free memory available on the node, measured in bytes.
- node_memory_MemTotal_bytes: This represents the total amount of memory available on the node, measured in bytes.
The expression computes the percentage of free memory by first calculating the ratio of free memory to total memory (as a decimal), multiplying it by 100 to get a percentage, and then subtracting this percentage from 100 to get the percentage of free memory.
Save the file by ,entering Clt+X and Shift+Y.
Step#2:Add prometheus.myrule.yml ref in Prometheus Configuration
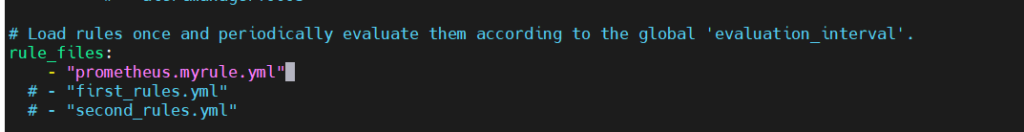
Now lets add the prometheus.myrule.yml reference to the prometheus.yml rule_files section.
sudo nano prometheus.yml
# Load rules once and periodically evaluate them according to the global 'evaluation_interval'.
rule_files:
    - "prometheus.myrule.yml"
  # - "first_rules.yml"
  # - "second_rules.yml"

Step#3:Restart the prometheus service
sudo systemctl restart prometheus
Now, check the status of prometheus service
sudo systemctl status prometheus

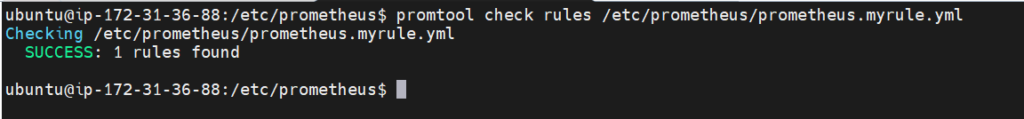
Check rules config file:
promtool check rules /etc/prometheus/prometheus.myrule.yml
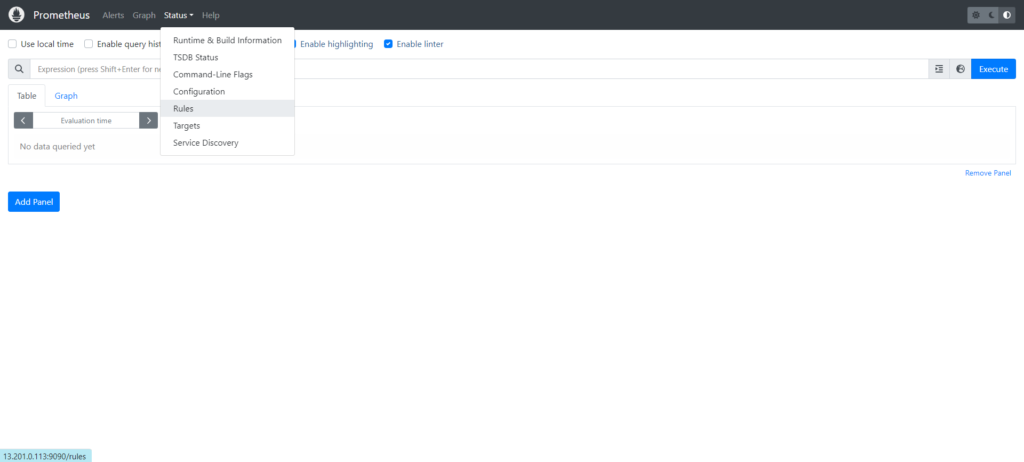
Step#4:Check the changes on Prometheus User Interface
Refresh the Prometheus user interface and check the drop down.
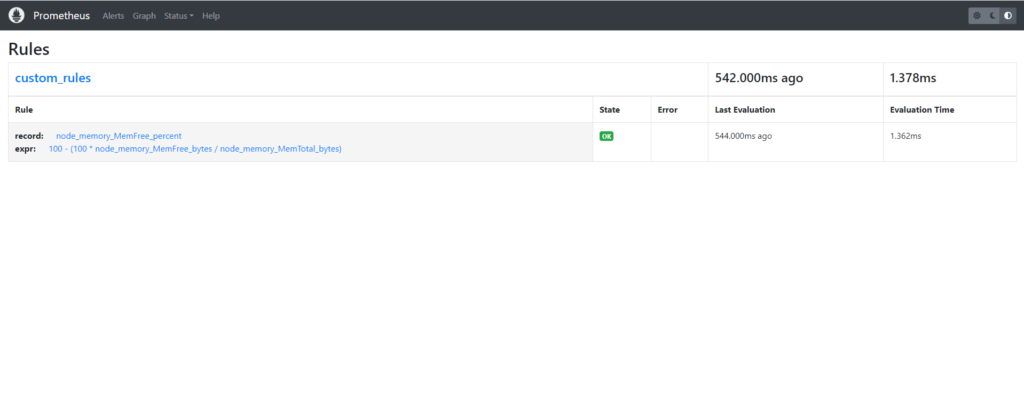
record :node_memory_MemFree_percent
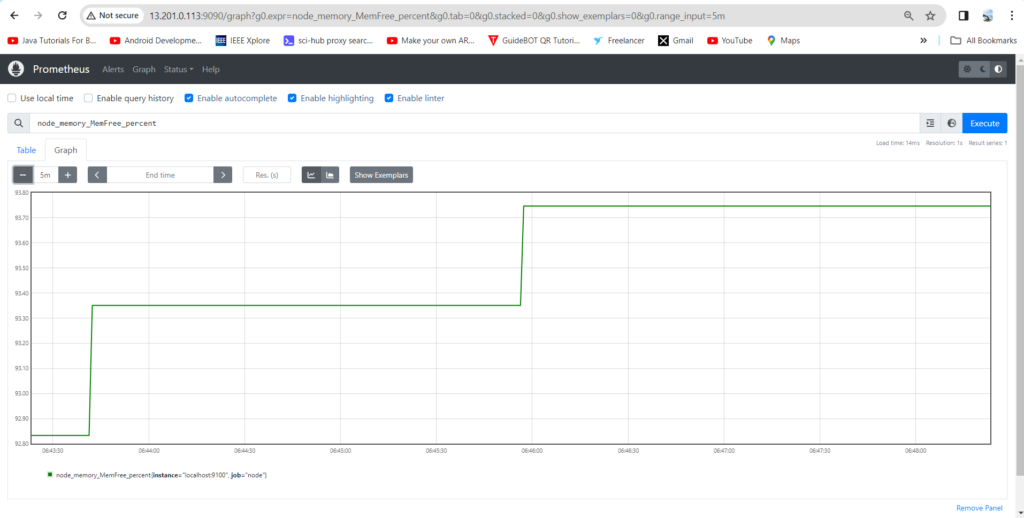
expr:100 – (100 * node_memory_MemFree_bytes / node_memory_MemTotal_bytes)

Conclusion:
Recording rules optimize Prometheus monitoring by pre-calculating complex metrics, enhancing query performance and scalability. Adhering to best practices ensures their efficacy, fostering greater observability and reliability in systems monitoring.
Related Articles:
How to Install Prometheus on Ubuntu 22.04 LTS
Secure Grafana with Nginx, Reverse Proxy and Certbot
Reference: