In this article we are going to cover Alerting Rules in Prometheus with Examples
Table of Contents
Types of Rules in Prometheus
Prometheus supports two primary types of rules that can be configured and evaluated periodically:
Recording Rules: Recording rules are designed for pre-calculating frequently used or computationally intensive queries. The outcomes of these rules are stored as separate time series data, enhancing query efficiency.
Example: A recording rule could compute the average response time of an API endpoint over a specific time window. This pre-calculated metric can then be readily queried for analysis or incorporated into dashboards.
Alerting Rules: Alerting rules enable users to define conditions that trigger alerts to external services such as Slack, based on PromQL queries. These rules help monitor systems and respond promptly to anomalous conditions or thresholds.
Example: An alerting rule might specify that if the CPU usage of a server exceeds 90% for more than 5 minutes, an alert should be sent to the operations team via Slack, indicating a potential performance issue.
What are Alerting Rules in Prometheus?
Alerting rules in Prometheus are predefined conditions written in PromQL (Prometheus Query Language) that trigger alerts when certain criteria are met. These rules enable users to define thresholds or patterns in the metrics data, facilitating proactive monitoring and notification of potential issues in a system.
For example, an alerting rule could be configured to send an alert if the CPU usage of a server exceeds 90% for more than 5 minutes. This rule would continuously monitor the CPU metrics and trigger an alert to notify administrators when the specified threshold is breached, allowing timely intervention to address performance issues.
Why to use Alert Rules in Prometheus?
Alert rules in Prometheus are essential for proactive monitoring and timely response to system anomalies. By defining alerting conditions based on PromQL queries, alert rules enable organizations to:
- Proactively Identify Issues: Alert rules help detect abnormal conditions or performance degradation in real-time, allowing teams to address issues before they escalate.
- Minimize Downtime: With alert rules, administrators can promptly respond to critical events, minimizing downtime and service disruptions.
- Ensure System Reliability: By configuring alerts for key metrics, organizations ensure the reliability and availability of their systems and applications.
- Facilitate Incident Response: Alert rules provide clear notifications to relevant stakeholders, streamlining incident response and resolution processes.
Best practices for Defining Alerting Rules in Prometheus
- Keep Rules Specific: Define alerting rules tailored to specific metrics or conditions. For instance, set an alert for when CPU usage exceeds 90% for more than five minutes.
- Set Clear Thresholds: Establish meaningful thresholds to avoid false positives. For example, trigger an alert when the number of HTTP 500 errors exceeds five within a one-minute window.
- Document and Review: Document each alerting rule’s purpose and regularly review and update them. Ensure that the on-call team knows what action to take for each alert.
- Avoid Alert Fatigue: Select metrics judiciously and fine-tune thresholds to prevent alert fatigue. Only trigger alerts for critical issues that require immediate attention.
- Integrate with Incident Management: Integrate Prometheus alerts with incident management tools like Slack or PagerDuty to streamline incident response. For instance, route alerts to the appropriate team channel in Slack for immediate action.
Implementing these practices ensures that Prometheus alerts effectively highlight critical issues, leading to timely response and improved system reliability.
Types of Alert State in Prometheus
There are three main alert states to know:
- Pending: The time elapsed since threshold breach is less than the recording interval
- Firing: The time elapsed since threshold breach is more than the recording interval and alertmanager is delivering notifications
- Resolved: The alert is no longer firing because the threshold is no longer exceeded; you can optionally enable resolution notifications using `[ send_resolved: <boolean> | default = true ]` in your config file.
Default Structure of Rule File in Prometheus
The rule file in Prometheus follows a structured format defined by YAML (YAML Ain’t Markup Language). YAML is a human-readable data serialization format commonly used for configuration files. Below is the default structure of a rule file in Prometheus:
groups:
  - name: <group_name>
    rules:
      - alert: <alert_name>
        expr: <PromQL_expression>
        for: <duration>
        labels:
          <label_name>: <label_value>
        annotations:
          <annotation_name>: <annotation_value>
Here’s an explanation of each parameter:
- groups: It contains one or more rule groups. Rule groups allow you to organize your alert rules logically.
- name: It specifies the name of the rule group.
- rules: It contains one or more alert rules defined within the group.
- alert: It defines the name of the alert. Each alert rule must have a unique name within the rule file.
- expr: It represents the PromQL expression that evaluates the condition for triggering the alert. PromQL (Prometheus Query Language) is used to query and analyze time-series data collected by Prometheus.
- for: It specifies the duration for which the condition defined by the PromQL expression must be true before triggering the alert.
- labels: It includes additional metadata attached to the alert, such as severity, service, or instance. Labels provide contextual information about the alert.
- annotations: It contains descriptive information about the alert, such as a summary or description. Annotations help provide more context to the alerting system and facilitate better understanding and handling of alerts.
Prerequisites
To follow this tutorial, you will need:
- 2 AWS Ubuntu 22.04 LTS Instance.
- User with sudo access (see the Initial Server Setup with Ubuntu 22.04 tutorial for details).
- Install Prometheus and Node Exporter on Ubuntu Server and Enable Port:9090 & 9100
Steps to add Alerting rules in Prometheus
Step#1:Create a prometheus.myrule.yml file and Enter the required Alert Rules in that file
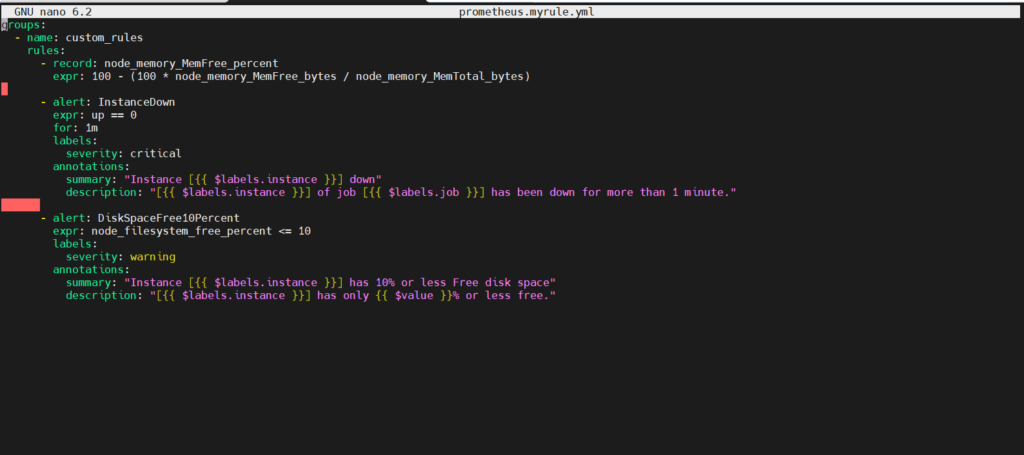
The first step in setting up alerting in Prometheus is to define alert rules. These rules are typically stored in a separate YAML file, such as prometheus.myrule.yml. Alert rules specify conditions that, when met, trigger alerts. For example:
sudo nano /etc/prometheus/prometheus.myrule.yml
groups:
  - name: custom_rules
    rules:
      - record: node_memory_MemFree_percent
        expr: 100 - (100 * node_memory_MemFree_bytes / node_memory_MemTotal_bytes)

      - alert: InstanceDown
        expr: up == 0
        for: 1m
        labels:
          severity: critical
        annotations:
          summary: "Instance [{{ $labels.instance }}] down"
          description: "[{{ $labels.instance }}] of job [{{ $labels.job }}] has been down for more than 1 minute."

      - alert: DiskSpaceFree10Percent
        expr: node_filesystem_free_percent <= 10
        labels:
          severity: warning
        annotations:
          summary: "Instance [{{ $labels.instance }}] has 10% or less Free disk space"
          description: "[{{ $labels.instance }}] has only {{ $value }}% or less free."
Let’s break down the rules defined in the Prometheus rule file:
- Recording Rule – node_memory_MemFree_percent:
- Purpose: Calculate the percentage of free memory on a node.
- Expression (PromQL): 100−(100×node_memory_MemTotal_bytesnode_memory_MemFree_bytes)
- Explanation: This expression calculates the percentage of free memory by subtracting the percentage of used memory from 100.
- Alert Rule – InstanceDown:
- Purpose: Raise an alert when an instance is not up.
- Expression (PromQL):
up == 0 - For: 1 minute (the condition must persist for 1 minute before triggering the alert).
- Labels:
- severity: critical
- Annotations:
- summary: “Instance [{{ $labels.instance }}] down”
- description: “[{{ $labels.instance }}] of job [{{ $labels.job }}] has been down for more than 1 minute.”
- Explanation: This rule checks if the instance is not up (i.e., its status is 0) and triggers a critical alert if the condition persists for more than 1 minute.
- Alert Rule – DiskSpaceFree10Percent:
- Purpose: Raise an alert when free disk space on an instance is 10% or less.
- Expression (PromQL): node_filesystem_free_percent <= 10
- Labels:
- severity: warning
- Annotations:
- summary: “Instance [{{ $labels.instance }}] has 10% or less Free disk space”
- description: “[{{ $labels.instance }}] has only {{ $value }}% or less free.”
- Explanation: This rule evaluates if the percentage of free disk space on the instance is less than or equal to 10%. If true, it raises a warning alert.
In summary, these rules help monitor critical aspects of system health and resource utilization. The recording rule calculates the percentage of free memory, while the alert rules monitor the availability of instances and disk space usage.
When any of the defined conditions are met, Prometheus triggers alerts with appropriate severity levels and descriptions, enabling timely response and remediation actions by system administrators.
Step#2:Add the Rule file path in the Prometheus Default Configuration File
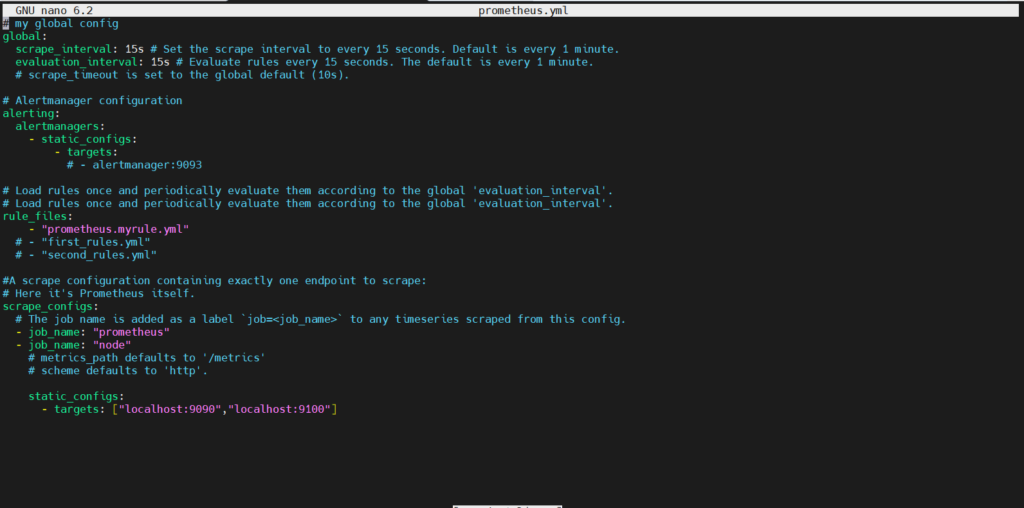
Once the alert rules are defined, the next step is to configure Prometheus to load these rules. This involves adding the path to the rule file in the Prometheus configuration file (prometheus.yml), like so:
rule_files:
  - "prometheus.myrule.yml"
Step#3:Check if the Rule File is correct or have any error
To check for rule file errors using promtool, you can utilize the check rules command. This command allows you to validate Prometheus rule files for correctness. Here’s how you can use promtool to check for errors in your rule file:
promtool check rules prometheus.myrule.yml

Step#4:Restart the Prometheus Server
After verifying the rule file, restart the Prometheus server to apply the changes in the configuration. This allows Prometheus to load the new alert rules and begin evaluating them against the collected metrics.
sudo systemctl restart prometheus
sudo systemctl status prometheus

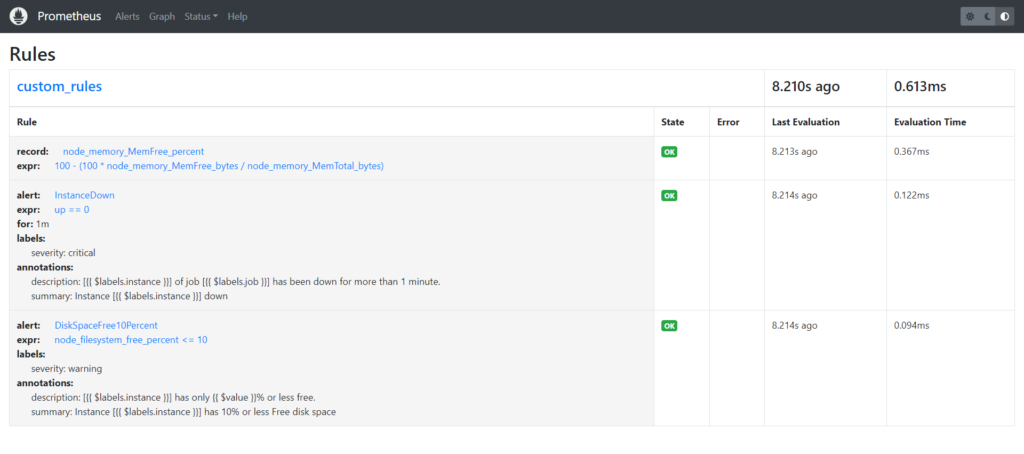
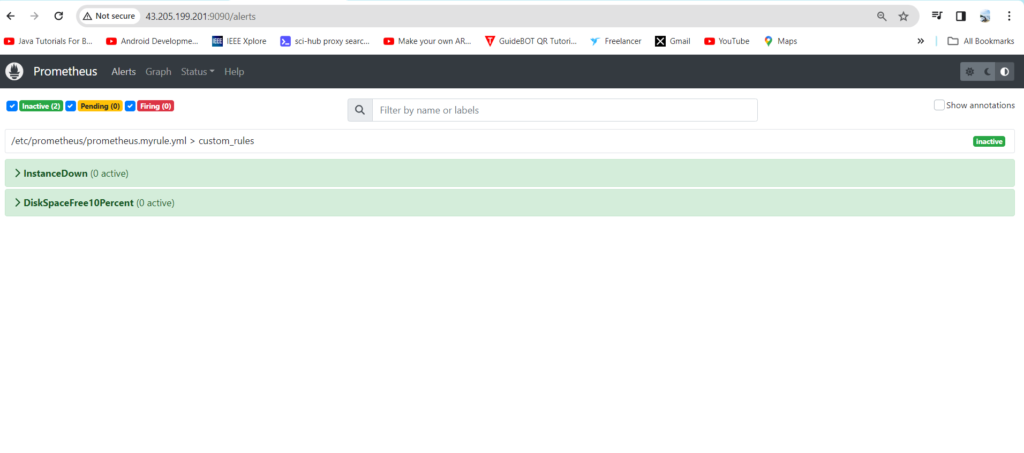
Step#5:Check the Status of Alert Rules on the Prometheus User Interface
Navigate to the Prometheus user interface to verify that the alert rules have been successfully loaded and are being evaluated. The Prometheus UI provides insights into the status of alert rules, including any firing alerts and their severity levels.
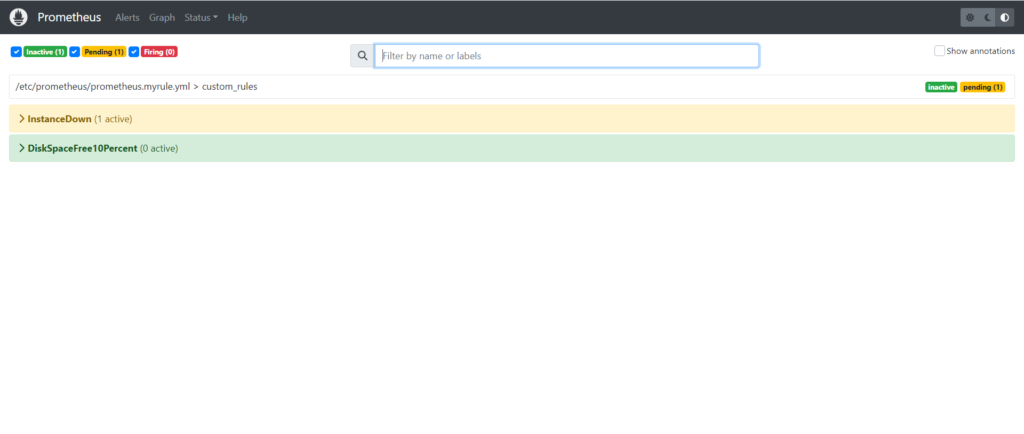
Pending State when Node exporter goes down
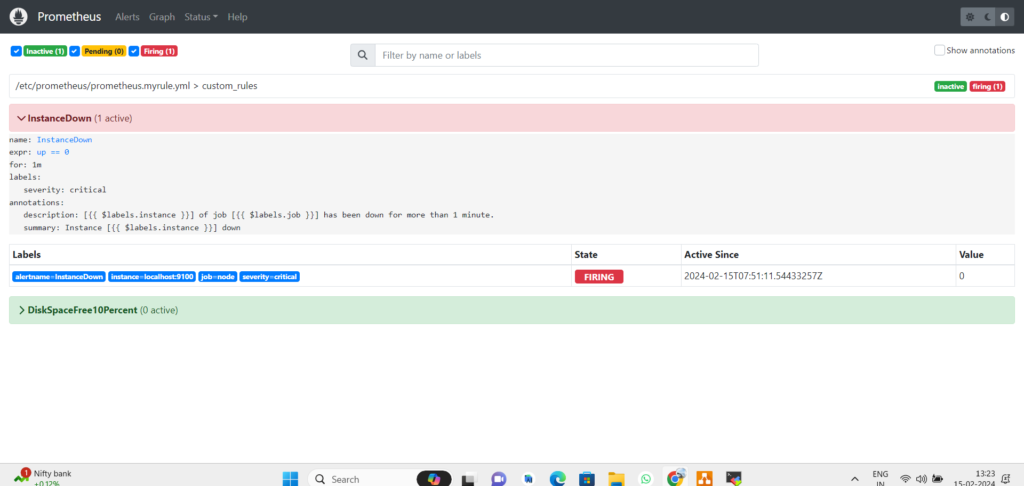
After one minute the state changes to Firing,
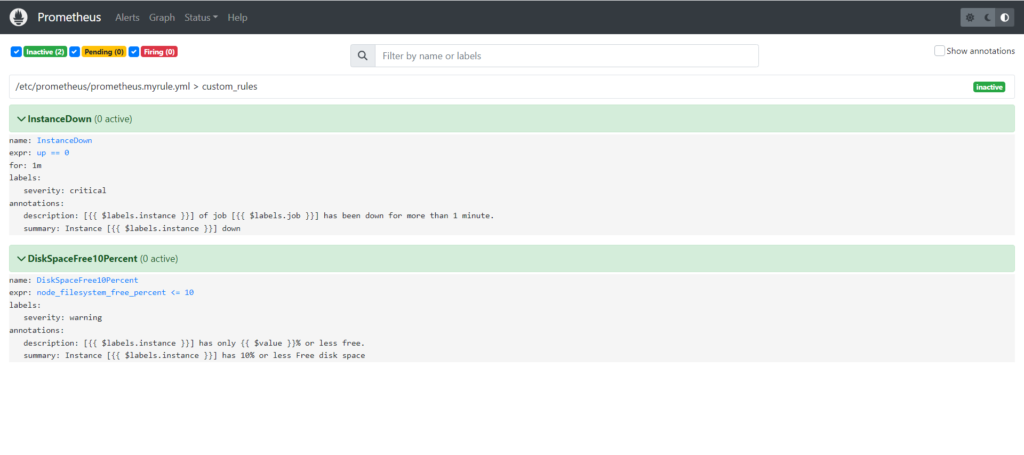
Again start the node exporter and see the changes
./node_exporter
sudo systemctl restart prometheus
Conclusion:
- Alerting rules play a pivotal role in Prometheus, enabling timely detection and response to critical issues within monitored systems.
- By understanding the anatomy, configuration, and best practices of alerting rules, organizations can establish robust monitoring and alerting workflows, ensuring the reliability and availability of their infrastructure and applications.
Related Articles:
How to Install Prometheus on Ubuntu 22.04 LTS
Secure Grafana with Nginx, Reverse Proxy and Certbot
Reference: