In this article, we explore Prometheus Exporters, essential components for gathering and exposing metrics in Prometheus monitoring. We’ll delve into their significance and functionality, with a specific focus on the Node Exporter as an illustrative example.

Table of Contents
What is Prometheus Exporter?
A Prometheus Exporter is a specialized software component designed to expose metrics from systems, services, or applications in a format that Prometheus can scrape and store for monitoring and alerting purposes. Essentially, it acts as an intermediary between Prometheus and the target system, translating internal metrics into a format that Prometheus understands.
Prometheus Exporters come in various forms, each tailored to gather specific metrics from different types of systems or services. They can be standalone applications, libraries, or plugins integrated directly into the software they monitor.
Prometheus Exporter Implementation Types
In a complex ecosystem of multiple stateful and stateless applications, there are two approaches to implementing Prometheus exporters for comprehensive metrics collection. These include:
Application built-in exporters:
Built-in exporters are used when the client system natively exposes key metrics, including request rates, errors, and duration. Common use cases include:
- Used to develop an application from scratch: developers assess and integrate Prometheus client requirements from the initial phases of application design.
- Integrated into existing applications: teams modify code to add specific Prometheus client capabilities.
Third-party/standalone exporters:
Standalone exporters are used to expose metrics so they can be collected and processed externally. In such instances, applications typically expose metrics through a metric API or logs. Standalone exporters are also provisioned in setups where the exposed data relies on transformation and aggregation by an external service.
How Does Prometheus Exporter Work?
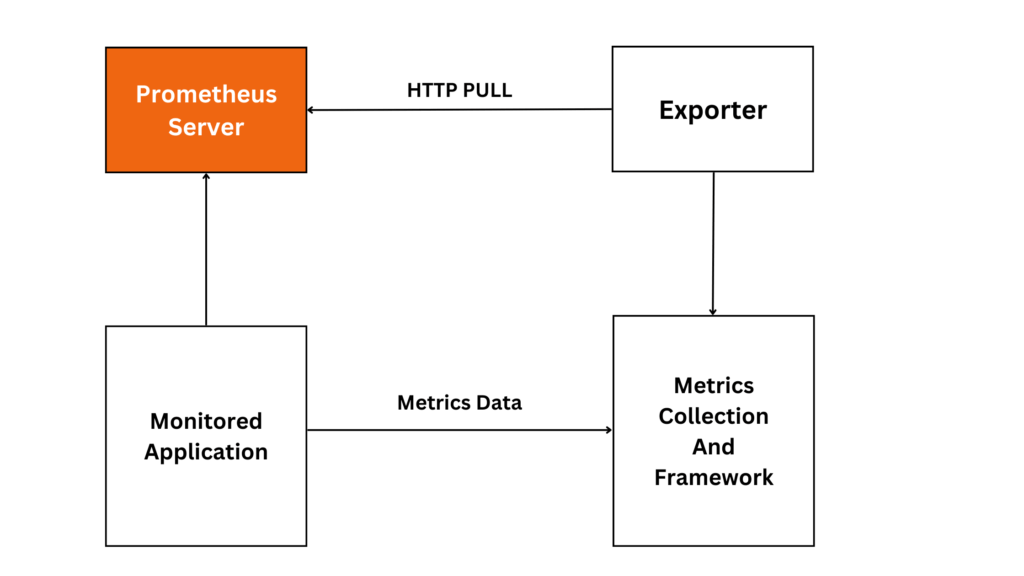
In the diagram:
- The Prometheus Server implements the HTTP pull model to retrieve metrics from monitored systems.
- The Exporter acts as an intermediary between the monitored application and the Prometheus server. It provides an HTTP endpoint where Prometheus can pull metrics data.
- The Monitored Application is the system or service being monitored. The exporter collects metrics from this application, transforms them into a format Prometheus understands, and exposes them through an HTTP endpoint.
- Prometheus periodically queries the exporter’s endpoint to fetch the metrics, which are then stored and processed for monitoring, alerting, and visualization purposes.
Types of Prometheus Exporters
Prometheus exporters are available for a wide range of applications and systems, allowing you to monitor various metrics. Here are some examples of popular Prometheus exporters:
- Node Exporter: Collects various system-level metrics such as CPU usage, memory utilization, disk I/O, and network statistics from Linux and Unix-like systems.
- Blackbox Exporter: Performs HTTP, HTTPS, DNS, TCP, and ICMP probes to collect data about the availability and responsiveness of network endpoints.
- Exporter for Docker: Monitors Docker containers, collecting metrics about container CPU usage, memory, network activity, and more.
- MySQL Exporter: Gathers metrics from MySQL and MariaDB databases, providing insights into database performance, query execution times, and other database-related statistics.
- PostgreSQL Exporter: Similar to MySQL Exporter but for PostgreSQL databases, offering metrics related to PostgreSQL database server performance.
- Redis Exporter: Monitors Redis key-value store, collecting data on memory usage, commands processed, and other Redis-specific metrics.
Here are some additional Prometheus exporter examples:
These exporters are just a few examples–there are many more available for various databases, messaging systems, cloud services, and custom applications. You can find exporters developed by the community on the Prometheus website and other online repositories.
Prometheus Exporters Best Practices and Techniques
Here are some best practices and techniques for working with Prometheus exporters:
- Use Standardized Metrics: Follow Prometheus best practices for metric naming, labeling, and exposition format to ensure consistency and compatibility across exporters.
- Optimize Exporter Performance: Minimize resource consumption and latency by optimizing metric collection, processing, and serving mechanisms within the exporter.
- Implement Rate Limiting: Employ rate limiting mechanisms to prevent overload on the exporter and the monitored application during high traffic periods.
- Monitor Exporter Health: Implement health checks and monitoring for exporters to ensure their availability and reliability, enabling timely intervention in case of failures or issues.
- Leverage Labels Effectively: Utilize labels to provide additional context and dimensions to metrics, enabling more granular and insightful monitoring and analysis.
- Secure Exposed Endpoints: Implement authentication, authorization, and encryption mechanisms to secure exposed endpoints, preventing unauthorized access and data breaches.
- Versioning and Documentation: Maintain clear versioning and comprehensive documentation for exporters, facilitating easy integration and troubleshooting for users.
- Automate Deployment and Configuration: Use automation tools and scripts to streamline the deployment and configuration of exporters, reducing manual effort and ensuring consistency across environments.
- Monitor Exporter Performance: Monitor exporter performance metrics such as latency, throughput, and error rates to identify bottlenecks and optimize resource allocation and configuration.
- Community and Ecosystem Engagement: Stay engaged with the Prometheus community and ecosystem to leverage best practices, share insights, and contribute to the improvement and evolution of exporters and monitoring practices.
By adhering to these best practices and techniques, organizations can effectively leverage Prometheus exporters to achieve robust and reliable monitoring of their systems, services, and applications.
Prerequisites
To follow this tutorial, you will need:
- 2 AWS Ubuntu 22.04 LTS Instance.
- User with sudo access (see the Initial Server Setup with Ubuntu 22.04 tutorial for details).
- Install Prometheus on Ubuntu Server and Enable Port:9090 & 9100
Example of setting up Node Exporter on Prometheus Server
Steps to Setup Prometheus Server & Node Exporter
Step#1:Install Node Exporter on Ubuntu
Node exporter is responsible for fetching the statistics from various hardware and virtual resources in the format which Prometheus can understand and with the help of the prometheus server those statistics can be exposed on port 9100.
Here are the download and installation steps –
- Download the binary of Node exporter based on the operating system.
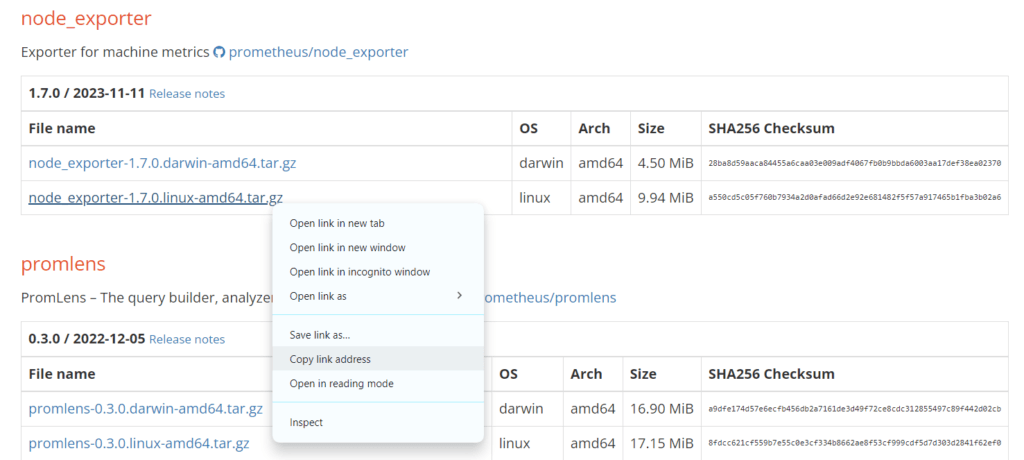
- Now install Node exporter on Ubuntu Server:
wget https://github.com/prometheus/node_exporter/releases/download/v1.7.0/node_exporter-1.7.0.linux-amd64.tar.gz

- Extract the download node exporter binary file
tar xvfz node_exporter-*.*-amd64.tar.gz

- Start the node exported with the command
./node_exporter
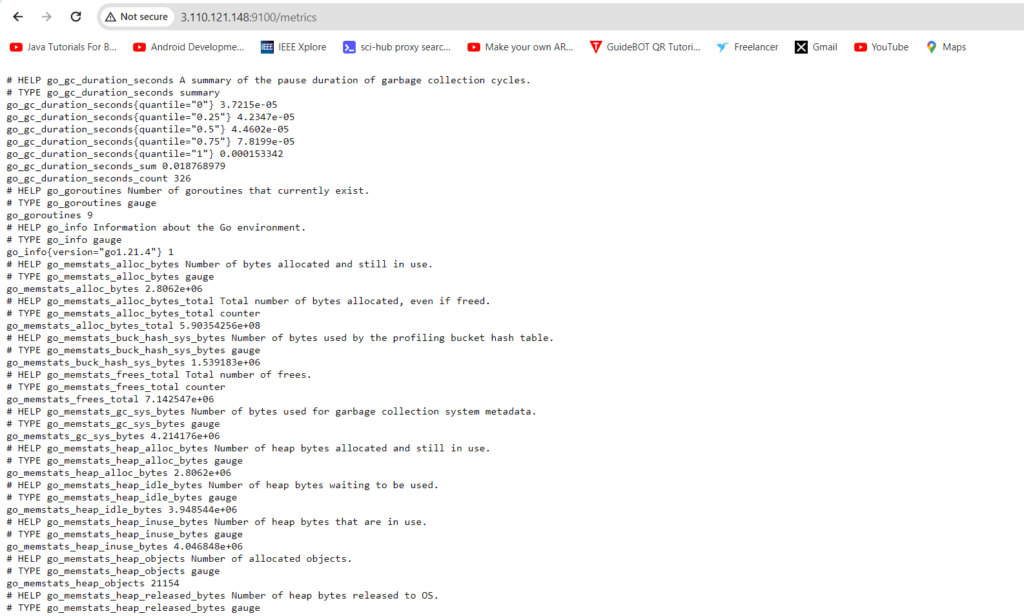
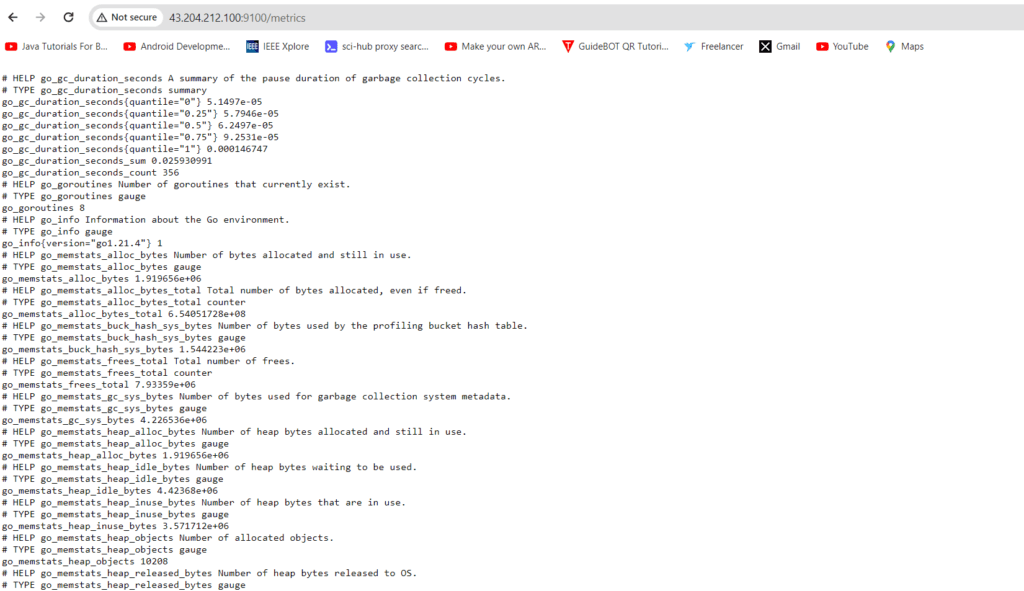
- Access the Node exporter metrics on the browser with URL –
http://localhost:9100

Step#2:Adding node exporter to prometheus.yml configuration
sudo nano prometheus.yml
# A scrape configuration containing exactly one endpoint to scrape:
# Here it's Prometheus itself.
scrape_configs:
  # The job name is added as a label `job=<job_name>` to any timeseries scraped from this config.
  - job_name: "prometheus"
  - job_name: "node"
    # metrics_path defaults to '/metrics'
    # scheme defaults to 'http'.

    static_configs:
      - targets: ["localhost:9090","localhost:9100","43.204.212.100:9100"]
This Prometheus configuration (prometheus.yml) defines two scrape configurations:
- Prometheus Job:
- Job name: “prometheus.”
- Targets: Scrapes metrics from the local Prometheus instance on port 9090.
- Node Exporter Job:
- Job name: “node.”
- Targets: Scrapes metrics from both the local Node Exporter on port 9100 and a remote Node Exporter at IP address 43.204.212.100 on port 9100.
- Defaults to using the ‘/metrics’ path and ‘http’ scheme for scraping.

sudo systemctl restart prometheus
Step#3:Verify the Host status on Prometheus server

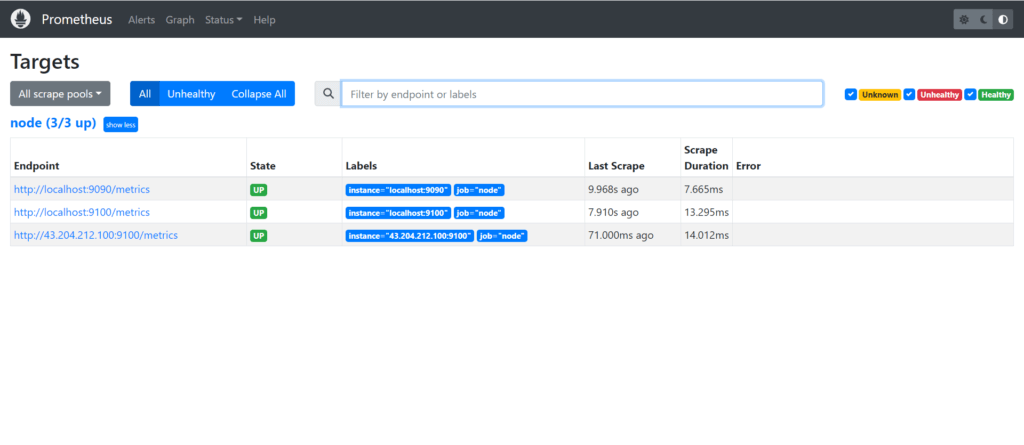
Conclusion:
In conclusion, Prometheus Exporters serve as indispensable tools for collecting metrics from various systems and applications, enabling robust monitoring and analysis. Through examples like the Node Exporter, we’ve seen how these exporters facilitate comprehensive visibility into system health, empowering organizations to optimize performance and ensure reliability in their digital environments.
Related Articles:
How to Install Prometheus on Ubuntu 22.04 LTS
Secure Grafana with Nginx, Reverse Proxy and Certbot
Reference: