In this article, we delve into the fundamental concept of Prometheus Scrape Configuration, essential for monitoring system metrics. From defining scrape intervals to configuring target endpoints, we offer a beginner-friendly guide to understanding this critical aspect of Prometheus monitoring.
Table of Contents
What is Prometheus Scrape Configuration?
Prometheus scrape configuration defines how Prometheus should collect metrics from different targets such as applications, services, or endpoints. It specifies the endpoints to scrape, the HTTP parameters to use, and other relevant details for successful metric retrieval. This configuration is crucial for effectively monitoring your infrastructure and applications.
Components of Prometheus Scrape Configuration
- Job: A job in Prometheus terminology refers to a set of configurations for scraping a particular endpoint or service. Each job typically corresponds to a logical grouping of targets that share similar characteristics or functionalities.
- Scrape Interval: This parameter defines how frequently Prometheus should scrape metrics from the configured targets. The scrape interval is specified in seconds and determines the frequency of data collection.
- Scrape Timeout: The scrape timeout is the maximum time Prometheus will wait for a target to respond to a scrape request before considering it a failed scrape attempt.
- Metrics Path and Scheme: Prometheus scrapes metrics from HTTP or HTTPS endpoints. The metrics path specifies the URL path where the metrics are exposed by the target, while the scheme specifies the protocol used (HTTP or HTTPS).
- Target Endpoints: Each job includes a list of target endpoints that Prometheus should scrape for metrics. These endpoints can be individual servers, containers, or services exposing metrics in a format that Prometheus understands.
- Labels and Relabelling: Prometheus allows users to apply labels to scraped metrics to provide additional context or information. Relabelling allows users to modify or filter labels associated with scraped metrics before they are stored in the time-series database.
Example of Scrape Configuration:
scrape_configs:
  - job_name: 'prometheus'
    scrape_interval: 15s
    scrape_timeout: 10s
    metrics_path: '/metrics'
    scheme: 'http'
    static_configs:
      - targets: ['your_ip:9090']
How Does Prometheus Scrape Configuration Works?
- Configuration File:
- Scrape configurations are specified in the
prometheus.ymlconfiguration file of Prometheus. - Users define scrape jobs and their configurations in this file.
- Scrape configurations are specified in the
- Job Definitions:
- Users define jobs in the configuration file, specifying the targets to scrape, scrape intervals, scrape timeouts, metrics paths, schemes, labels, etc.
- Prometheus Scrape Process:
- Prometheus periodically evaluates the scrape configurations defined in the
prometheus.ymlfile. - It sends HTTP requests to the targets based on the configured scrape intervals.
- Targets respond with metrics data in a format that Prometheus understands (typically in plaintext or Prometheus exposition format).
- Prometheus periodically evaluates the scrape configurations defined in the
- Metrics Collection:
- Prometheus collects the metrics data from the targets and stores it in its time-series database.
- Collected metrics can be queried and visualized using Prometheus’s query language (PromQL) and visualization tools like Grafana.
- Alerting and Analysis:
- Prometheus allows users to define alerting rules based on the collected metrics.
- It performs analysis on the collected data, triggers alerts based on predefined thresholds, and notifies users of potential issues.
In summary, scrape configuration in Prometheus enables users to define how Prometheus collects metrics from various targets, providing valuable insights into the performance and health of systems and applications.
Monitor Apache Web Server on Prometheus

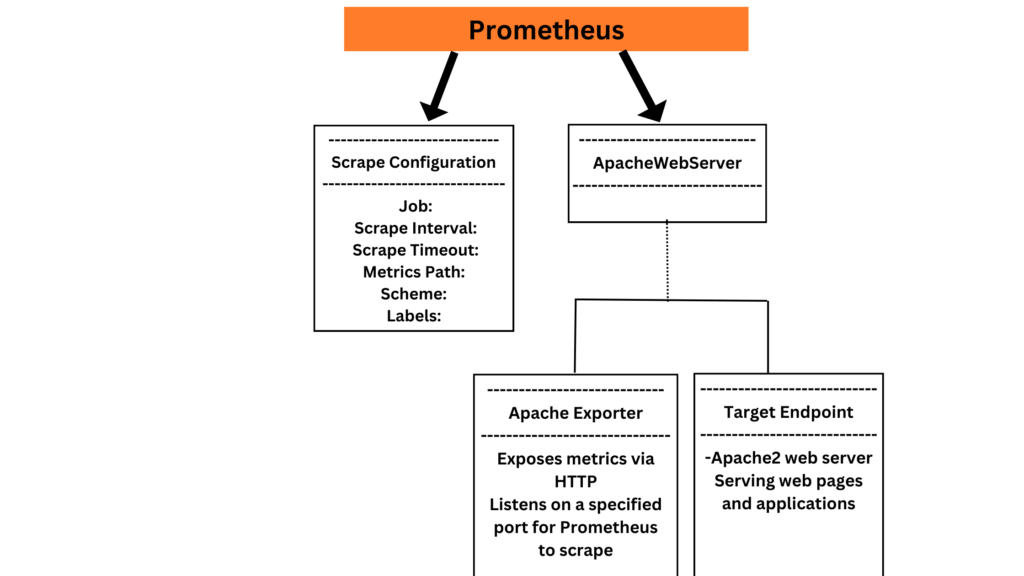
- Prometheus: Central monitoring and alerting tool responsible for collecting, storing, and querying metrics from various targets.
- Scrape Configuration: Specifies how Prometheus should scrape metrics from different targets. It includes job names, scrape intervals, scrape timeouts, metrics paths, schemes, labels, etc.
- Job: Represents a set of configurations for scraping a particular endpoint or service. In this case, it’s configured to scrape metrics from an Apache2 web server.
- Apache2 Web Server: The target endpoint from which Prometheus collects metrics. It serves web pages and applications over HTTP.
- Apache Exporter: An intermediary component that exposes Apache2 metrics in a format Prometheus can understand. It listens on a specified port and provides metrics via HTTP.
- Metrics Path: Specifies the URL path where the Apache Exporter exposes metrics data for Prometheus to scrape.
- Scheme: Specifies the protocol used for scraping metrics, typically HTTP or HTTPS.
- Labels: Provide additional metadata or context to scraped metrics, allowing users to organize and query metrics effectively.
Prerequisites
To follow this tutorial, you will need:
- AWS Ubuntu 22.04 LTS Instance.
- User with sudo access (see the Initial Server Setup with Ubuntu 22.04 tutorial for details).
- Install Prometheus on Ubuntu Server and Enable Port:9090,9117
To install Apache web server on an Ubuntu server and then monitor its metrics using Prometheus, follow these steps:
Step#1:Install Apache Web Server on Ubuntu 22.04 LTS
- Update the package index:
sudo apt update

- Install Apache:
sudo apt install apache2
- Start the Apache service:
sudo systemctl start apache2
- Enable Apache to start on boot:
sudo systemctl enable apache2
- Verify Apache is running:
sudo systemctl status apache2

Step#2:Edit Prometheus Configuration (prometheus.yml)
- Open the prometheus.yml configuration file
sudo nano /etc/prometheus/prometheus.yml
- Add a new scrape configuration for Apache metrics:
scrape_configs:
  - job_name: 'apache'
    static_configs:
      - targets: ['localhost:9117']  # assuming you'll use Apache Exporter on port 9117

Save and close the file (Ctrl + X, then Y, then Enter).
Step#3:Install Prometheus Apache Exporter
- Download the Apache Exporter binary:
wget https://github.com/Lusitaniae/apache_exporter/releases/download/v0.10.0/apache_exporter-0.10.0.linux-amd64.tar.gz
- Extract the downloaded archive:
tar xvfz apache_exporter-0.10.0.linux-amd64.tar.gz
- Move the binary to
/usr/local/bin:
sudo mv apache_exporter-0.10.0.linux-amd64/apache_exporter /usr/local/bin/
Change the ownership of the binary:
sudo chown prometheus:prometheus /usr/local/bin/apache_exporter
- Start the Apache Exporter:
sudo -u prometheus /usr/local/bin/apache_exporter
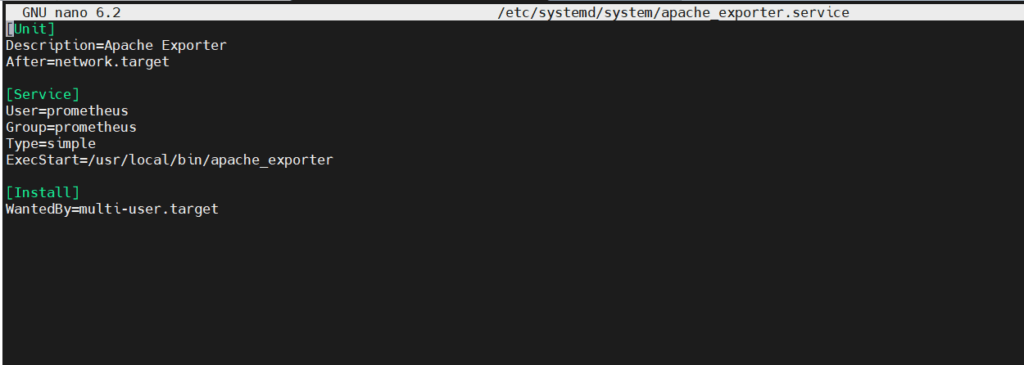
Step#4:Install Apache Exporter as a systemd Service
Create a new systemd service unit file using a text editor like nano or vim:
sudo nano /etc/systemd/system/apache_exporter.service
[Unit]
Description=Apache Exporter
After=network.target

[Service]
User=prometheus
Group=prometheus
Type=simple
ExecStart=/usr/local/bin/apache_exporter

[Install]
WantedBy=multi-user.target

Save the file and exit the text editor.
Reload systemd to pick up the changes:
sudo systemctl daemon-reload
Now, you can start the Apache Exporter service using:
sudo systemctl start apache_exporter
You can also enable the service to start automatically on boot:
sudo systemctl enable apache_exporter
Verify Service Status: After starting the Apache Exporter service, you can verify its status to ensure it’s running without errors:
sudo systemctl status apache_exporter

Step#5:Verify Prometheus and Apache Exporter Integration
Check Prometheus status:
sudo systemctl status prometheus
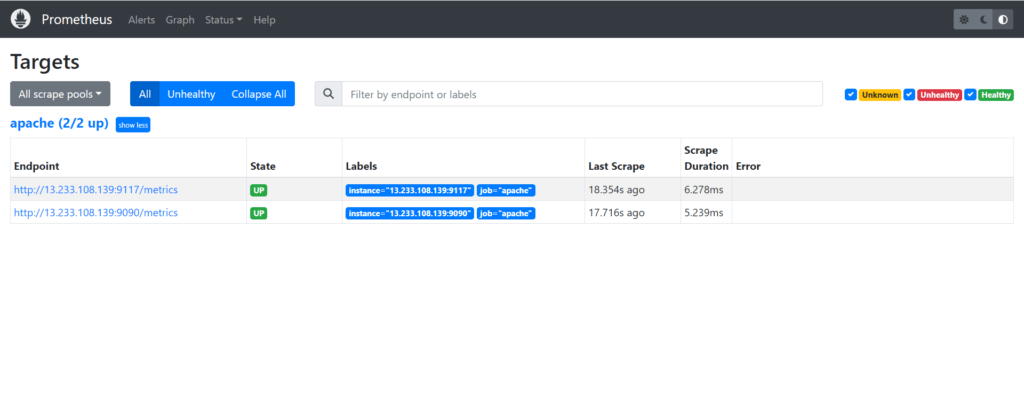
Verify that Prometheus is scraping Apache metrics:
- Access Prometheus web interface (usually at
http://your_server_ip:9090) - Go to the “Status” menu and select “Targets” to see if
localhost:9117 is up and running.


Conclusion:
In conclusion, understanding Prometheus scrape configuration is crucial for efficient monitoring, enabling tailored collection of metrics and streamlined management. With defined jobs, intervals, and labels, users can optimize monitoring setups to promptly address system health and performance concerns.
Related Articles:
How to Install Prometheus on Ubuntu 22.04 LTS
Secure Grafana with Nginx, Reverse Proxy and Certbot
Reference:
