In this article, we will explore Collect HTTP Metrics for Java App OpenTelemetry and Prometheus | how to Collect HTTP Metrics for Java Application using Maven, OpenTelemetry, and Prometheus. Monitoring HTTP metrics is vital for understanding the performance of your application and troubleshooting issues. Collecting HTTP metrics lets you gain insight into the application’s traffic, request processing times, and error rates. In this guide, we will set up a Java application to emit HTTP metrics using OpenTelemetry and export them to Prometheus.
Table of Contents
Prerequisites
Before you start, ensure you have the following installed on your system.
- AWS Account with Ubuntu 24.04 LTS EC2 Instance.
- Open JDK, Maven, Docker and Prometheus installed.
Step #1:Set Up Ubuntu EC2 Instance
Update the package list.
sudo apt update
Install the default JDK for java.
sudo apt install -y default-jdk
check its version to verify its installation.
java -version
Install Maven.
sudo apt install -y maven
check its version to verify its installation.
mvn -version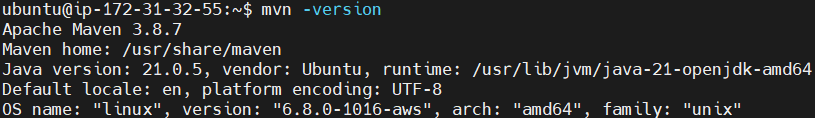
Install Docker.
sudo apt install -y docker.io
start and enable the docker.
sudo systemctl start docker
sudo systemctl enable docker
Pull the Prometheus Docker image.
sudo docker pull prom/prometheus
Step #2:Create the Maven Roll Dice Application to Collect http Metrics
Run the following command to create a new Maven project.
mvn archetype:generate -DgroupId=com.example -DartifactId=roll-dice -DarchetypeArtifactId=maven-archetype-quickstart -DinteractiveMode=false
Navigate to the Project Directory.
cd roll-dice
Edit the pom.xml to include the following dependencies for OpenTelemetry and Prometheus.
nano pom.xml
Replace its content with the following code.
<project xmlns="http://maven.apache.org/POM/4.0.0" xmlns:xsi="http://www.w3.org/2001/XMLSchema-instance"
  xsi:schemaLocation="http://maven.apache.org/POM/4.0.0 http://maven.apache.org/maven-v4_0_0.xsd">
  <modelVersion>4.0.0</modelVersion>
  <groupId>com.example</groupId>
  <artifactId>helloworld</artifactId>
  <packaging>jar</packaging>
  <version>1.0-SNAPSHOT</version>
  <name>helloworld</name>
  <url>http://maven.apache.org</url>
  <parent>
    <groupId>org.springframework.boot</groupId>
    <artifactId>spring-boot-starter-parent</artifactId>
    <version>3.4.0</version>
    <relativePath />
  </parent>
  <dependencies>
    <dependency>
      <groupId>junit</groupId>
      <artifactId>junit</artifactId>
      <version>3.8.1</version>
      <scope>test</scope>
    </dependency>
    <dependency>
      <groupId>org.springframework.boot</groupId>
      <artifactId>spring-boot-starter-web</artifactId>
    </dependency>
    <dependency>
      <groupId>org.springframework.boot</groupId>
      <artifactId>spring-boot-starter-test</artifactId>
      <scope>test</scope>
    </dependency>
    <!-- OpenTelemetry API -->
    <dependency>
        <groupId>io.opentelemetry</groupId>
        <artifactId>opentelemetry-api</artifactId>
        <version>1.44.1</version>
    </dependency>

    <!-- OpenTelemetry SDK (for exporting metrics/traces) -->
    <dependency>
        <groupId>io.opentelemetry</groupId>
        <artifactId>opentelemetry-sdk</artifactId>
        <version>1.44.1</version>
    </dependency>

    <!-- Optional: Prometheus Exporter -->
    <dependency>
        <groupId>io.opentelemetry</groupId>
        <artifactId>opentelemetry-exporter-prometheus</artifactId>
        <version>1.44.1-alpha</version>
    </dependency>

    <dependency>
        <groupId>io.opentelemetry</groupId>
        <artifactId>opentelemetry-exporter-logging</artifactId>
        <version>1.44.1</version>
    </dependency>
    <dependency>
        <groupId>io.prometheus</groupId>
        <artifactId>simpleclient</artifactId>
        <version>0.16.0</version>
    </dependency>
    <dependency>
        <groupId>io.prometheus</groupId>
        <artifactId>simpleclient_httpserver</artifactId>
        <version>0.16.0</version>
    </dependency>
    <dependency>
        <groupId>io.prometheus</groupId>
        <artifactId>simpleclient_hotspot</artifactId>
        <version>0.16.0</version>
    </dependency>
    <dependency>
        <groupId>org.nanohttpd</groupId>
        <artifactId>nanohttpd</artifactId>
        <version>2.3.1</version>
    </dependency>

    <!-- SLF4J for Logging -->
    <dependency>
        <groupId>org.slf4j</groupId>
        <artifactId>slf4j-api</artifactId>
        <version>2.1.0-alpha1</version>
    </dependency>
  </dependencies>
  <build>
    <plugins>
      <plugin>
        <groupId>org.springframework.boot</groupId>
        <artifactId>spring-boot-maven-plugin</artifactId>
      </plugin>
    </plugins>
  </build>
</project>
Step #3:Collect HTTP Metrics for Java App using Opentelemetry
Navigate to the src/main/java/com/example.
cd src/main/java/com/example
Open the application file.
nano App.java
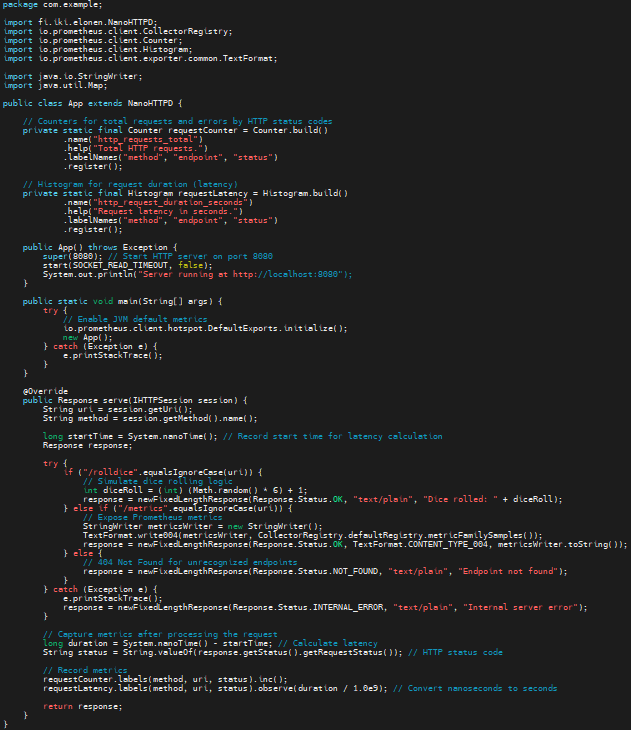
Replace its content with the following code.
package com.example;

import fi.iki.elonen.NanoHTTPD;
import io.prometheus.client.CollectorRegistry;
import io.prometheus.client.Counter;
import io.prometheus.client.Histogram;
import io.prometheus.client.exporter.common.TextFormat;

import java.io.StringWriter;
import java.util.Map;

public class App extends NanoHTTPD {

    // Counters for total requests and errors by HTTP status codes
    private static final Counter requestCounter = Counter.build()
            .name("http_requests_total")
            .help("Total HTTP requests.")
            .labelNames("method", "endpoint", "status")
            .register();

    // Histogram for request duration (latency)
    private static final Histogram requestLatency = Histogram.build()
            .name("http_request_duration_seconds")
            .help("Request latency in seconds.")
            .labelNames("method", "endpoint", "status")
            .register();

    public App() throws Exception {
        super(8080); // Start HTTP server on port 8080
        start(SOCKET_READ_TIMEOUT, false);
        System.out.println("Server running at http://localhost:8080");
    }

    public static void main(String[] args) {
        try {
            // Enable JVM default metrics
            io.prometheus.client.hotspot.DefaultExports.initialize();
            new App();
        } catch (Exception e) {
            e.printStackTrace();
        }
    }

    @Override
    public Response serve(IHTTPSession session) {
        String uri = session.getUri();
        String method = session.getMethod().name();

        long startTime = System.nanoTime(); // Record start time for latency calculation
        Response response;

        try {
            if ("/rolldice".equalsIgnoreCase(uri)) {
                // Simulate dice rolling logic
                int diceRoll = (int) (Math.random() * 6) + 1;
                response = newFixedLengthResponse(Response.Status.OK, "text/plain", "Dice rolled: " + diceRoll);
            } else if ("/metrics".equalsIgnoreCase(uri)) {
                // Expose Prometheus metrics
                StringWriter metricsWriter = new StringWriter();
                TextFormat.write004(metricsWriter, CollectorRegistry.defaultRegistry.metricFamilySamples());
                response = newFixedLengthResponse(Response.Status.OK, TextFormat.CONTENT_TYPE_004, metricsWriter.toString());
            } else {
                // 404 Not Found for unrecognized endpoints
                response = newFixedLengthResponse(Response.Status.NOT_FOUND, "text/plain", "Endpoint not found");
            }
        } catch (Exception e) {
            e.printStackTrace();
            response = newFixedLengthResponse(Response.Status.INTERNAL_ERROR, "text/plain", "Internal server error");
        }

        // Capture metrics after processing the request
        long duration = System.nanoTime() - startTime; // Calculate latency
        String status = String.valueOf(response.getStatus().getRequestStatus()); // HTTP status code

        // Record metrics
        requestCounter.labels(method, uri, status).inc();
        requestLatency.labels(method, uri, status).observe(duration / 1.0e9); // Convert nanoseconds to seconds

        return response;
    }
}
Step #4:Configure Prometheus for Java Application
Navigate back to root directory.
cd ../../../../..
Create a Prometheus Configuration File.
nano prometheus.yml
Add the following content into it.
global:
  scrape_interval: 15s

scrape_configs:
  - job_name: "roll-dice"
    scrape_interval: 5s
    static_configs:
      - targets: ['<EC2-instance-IP>:8080']
Replace <EC2-instance-IP> with the public IP address of your EC2 instance.

Step #5:Build and Run the Application
Build the Application using following command.
mvn clean install
Run the Application using following command.
mvn spring-boot:run
Open your browser to access the Application and Prometheus metrics.
Roll Dice Endpoint: Visit http:// to roll the dice and get the result.<EC2-instance-IP>:8080/rolldice

Replace <EC2-instance-IP> with the public IP address of your EC2 instance.
Metrics Endpoint: Visit http:// to see the http metrics.<EC2-instance-IP>:8080/metrics

Replace <EC2-instance-IP> with the public IP address of your EC2 instance.
Step #6:Start the Prometheus
Open the duplicate tab and navigate to the root directory.
cd roll-diceRun the Prometheus Container using following command.
sudo docker run -p 9090:9090 -v /home/ubuntu/roll-dice/prometheus.yml:/etc/prometheus/prometheus.yml prom/prometheus
Visit http:// to see Prometheus UI.<EC2-instance-IP>:9090

To check if Prometheus is correctly scraping metrics from your Java application, navigate to the “Targets” page in the Prometheus UI. Click on “Status” in the menu bar and then “Targets. “Ensure that your job roll-dice is listed and marked as “UP.”

Conclusion:
In conclusion, this setup ensures better visibility into application performance, helping you quickly identify and address issues. By following this guide, you have successfully set up a Java application to expose HTTP metrics using OpenTelemetry and collected them with Prometheus. This setup provides valuable insights into your application’s performance. Extend this foundation by adding tracing or integrating visualization tools like Grafana.
Related Articles:
Python Flask API Monitoring with OpenTelemetry, Prometheus, and Grafana
Reference: