In this article, discover a swift Grafana installation using Docker | How to Run Grafana using Docker Container Execute a single Docker command to pull the Grafana image, run the container, and access its powerful monitoring interface. Ideal for both DevOps experts and beginners, this streamlined approach ensures a hassle-free setup of Grafana’s robust features.
Table of Contents
What is Grafana?
Grafana is an open source tool for performing data analytics, retrieving metrics that make sense of large amounts of data, and monitoring our apps using nice configurable dashboards.
Grafana integrates with a wide range of data sources, including Graphite, Prometheus, Influx DB, ElasticSearch, MySQL, PostgreSQL, and others. When connected to supported data sources, it provides web-based charts, graphs, and alerts.
What is Docker?

Docker is a set of platform as a service tools that deliver software in containers using OS-level virtualization. Containers are self-contained, containing their own software, libraries, and configuration files, and communicating with one another via well-defined channels. Docker makes it simple for developers to package, ship, and execute any application as a lightweight, portable, self-contained container that can operate almost anywhere.
Difference between Docker Image and Docker Container
| Feature | Docker Image | Docker Container |
|---|---|---|
| Definition | Immutable template for containers. | Running instance of an image. |
| Contents | Static, includes code, runtime, and dependencies. | Dynamic, an active executable environment. |
| Purpose | Blueprint for creating containers. | Runtime environment for an application. |
| Storage Location | Host machine’s file system. | Created on the host during runtime. |
| Mutability | Immutable, changes create a new image. | Mutable, changes affect the running container. |
| Lifecycle | Exists as a template. | Active during application execution. |
Grafana Docker images come in two editions
1.Grafana Enterprise Edition (grafana/grafana-enterprise):
- Overview: Grafana Enterprise is the commercial version of Grafana, offering additional features and support services beyond the open-source version.
- Key Features:
- Enterprise Plugins: Access to exclusive plugins and data sources designed for enterprise-level use.
- Advanced Authentication: Enhanced security features and authentication options.
- Enterprise Support: Dedicated support services with faster response times.
- Usage Insights: Additional analytics and monitoring capabilities.
- Use Case: Suitable for organizations with complex requirements, advanced security needs, and a demand for specialized plugins and support services.
2.Grafana Open Source Edition (grafana/grafana-oss)
- Overview: Grafana Open Source is the freely available, community-driven version of Grafana. It provides a robust set of features for creating dashboards and visualizing data.
- Key Features:
- Dashboard Creation: Build and customize dashboards with a wide range of visualizations.
- Data Source Integration: Connect to various data sources such as Prometheus, InfluxDB, Graphite, and more.
- Alerting: Set up alerts based on metric thresholds.
- Community Support: Support from the open-source community and regular updates.
- Use Case: Ideal for users and organizations looking for a powerful open-source solution for monitoring and visualization without the need for additional commercial features.
Choosing Between Editions:
- Considerations: Choose the edition based on your organization’s requirements, budget, and the specific features needed.
- Licensing: Grafana Enterprise may require a commercial license, while Grafana Open Source is typically used under an open-source license.
- Support: If advanced support and additional features are crucial, Grafana Enterprise may be the preferred choice.
How to Run Grafana using Docker Container
Step#1:To run the latest stable version of Grafana, run the following command
docker run -d -p 3000:3000 --name=grafana grafana/grafanaWhere:
- docker run: This initiates the process of running a Docker container.
- -d: It runs the container in detached mode, meaning it runs in the background.
- -p 3000:3000: This option maps port 3000 from the host machine to port 3000 in the container. Grafana typically uses port 3000 for its web interface.
- –name=grafana: This assigns the name “grafana” to the running container.
- grafana/grafana: This specifies the Docker image to be used for creating the container. In this case, it’s the official Grafana image from the Docker Hub.
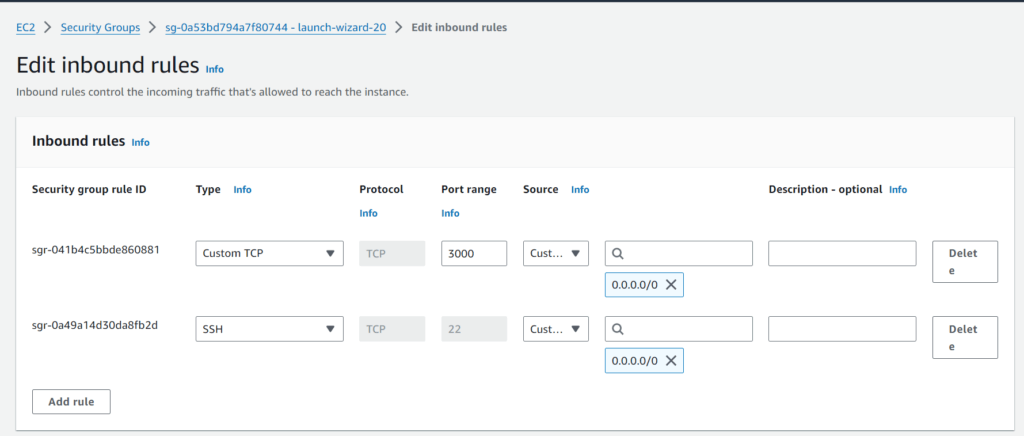
Step#2:Edit the inbound rules of the Instance
If you are using virtual machine/ec2-instance then you need to change the security group inbound rules of that instance:
Step#3:Access Grafana Login Page on Browser
To access the Grafana login you need to type in url your ip address with port no which we are currently using is 3000.
http://your_ip_address:3000/login
for eg:
http://3.110.29.81:3000/login
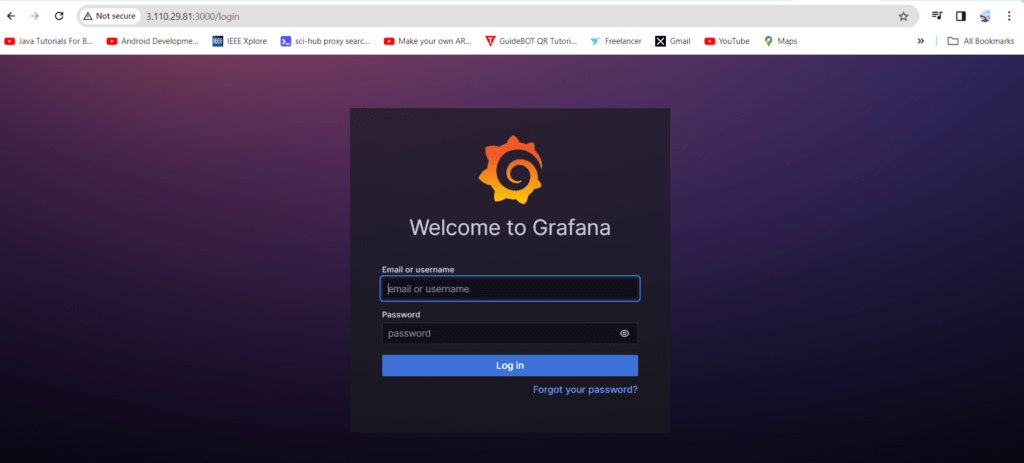
You can login by entering Username and Password as admin then the Grafana Home page will be loaded

Step#4:Stop the Grafana container
To display the lists Docker containers, run the following command:
docker ps

To stop the Grafana container, run the following command:
docker stop grafana

To start the Grafana container, run the following command:
docker start grafana

To see the docker images, run the following command:
docker images

Conclusion:
In conclusion, deploying Grafana using Docker provides a seamless and portable solution for setting up a robust monitoring and visualization platform | How to Run Grafana using Docker Container. The simplicity of pulling the Grafana Docker image and running a container allows for quick installation, making it an ideal choice for both beginners and experienced users. Whether for exploring data insights, creating dashboards, or monitoring system metrics, Dockerized Grafana offers flexibility and ease of management, paving the way for efficient data visualization in diverse environments.
Related Articles:
How to Install Prometheus on Ubuntu 22.04 LTS
Deploy Node.js app on Amazon ECS and Fargate
Reference: