In this article we are going to cover How Install Prometheus and Grafana with WMI Exporter on Window Server 2022 Base on AWS EC2 Windows.
Table of Contents
What is prometheus?
- Prometheus is a open source Linux Server Monitoring tool mainly used for metrics monitoring, event monitoring, alert management, etc.
- Prometheus has changed the way of monitoring systems and that is why it has become the Top-Level project of Cloud Native Computing Foundation (CNCF).
- Prometheus uses a powerful query language i.e. “PromQL”.
- In Prometheus tabs are on and handles hundreds of services and microservices.
- Prometheus use multiple modes used for graphing and dashboarding support.
Why we used prometheus?
- A multi-dimensional data model with time series data identified by metric name and key/value pairs
- PromQL, a flexible query language to leverage this dimensionality
- Pushing time series is supported via an intermediary gateway
- Multiple modes of graphing and dashboarding support
Prometheus Architecture
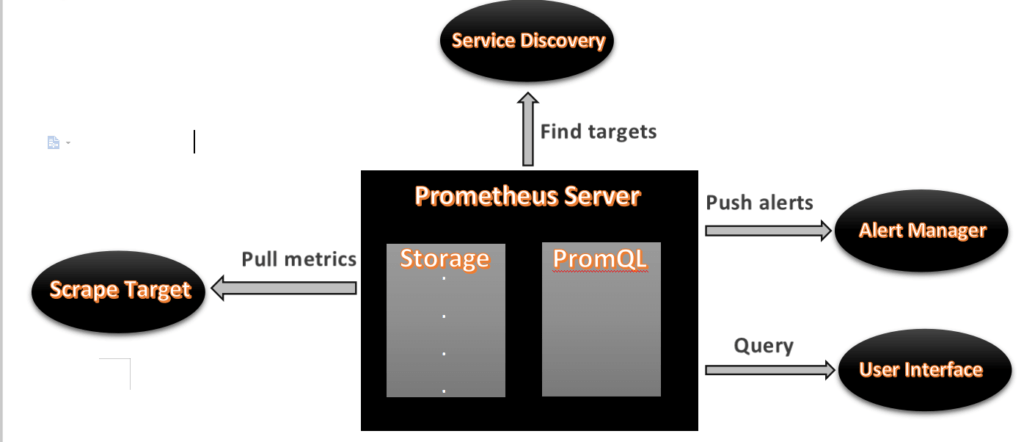
- As above we can see an architecture of Prometheus monitoring tools.
- We made a basic design to understand it easily for you people.
Now lets understand the Prometheus components one-by-one
Prometheus Components
1. Prometheus Server
- Prometheus server is a first component of Prometheus architecture.
- Prometheus server is a core of Prometheus architecture which is divided into several parts like Storage, PromQL, HTTP server, etc.
In Prometheus server data is scraped from the target nodes and then stored in the database.
1.a. Storage
- Storage in Prometheus server has a local on disk storage.
- Prometheus has many interfaces that allow integrating with remote storage systems.
1.b. PromQL
- Prometheus uses its own query language i.e. PromQL which is a very powerful querying language.
- PromQL allows the user to select and aggregate the data.
2. Service Discovery
- Next and very important component of Prometheus Server is the Service Discovery.
- With the help of Service discovery the services are identified which need to be scraped.
- To Pull metrics, identification of services and finding the targets are compulsory needed.
- Through Service discovery we monitor the entities and can also locate its targets.
3. Scrape Target
- Once the services are identified and the targets are ready then we can pull metrics from it and can scrape the target.
- We can export the data of the end point using node exporters.
- Once the metrics or other data is pulled, Prometheus stores it in a local storage.
4. Alert Manager
- Alert Manager handles the alerts which may occurs during the session.
- Alert manager handles all the alerts which are sent by the Prometheus server.
- Alert manager is one of the very useful components of the Prometheus tool.
- If in case any big error or any issue occurs, alert manager manage those alerts and contact with human via E-mail, Text Messages, On-call, or any other chat application service.
5. User Interface
- User interface is also an important component as it builds a bridge between the user and the system.
- In Prometheus, user interfaces are note that much user friendly and can be used till graph queries.
- For good exclusive dashboards Prometheus works together with Grafana (visualization tool).
- Using Grafana over Prometheus to visualize properly we can use custom dashboards.
- Grafana dashboards display via pie charts, line charts, tables, good data graphs of CPU usage, RAM utilization, network load, etc with indicators.
- Grafana supports and run with Prometheus by querying language i.e. PromQL.
- To fetch data from Prometheus and to display the results on Grafana dashboards PromQL is used.
What is Grafana ?
- Grafana is a free and open source visualization tool mostly used with Prometheus to which monitor metrics.
- Grafana provides various dashboards, charts, graphs, alerts for the particular data source.
- Grafana allows us to query, visualize, explore metrics and set alerts for the data source which can be a system, server, nodes, cluster, etc.
- We can also create our own dynamic dashboard for visualization and monitoring.
- We can save the dashboard and can even share with our team members which is one of the main advantage of Grafana.
What is WMI Exporter?
- It is same like Node Exporter but Node Exporter for Linux and WMI Exporter for Windows
- WMI Exporter is an exporter utilized for windows servers to collects metrics like CPU usage, memory, and Disk usage.
- It is open-source which can be installed on Windows servers using the .msi installer
Prerequisite:
- Good internet connectivity
- Security Groups Configured properly
- Any web Browser
- Security Groups Configured on EC2 Instances
- Port 9090 — Prometheus Server
- Port 9182—-WMI Exporter
- Port 3000 — Grafana
Install Prometheus and Grafana with WMI Exporter on Window Server 2022 Base
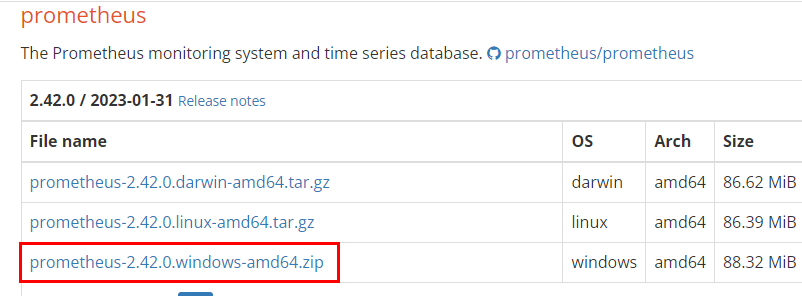
#1:Download Prometheus for Windows Server 2022 base
Now we will download the latest version of Prometheus. We can copy the download link as per our Operating System from Prometheus download page
Using the below command we can download latest version of Prometheus, here we are downloading Prometheus latest version, you use the above link to download
#2:Install Prometheus on Window Server 2022 Base
Open command prompt and locate to “Prometheus” root directory. Use following start command and pass web listen address and config file default Prometheus yml file as options.
prometheus.exe --config.file prometheus.yml --web.listen-address ":9090" --storage.tsdb.path "data"
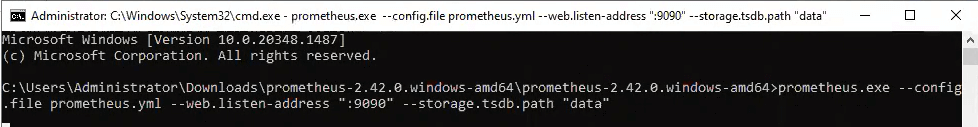
Now Prometheus is successfully installed in your machine
After installation now we are going to install Grafana on Window
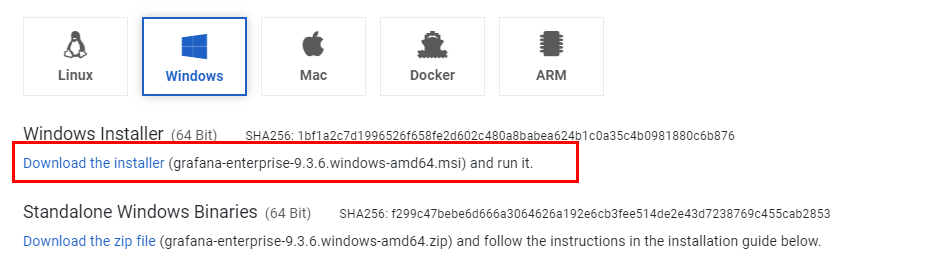
#3:Install Grafana on Windows 2022 Server Base
Now we will download the latest version of Grafana.from official page of Grafana select window operating system and download .msi installer
#4:Configure Grafana on Install Grafana on Windows 2022 Server Base
After download of grafana we will install grafana on window
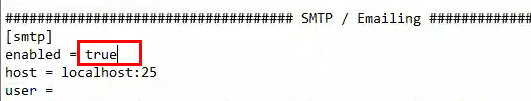
After installation of Grafana go to C:<<Program Files<<GrafanaLabs<<Grafana<< conf<<defaults
In default change the enabled false replace with true you can check the below image
To access Grafana Dashboard open your favorite browser, type server IP or Name followed by grafana default port 3000.
http://localhost:3000
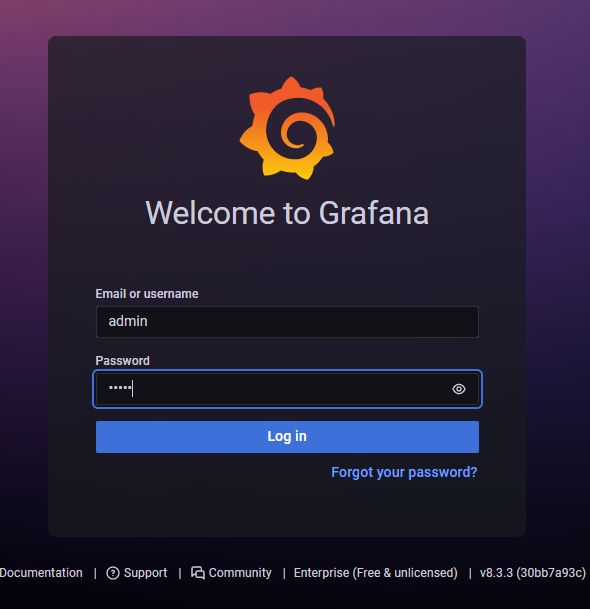
Here you can see Login page of Grafana now you will have to login with below Grafana default UserName and Password.
Username – admin
Password – admin
It is always a good practice to change your login credentials.
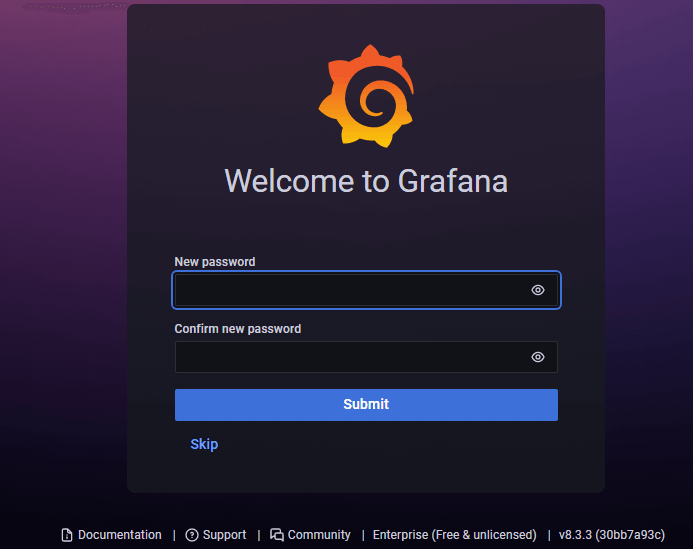
Provide your New Password and click on Change Password
Now here you will see Dashboard of Grafana
#5:Install WMI Exporter on Install Grafana on Windows 2022 Server Base
For Windows hosts, you are going to use the Windows exporter.
You can download the latest version of windows installer from here
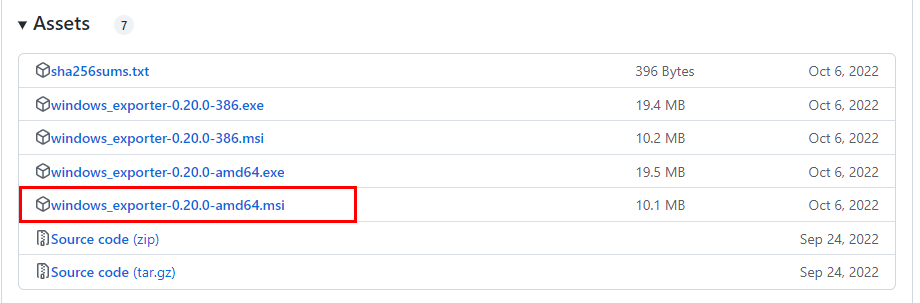
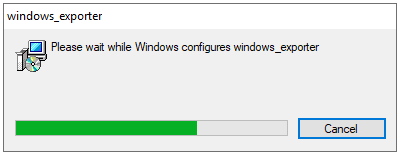
When the download is done, simply click on the MSI file and start running the installer.
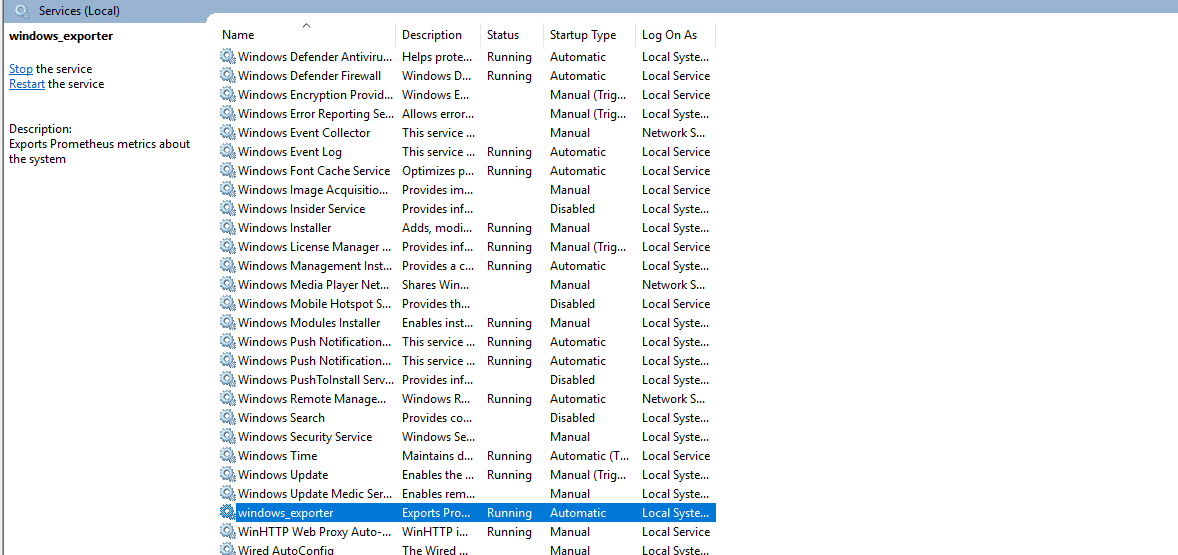
After Installation of WMI Exporter lets check its sucessfully installed or not
So go to services and search windows exporter.
Make sure windows exporter service is running.
Now that your exporter is running, it should start exposing metrics on
http://localhost:9182/metrics
#6:Update Prometheus Configuration file on Install Grafana on Windows 2022 Server Base
Go to the Prometheus file and open Prometheus.yml file and
Update config file with below code:
 - job_name: "WMI Exporter"

    # metrics_path defaults to '/metrics'
    # scheme defaults to 'http'.

    static_configs:
      - targets: ["Host_ip:9182"]
Now save the file nd exit
After changing in config file you need to restart prometheus server
To restart, open the command prompt and locate the “Prometheus” root directory.
And run the below command to restart prometheus
prometheus.exe --config.file prometheus.yml --web.listen-address ":9090" --storage.tsdb.path "data"
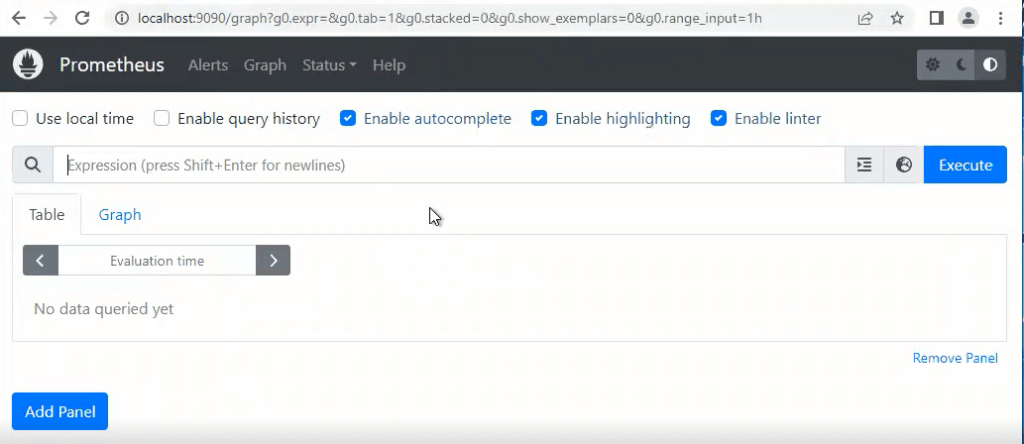
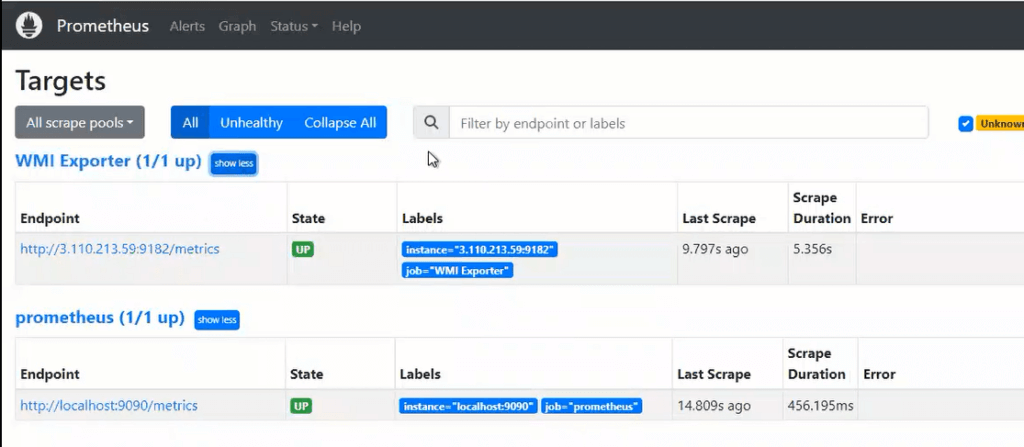
Hit the URL in your web browser to check weather our target is successfully scraped by Prometheus or not
https://localhost:9090/targets
#7:Configure Prometheus as Grafana DataSource
Once you logged into Grafana Now first Navigate to Settings Icon ->> Configuration ->> data sources
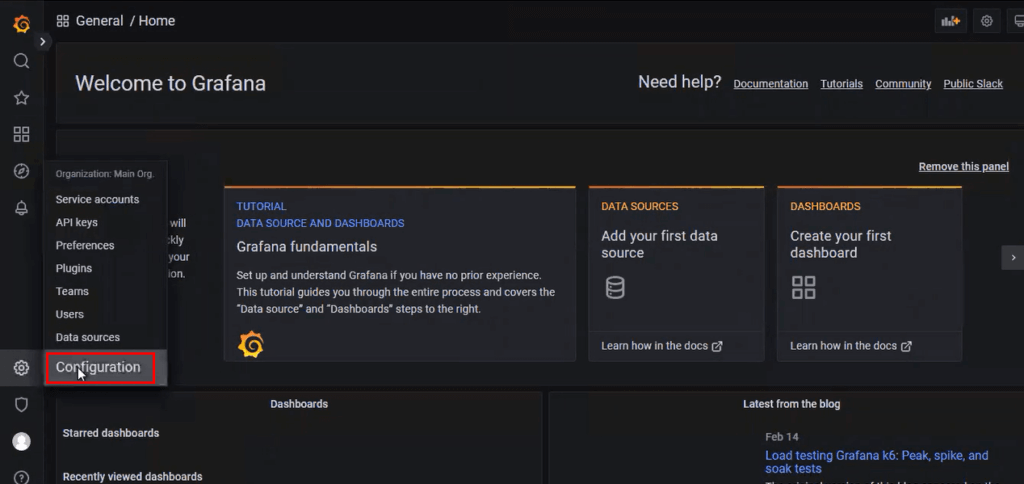
Now lets click on Add Data sources and select Prometheus
Now configure Prometheus data source by providing Prometheus URL
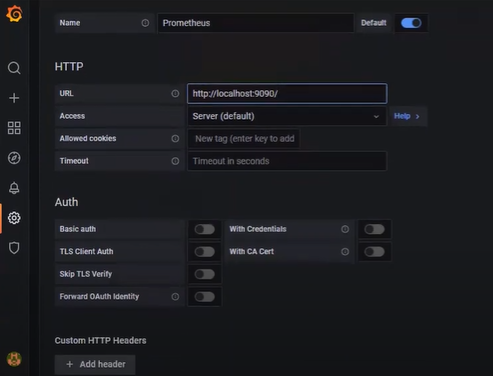
As per your requirement you can do other changes or you can also keep the remaining configuration as default.
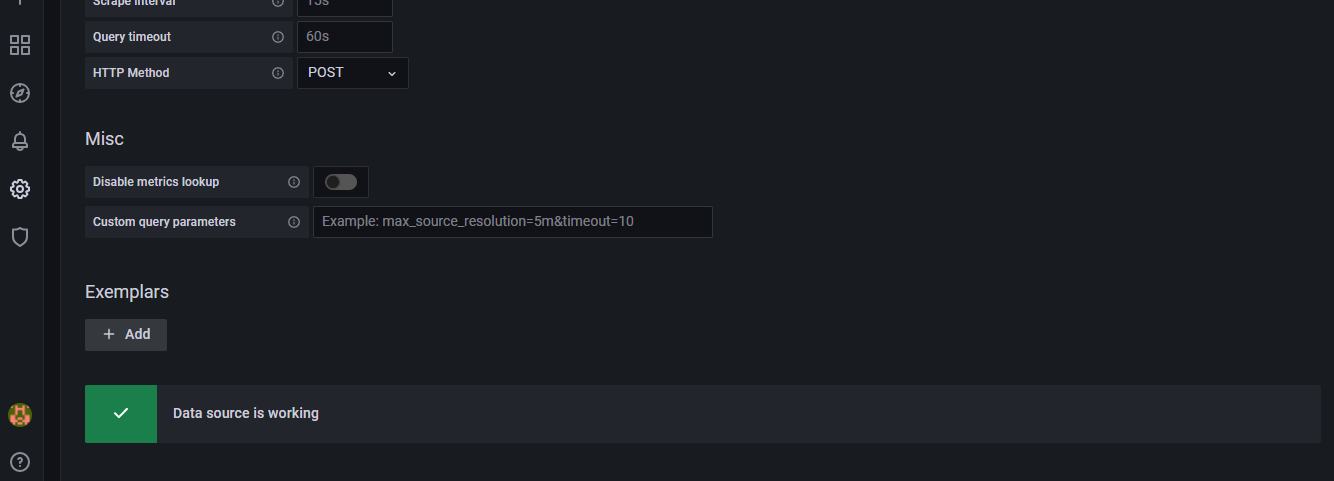
Now click on Save & test so it will prompt a message Data Source is working.
#8:Creating Grafana Dashboad to monitor Windows server 2022 base
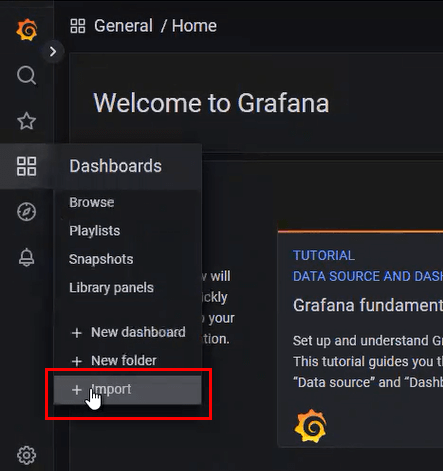
Now lets build a dashboard in Grafana so then it will able to reflect the metrics of the Windows system.
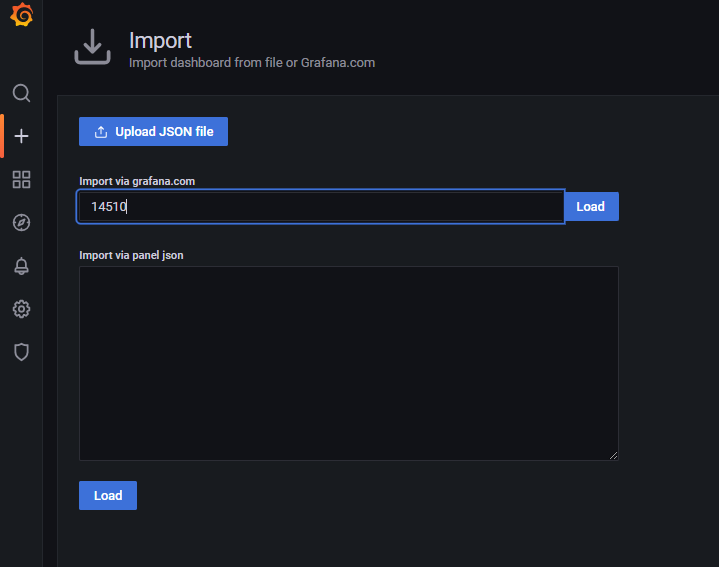
So we will use 14510 to import Grafana.com, Lets go to Grafana Home page select “Import”
On the next window, simply enter the dashboard ID in the corresponding field
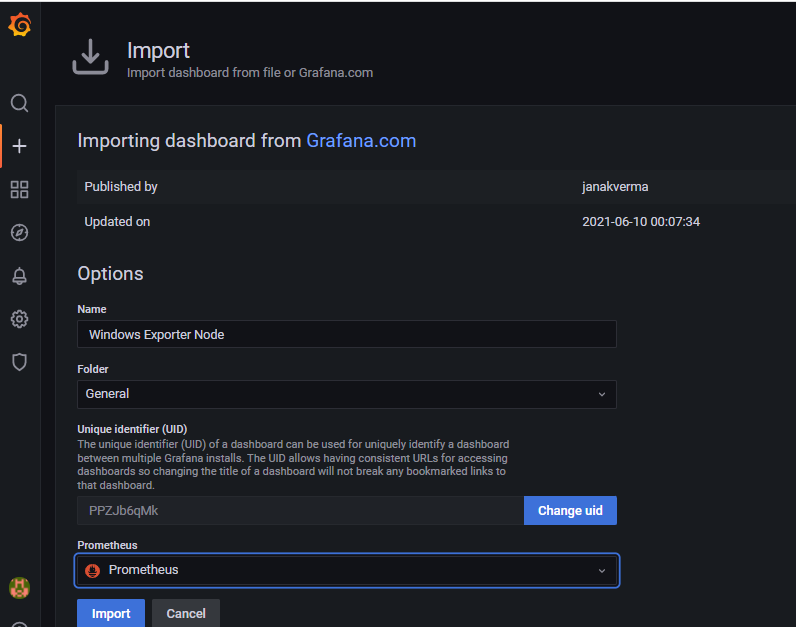
Now provide the name and select the Prometheus Datasource and click on Import.
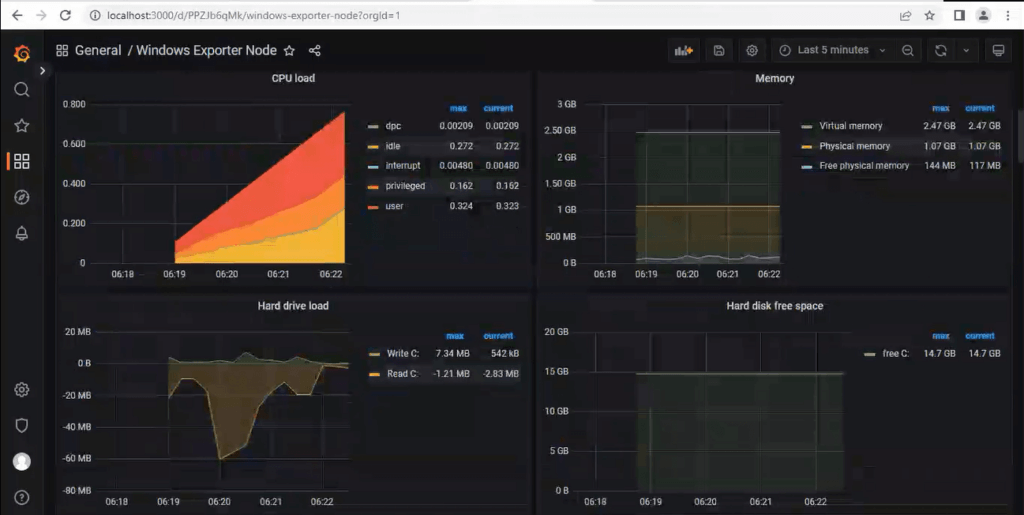
There you are done with the setup. Now your Dashboard is running up!.
Conclusion:
In this article we have covered How Install Install Prometheus and Grafana on Windows with WMI Exporter on Windows Server 2022 base, Configure Prometheus as Grafana DataSource.
Related Articles:
Very well explained. Thanks for the wonderful article.