In this article, we’ll walk through the process of setting up a Flask API that not only exposes essential HTTP metrics for Prometheus but also integrates OpenTelemetry for enhanced observability. In this guide, we’ll focus on its use for gathering HTTP metrics and integrating them into a broader monitoring system. By the end of this guide, you’ll have a Flask application running on an Ubuntu EC2 instance that monitors performance metrics like request counts, durations, and more.
Table of Contents
Prerequisites
- AWS Account with Ubuntu 24.04 LTS EC2 Instance.
- Python 3, pip, python virtual environment installed on the system.
- Basic understanding of Flask and Python.
Step #1:Set Up Ubuntu EC2 Instance
First update the package list.
sudo apt update
Install Python 3, python virtual environment, pip.
sudo apt install -y python3 python3-venv python3-pip
Make a new directory for our project setup.
mkdir flask-http-metrics
navigate to that directory.
cd flask-http-metrics
Since pip doesn’t work globally, use a virtual environment.
Set up a Python Virtual Environment. A virtual environment isolates your Python environment from the global system environment, making dependency management easier and avoiding conflicts.
python3 -m venv venv
Activate the virtual environment to use it.
source venv/bin/activate
Step #2:Install Required Packages
Install Flask and OpenTelemetry libraries inside the virtual environment.
pip install flask opentelemetry-api opentelemetry-sdk opentelemetry-instrumentation-flask
Install the required package for OTLP exporter.
pip install opentelemetry-exporter-otlp
Install the prometheus flask exporter.
pip install prometheus-flask-exporter
Step #3:Create and Instrument the Flask Application
Create the Flask API with Prometheus metrics and OpenTelemetry.
nano app.py
Add the following code into the file.
from flask import Flask
from prometheus_flask_exporter import PrometheusMetrics
from opentelemetry.instrumentation.flask import FlaskInstrumentor
from opentelemetry.sdk.trace import TracerProvider
from opentelemetry.sdk.trace.export import BatchSpanProcessor
from opentelemetry.exporter.otlp.proto.grpc.trace_exporter import OTLPSpanExporter

# Initialize Flask app
app = Flask(__name__)

# Initialize Prometheus metrics
metrics = PrometheusMetrics(app)

# Initialize OpenTelemetry
trace_exporter = OTLPSpanExporter(endpoint="http://localhost:4317")  # Adjust if using remote OpenTelemetry Collector
provider = TracerProvider()
processor = BatchSpanProcessor(trace_exporter)
provider.add_span_processor(processor)

# Instrument Flask app with OpenTelemetry
FlaskInstrumentor().instrument_app(app)

# Add routes
@app.route('/hello')
def hello():
    return "Hello, World!"

@app.route('/health')
def health():
    return {"status": "healthy"}

if __name__ == '__main__':
    app.run(host='0.0.0.0', port=8080)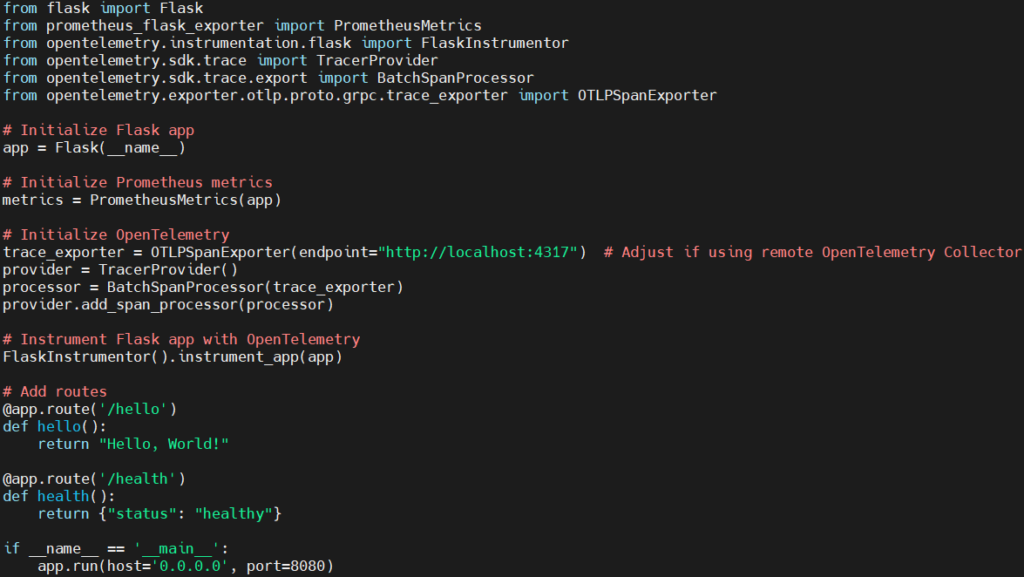
Explanation of the code:
- Importing Necessary Libraries:
- Flask: The core Flask framework for building web APIs.
- PrometheusMetrics: This is used to expose HTTP metrics (such as request counts, durations) from the Flask app to Prometheus.
- FlaskInstrumentor: This is part of OpenTelemetry, used to automatically instrument the Flask application to collect traces.
- TracerProvider: This defines the trace provider, which is responsible for creating traces and spans.
- BatchSpanProcessor: It collects and processes spans in batches to improve performance and reduce overhead.
- OTLPSpanExporter: This exporter sends the collected spans to an OpenTelemetry Collector (or backend) via the OTLP (OpenTelemetry Protocol).
- Flask Application Initialization:
- Here, a new Flask application instance is created, which will handle incoming HTTP requests.
- Prometheus Metrics Initialization:
- This initializes the Prometheus metrics integration for the Flask app. The
PrometheusMetricsobject will automatically expose Prometheus-compatible metrics, such as request counts and latencies, under the/metricsendpoint.
- This initializes the Prometheus metrics integration for the Flask app. The
- OpenTelemetry Setup:
- OTLPSpanExporter: This creates an exporter that sends the trace data to an OpenTelemetry Collector (or a compatible backend) over gRPC. The
endpointparameter specifies the collector’s URL. Here, it’s set tohttp://localhost:4317, which is a typical endpoint for local setups. - TracerProvider: It acts as a container for trace resources. It provides a way to create and manage spans.
- BatchSpanProcessor: The spans collected by OpenTelemetry will be sent in batches to the exporter for improved performance.
- The
BatchSpanProcessoris added to theTracerProvider, which processes and exports the collected spans.
- OTLPSpanExporter: This creates an exporter that sends the trace data to an OpenTelemetry Collector (or a compatible backend) over gRPC. The
- Instrumenting the Flask App with OpenTelemetry:
- FlaskInstrumentor().instrument_app(app) This line automatically instruments the Flask app for tracing using OpenTelemetry. By calling
instrument_app(), the Flask application is wrapped with OpenTelemetry tracing functionality, which means every HTTP request that comes to the application will generate trace spans.
- FlaskInstrumentor().instrument_app(app) This line automatically instruments the Flask app for tracing using OpenTelemetry. By calling
- Defining Routes:
- This route (/hello), when accessed via HTTP (GET), will return a simple “Hello, World!” message. This is just a basic route to demonstrate the functionality of the API.
- The
/healthroute is a health check endpoint, typically used in production environments to monitor whether the service is running and functioning correctly. It returns a JSON response indicating the status of the application.
- Running the Flask App:
- This starts the Flask application when the script is run directly. The app will listen on all network interfaces (
0.0.0.0) and will be accessible on port8080. - host=’0.0.0.0′: This makes the app accessible from any IP address, which is useful if you want to access the API remotely (e.g., on a server or EC2 instance).
- port=8080: The port on which the Flask app will run.
- This starts the Flask application when the script is run directly. The app will listen on all network interfaces (
Step #4:Start the Flask Application
Run the Flask API using following command.
python app.py
Your Flask app will be available on port 8080. Visit http://<EC2-Public-IP>:8080/hello to see the “Hello, World!” response.

Prometheus metrics will be available at /metrics. Visit http://<EC2-Public-IP>:8080/metrics to view metrics.

Conclusion:
By following these steps, you’ve created a Flask API that not only serves requests but also exposes HTTP metrics. This setup provides essential monitoring tools, enhancing your application’s observability and diagnostics. With OpenTelemetry, you’re also able to capture traces of each HTTP request, helping you understand the internal workings of your application and pinpoint any potential bottlenecks or issues.
Related Articles:
Integrate OpenTelemetry for PHP Application with Zero-Code Instrumentation
Reference: