In this article, we will learn how to seamlessly integrate Linux servers with Grafana Cloud. Grafana Cloud offers powerful monitoring and visualization capabilities for your infrastructure, enabling you to gain insights into the performance and health of your systems. Integrating Linux servers with Grafana Cloud allows you to collect metrics, logs, and traces from your servers and visualize them in customizable dashboards.
Table of Contents
Prerequisites
- AWS Account with Ubuntu 22.04 LTS EC2 Instance.
- Basic knowledge of AWS services and Grafana.
- Grafana Cloud account.
Create a Grafana Cloud Account by following the official documentation
Step #1:Install Grafana Agent on Ubuntu
The Grafana Agent is a lightweight, open-source agent that collects metrics, logs, and traces from your Linux servers and sends them to Grafana Cloud.
So first create the directory for the apt keyrings
sudo mkdir -p /etc/apt/keyrings/
Download and import the Grafana GPG key using following command.
wget -q -O - https://apt.grafana.com/gpg.key | gpg --dearmor | sudo tee /etc/apt/keyrings/grafana.gpg > /dev/null
Add Grafana package repository using following command.
echo "deb [signed-by=/etc/apt/keyrings/grafana.gpg] https://apt.grafana.com stable main" | sudo tee /etc/apt/sources.list.d/grafana.list
Update the repositories
sudo apt-get update

After updating the repository. Install the Grafana Agent
sudo apt-get install grafana-agent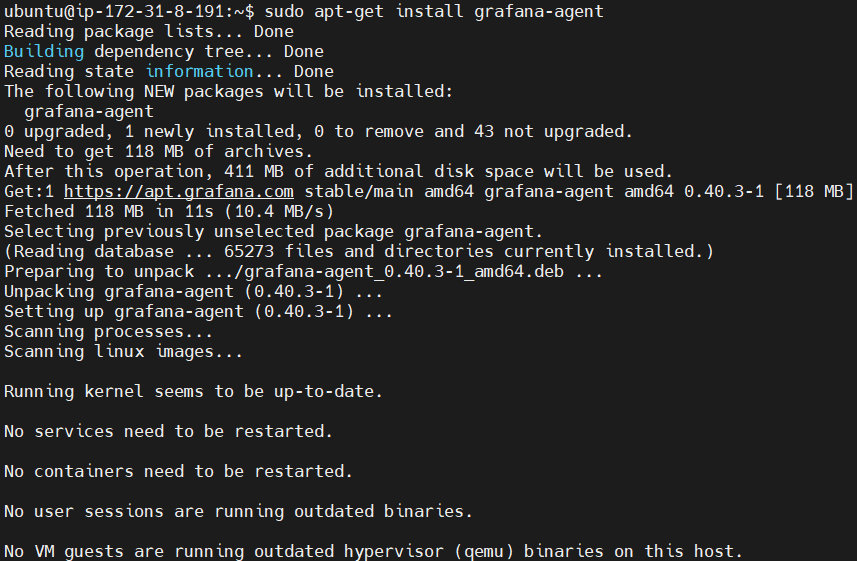
Start the grafana agent by running the following command
sudo systemctl start grafana-agent
After this enable the grafana agent
sudo systemctl enable grafana-agent
You can check if its running properly or not by running the following command.
sudo systemctl status grafana-agent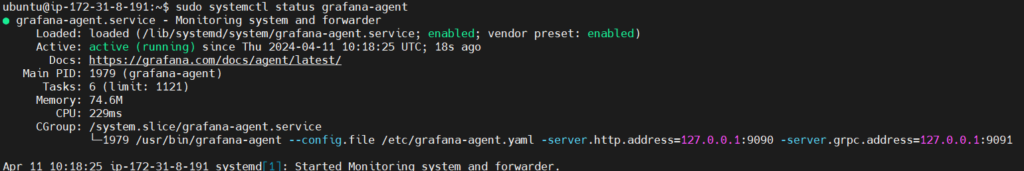
Step #2:Install Linux Server Integration for Grafana Cloud
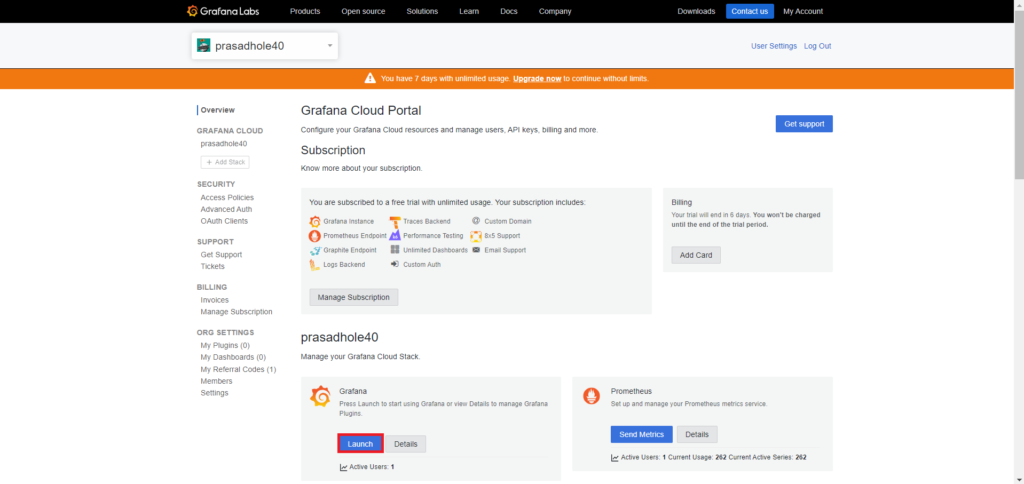
First Login to Grafana Cloud and launch the Grafana instance.
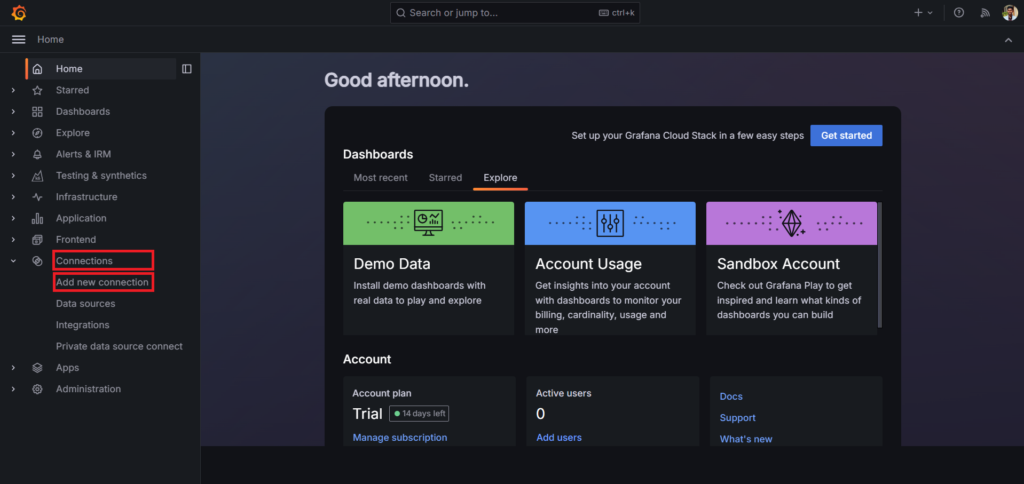
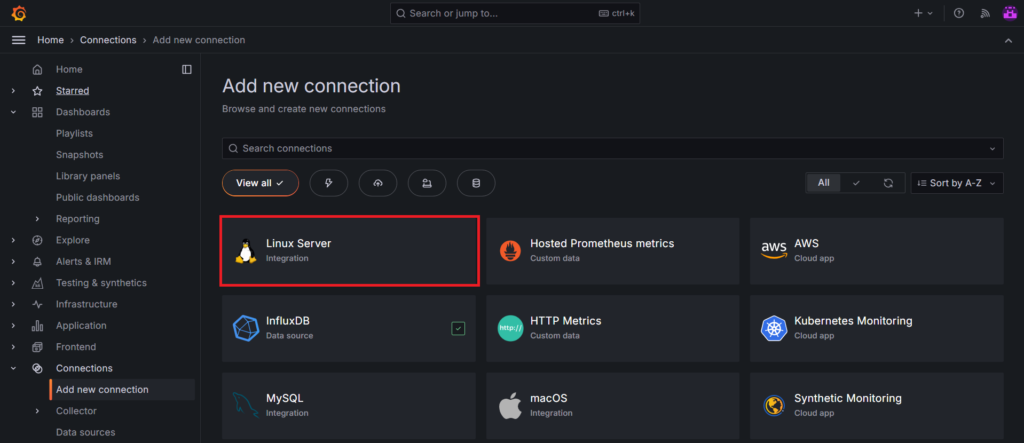
then select the Connections > Add new connections from the home bar.
Select the Linux Server
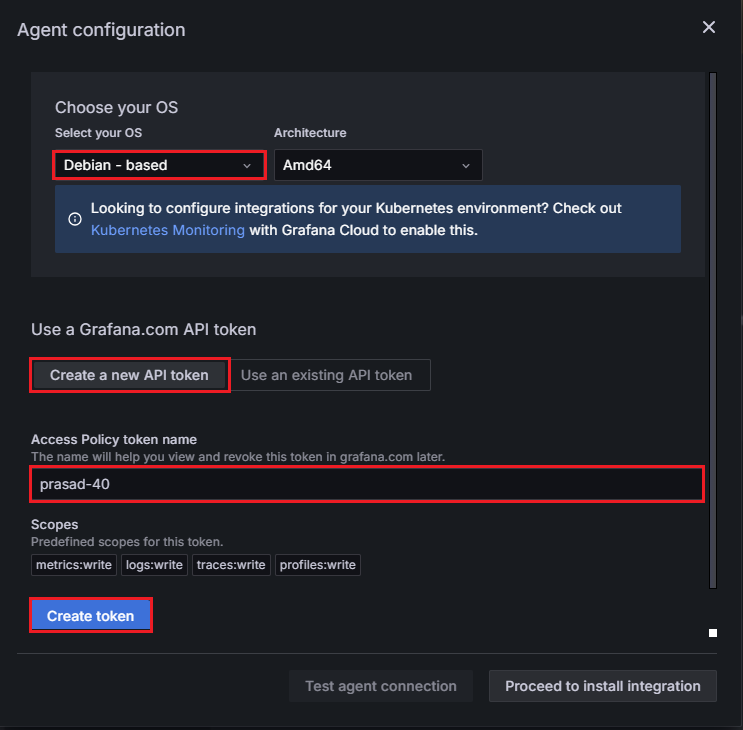
Click on Grafana agent and choose the operating system on which your linux server is running. Then click on Create a new API token or you can use an existing on if you have, give the Access policy token name and click on create token.
This will generate API token which we will use to set up the grafana agent.
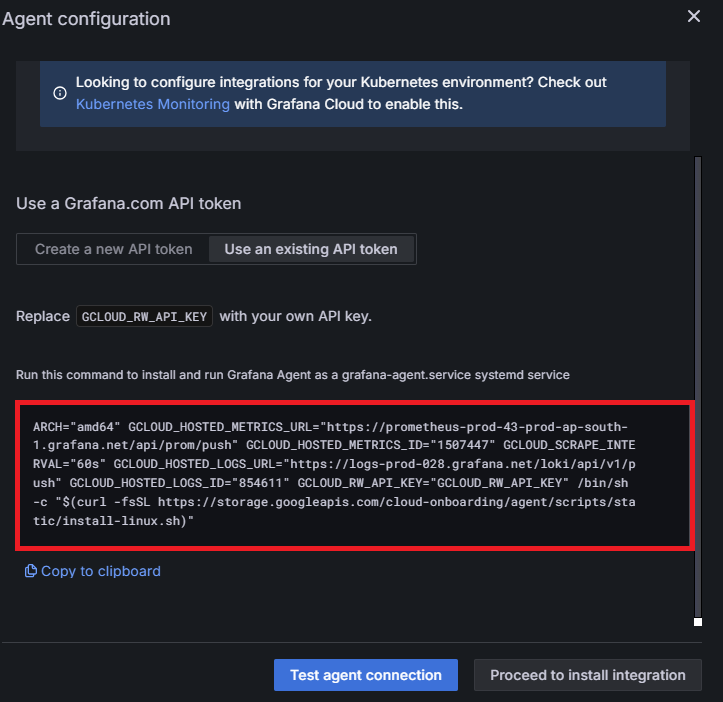
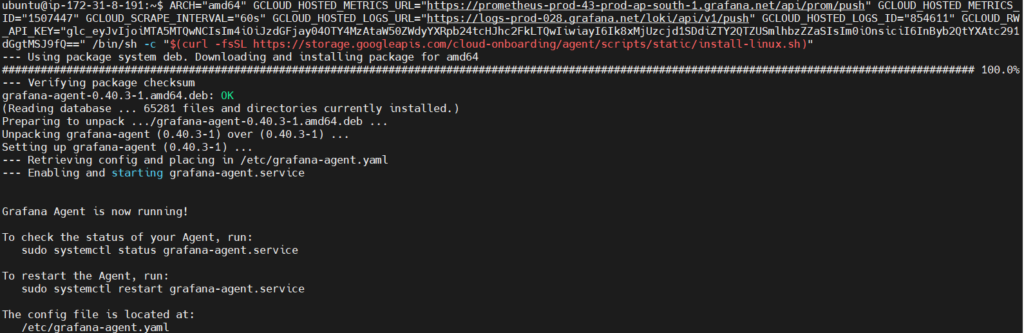
Copy the code run it to install and run grafana agent as a grafana-agent.service systemd service.
Put the API token key generated before instead of “GCLOUD_RW_API_KEY“
Step #3:Modify the Grafana agent yaml file
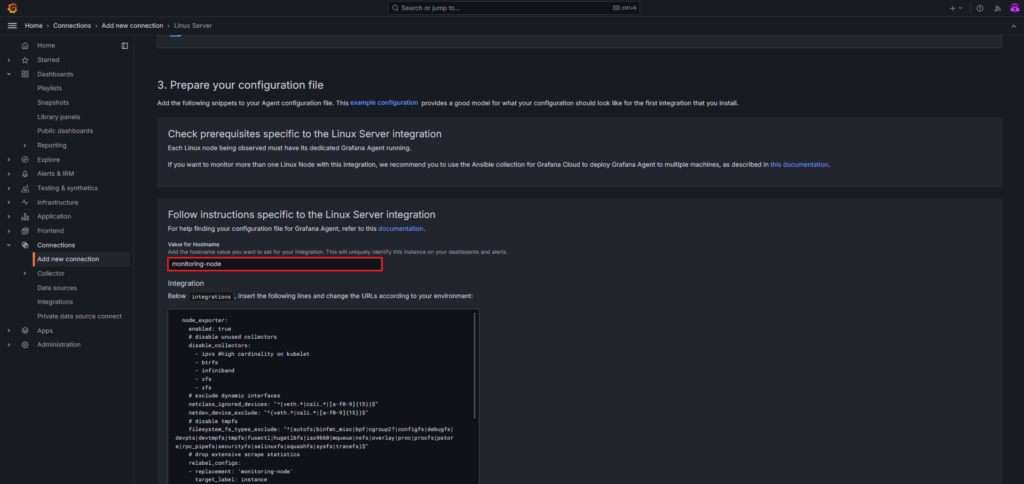
Now go back to the grafana cloud and scroll down.
In prepare your configuration file give the value for hostname. Here I’ve given monitoring-node
go to the /etc/grafana-agent.yaml by using following command.
sudo nano /etc/grafana-agent.yaml
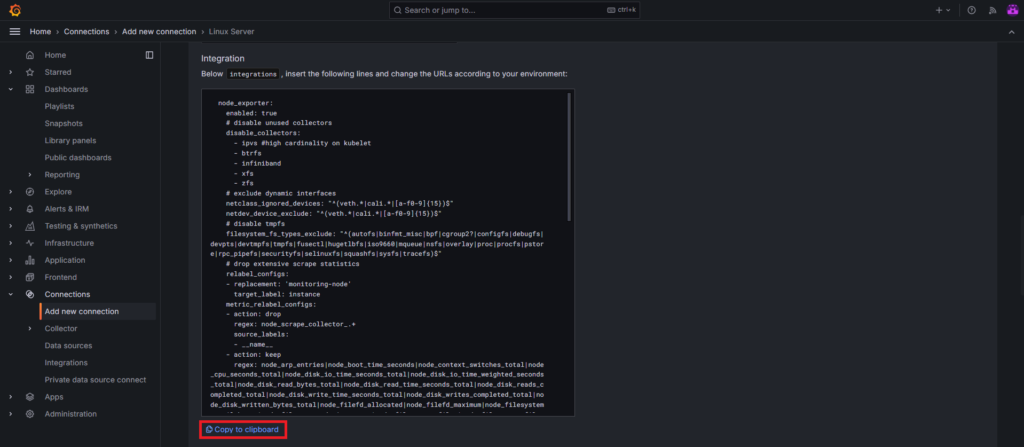
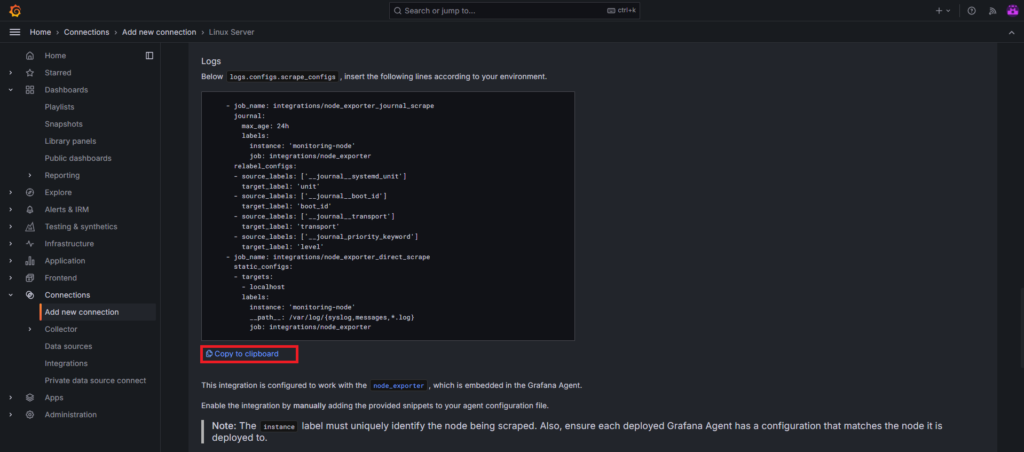
Then copy the Integration and logs code lines from the grafana cloud and insert it in /etc/grafana-agent.yaml file according to your environment.
integrations:
prometheus_remote_write:
- basic_auth:
password: glc_eyJvIjoiMTA5MTQwNCIsIm4iOiJzdGFjay04OTY4MzAtaW50ZWdyYXRpb24tcHJhc2FkLTQwIiwiayI6Ik8xMjUzcjd1SDdiZTY2QTZUSmlhbzZZaSIsIm0iOnsiciI6InByb2QtYXAtc291dGgtMSJ9fQ==
username: 1507447
url: https://prometheus-prod-43-prod-ap-south-1.grafana.net/api/prom/push
agent:
enabled: true
relabel_configs:
- action: replace
source_labels:
- agent_hostname
target_label: instance
- action: replace
target_label: job
replacement: "integrations/agent-check"
metric_relabel_configs:
- action: keep
regex: (prometheus_target_sync_length_seconds_sum|prometheus_target_scrapes_.*|prometheus_target_interval.*|prometheus_sd_discovered_targets|agent_build.*|agent_wal_samples_appended_total|process_start_time_seconds)
source_labels:
- __name__
# Add here any snippet that belongs to the `integrations` section.
# For a correct indentation, paste snippets copied from Grafana Cloud at the beginning of the line.
node_exporter:
enabled: true
# disable unused collectors
disable_collectors:
- ipvs #high cardinality on kubelet
- btrfs
- infiniband
- xfs
- zfs
# exclude dynamic interfaces
netclass_ignored_devices: "^(veth.*|cali.*|[a-f0-9]{15})$"
netdev_device_exclude: "^(veth.*|cali.*|[a-f0-9]{15})$"
# disable tmpfs
filesystem_fs_types_exclude: "^(autofs|binfmt_misc|bpf|cgroup2?|configfs|debugfs|devpts|devtmpfs|tmpfs|fusectl|hugetlbfs|iso9660|mqueue|nsfs|overlay|proc|procfs|pstore|rpc_pipefs|securityfs|selinuxfs|squashfs|sysfs|tracefs)$"
# drop extensive scrape statistics
relabel_configs:
- replacement: 'monitoring-node'
target_label: instance
metric_relabel_configs:
- action: drop
regex: node_scrape_collector_.+
source_labels:
- __name__
- action: keep
regex: node_arp_entries|node_boot_time_seconds|node_context_switches_total|node_cpu_seconds_total|node_disk_io_time_seconds_total|node_disk_io_time_weighted_seconds_total|node_disk_read_bytes_total|node_disk_read_time_seconds_total|node_disk_reads_completed_total|node_disk_write_time_seconds_total|node_disk_writes_completed_total|node_disk_written_bytes_total|node_filefd_allocated|node_filefd_maximum|node_filesystem_avail_bytes|node_filesystem_device_error|node_filesystem_files|node_filesystem_files_free|node_files>
source_labels:
- __name__
logs:
configs:
- clients:
- basic_auth:
password: glc_eyJvIjoiMTA5MTQwNCIsIm4iOiJzdGFjay04OTY4MzAtaW50ZWdyYXRpb24tcHJhc2FkLTQwIiwiayI6Ik8xMjUzcjd1SDdiZTY2QTZUSmlhbzZZaSIsIm0iOnsiciI6InByb2QtYXAtc291dGgtMSJ9fQ==
username: 854611
url: https://logs-prod-028.grafana.net/loki/api/v1/push
name: integrations
positions:
filename: /tmp/positions.yaml
scrape_configs:
# Add here any snippet that belongs to the `logs.configs.scrape_configs` section.
# For a correct indentation, paste snippets copied from Grafana Cloud at the beginning of the line.
- job_name: integrations/node_exporter_journal_scrape
journal:
max_age: 24h
labels:
instance: 'monitoring-node'
job: integrations/node_exporter
relabel_configs:
- source_labels: ['__journal__systemd_unit']
target_label: 'unit'
- source_labels: ['__journal__boot_id']
target_label: 'boot_id'
- source_labels: ['__journal__transport']
target_label: 'transport'
- source_labels: ['__journal_priority_keyword']
target_label: 'level'
- job_name: integrations/node_exporter_direct_scrape
static_configs:
- targets:
- localhost
labels:
instance: 'monitoring-node'
__path__: /var/log/{syslog,messages,*.log}
job: integrations/node_exporter
metrics:
configs:
- name: integrations
remote_write:
- basic_auth:
password: glc_eyJvIjoiMTA5MTQwNCIsIm4iOiJzdGFjay04OTY4MzAtaW50ZWdyYXRpb24tcHJhc2FkLTQwIiwiayI6Ik8xMjUzcjd1SDdiZTY2QTZUSmlhbzZZaSIsIm0iOnsiciI6InByb2QtYXAtc291dGgtMSJ9fQ==
username: 1507447
url: https://prometheus-prod-43-prod-ap-south-1.grafana.net/api/prom/push
scrape_configs:
# Add here any snippet that belongs to the `metrics.configs.scrape_configs` section.
# For a correct indentation, paste snippets copied from Grafana Cloud at the beginning of the line.
global:
scrape_interval: 60s
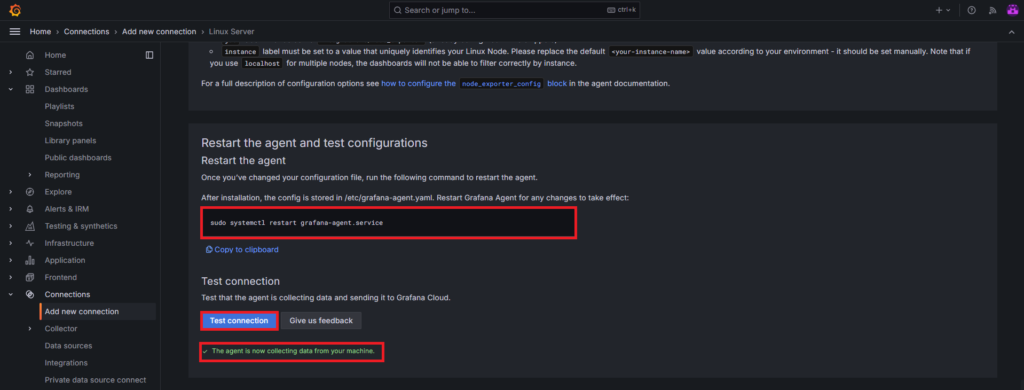
wal_directory: /tmp/grafana-agent-walsave the file and restart the grafana agent service
systemctl restart grafana-agent.serviceGive the password to authenticate.
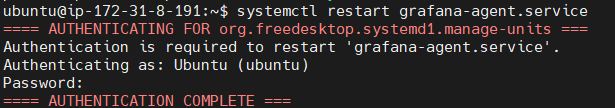
If you don’t know the password you can change it using following commanad.
sudo passwd ubuntuscroll down and click on Test connections to test that the agent is collecting data and sending it to Grafana Cloud.
You will get the message “The agent is now collecting data from your machine.“
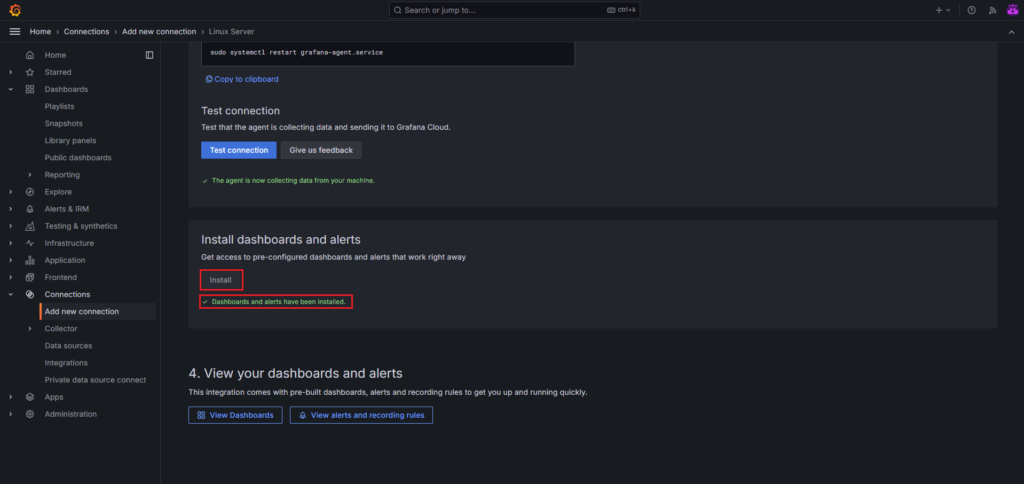
Step #4:Install Dashboards and alerts on Grafana Cloud
Next click on Install to install the pre-configured dashboards and alerts.
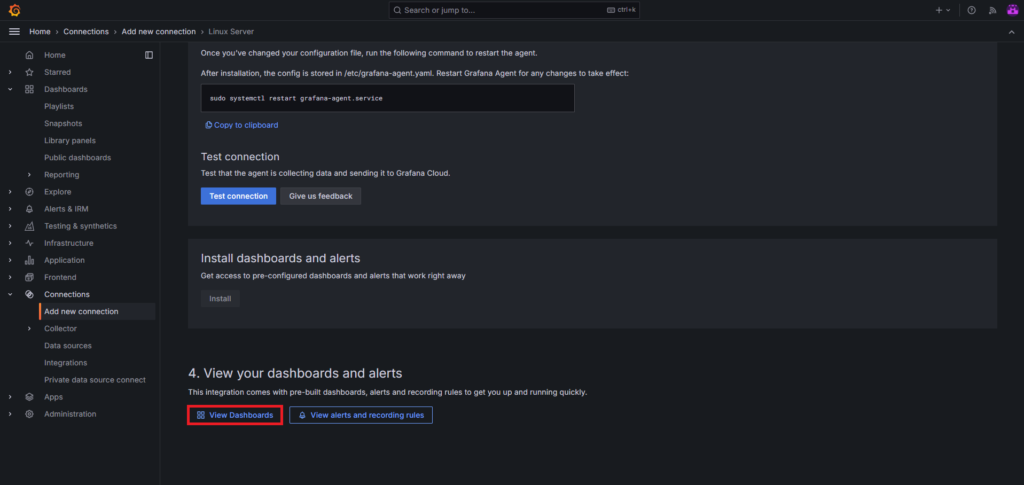
Now click on View Dashboards.
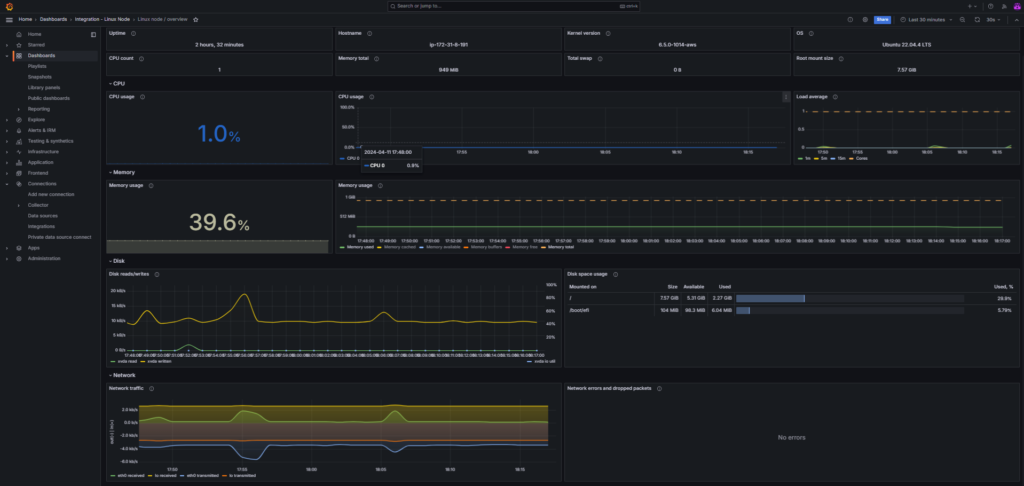
You will see the many pre-build dashboards installed. For now we will select
Linux node/overviewDashboard.
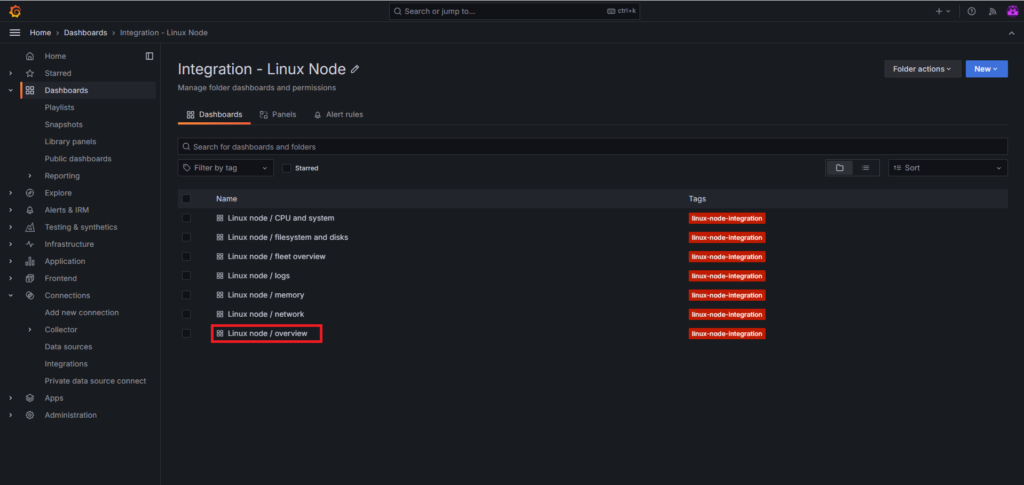
The dashboard displays various graphs and metrics which are related to server performance.
Like CPU usage, memory usage, network traffice and many more.
Conclusion:
Integrating Linux servers with Grafana Cloud provides valuable insights into the performance and health of your infrastructure. You can seamlessly integrate Linux server with Grafana Cloud. By following the steps outlined in this guide, you can easily set up monitoring and visualization for your Linux servers and gain visibility into their operation. Whether you’re managing a single server or a large-scale deployment, Grafana Cloud offers the tools you need to monitor and optimize your infrastructure effectively.
Related Articles:
How to Create Account in Grafana Cloud
Reference: