In this article, we will learn how to create a Grafana Cloud account, enabling you to harness the powerful tools it offers for monitoring and understanding your systems’ performance. It is a versatile platform that caters to developers, data scientists, and operations engineers alike, providing seamless visualization and analysis of metrics, logs, and traces.
Table of Contents
What is Grafana cloud?
Grafana Cloud is a fully-managed cloud-hosted observability platform. In simpler terms, it’s a service that helps you monitor and analyze the performance of your applications and infrastructure, all hosted and maintained by Grafana Labs.
Here are some key features:
- Metrics, Logs, and Traces: It allows you to collect, store, and visualize data from various sources, including metrics (performance indicators), logs (event records), and traces (application execution paths).
- Pre-built Dashboards: It comes with pre-built dashboards for common applications and services, saving you time on setting up visualizations.
- Ease of Use: No need to install or maintain your own Grafana server. Grafana Cloud takes care of everything, making it easier to get started with observability.
- Scalability: The platform automatically scales to meet your needs, so you don’t have to worry about infrastructure limitations.
- Open Source Integration: It integrates seamlessly with popular open-source tools like Prometheus and Grafana itself.
- Additional Features: It offers functionalities like performance testing and incident response management through integrated services like Grafana k6 and Grafana Incident.
Step #1:Create Account in Grafana Cloud
To sign up begin by opening your preferred web browser and directing it to the following website. You can do this by entering the following URL into your browser’s address bar.
Create Account in Grafana Cloud
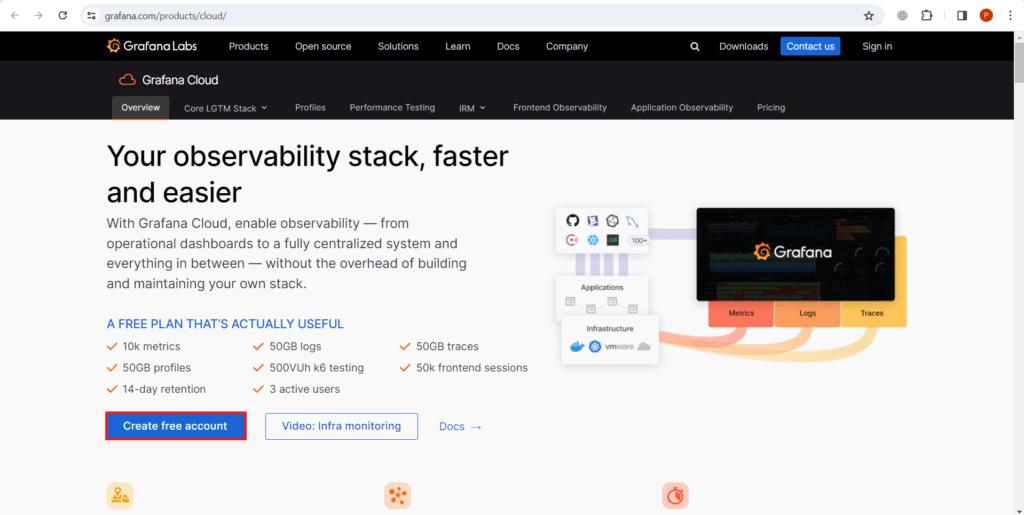
Upon reaching the homepage, locate the “Create free account” button, and click on it to initiate the sign-up process. This action will redirect you to the sign-up page where you can proceed to create your account.
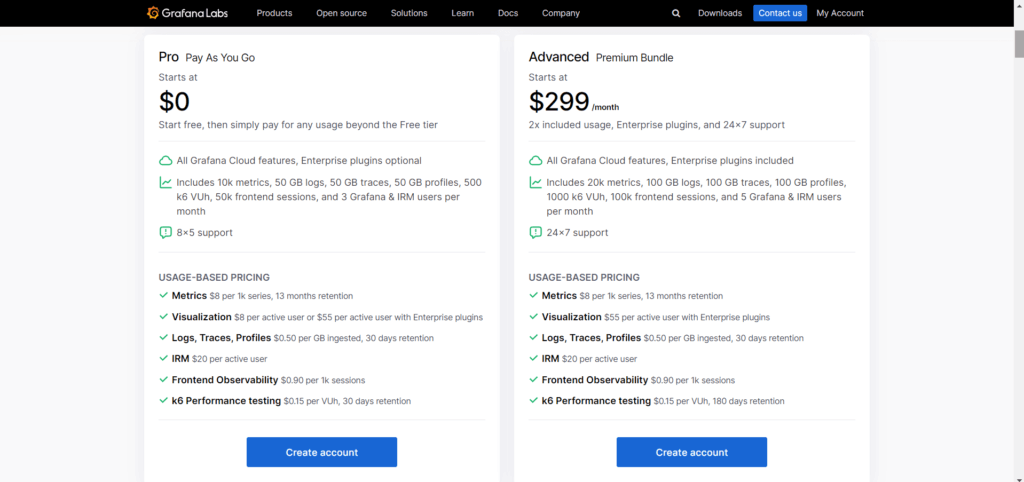
You can choose different plan instead of free as your requirement. Just scroll down and you will the section called “Your guide to Grafana Cloud plans“. click on see pricing details.

Other than Free plan, Pro Pay As You Go and Advanced Premium Bundle are the two pricing plans displayed.
- Pro Pay As You Go plan starts at $0 per month. It includes all Grafana Cloud features, but Enterprise plugins are optional and additional usage beyond the Free tier incurs charges.
- Advanced Premium Bundle starts at $299 per month. This plan includes all Grafana Cloud features with Enterprise plugins included, along with 24/7 support.
Step #2:Provide Your login Information
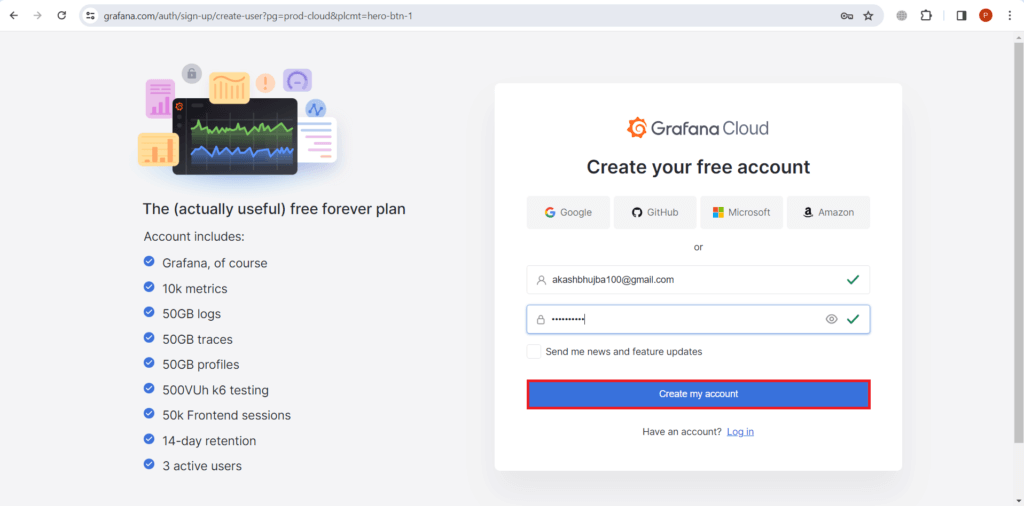
Fill in the required fields on the sign-up page with the necessary information to create your account. Typically, you will need to provide your email address and password.
Step #3:Verify Your Email Address
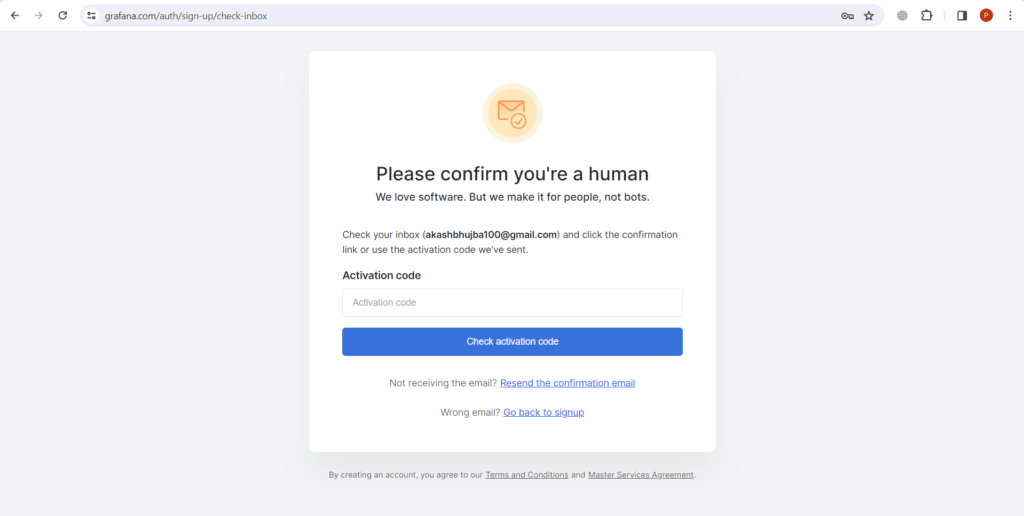
After entering your details, Grafana Cloud will send a verification email to the address you provided. Access your email inbox and locate the email. Follow the instructions within the email to verify your email address. Remember to check your spam or junk folder if you don’t see the email in your inbox. Enter the activation code and click on check activation code to activate your account.
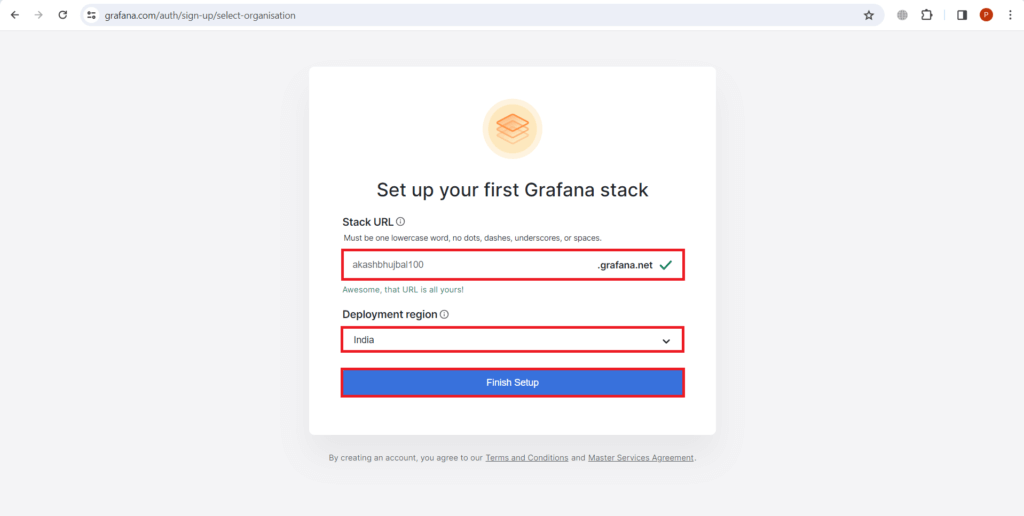
Step #4:Setting up your first Grafana stack
After verifying your email address it will ask you to give the Stack url and region.
Enter a unique URL that will be used to identify your Grafana stack. Also pick the region. After this click on Finish setup.
Step #5:Grafana Cloud Insights
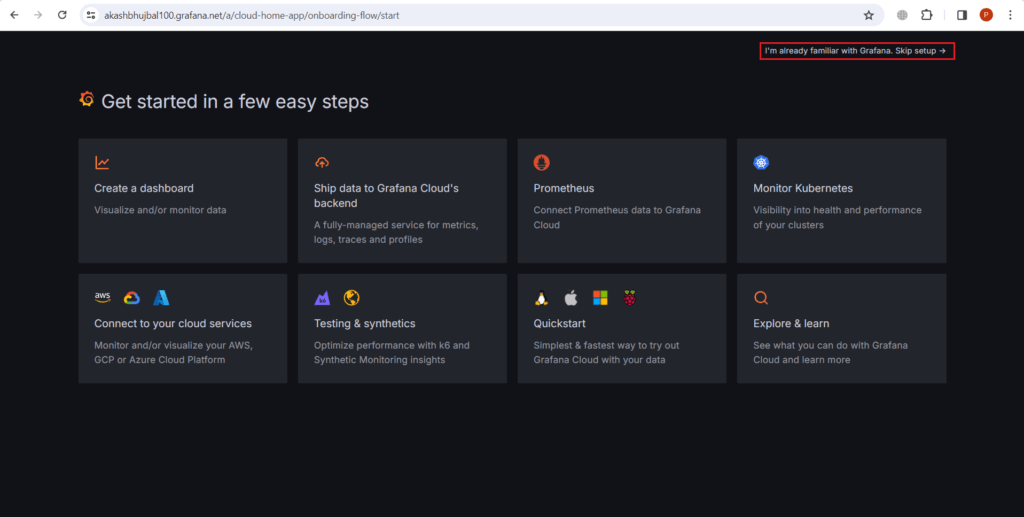
It outlines eight options to help you get started with Grafana Cloud.
- Create a dashboard: This lets you create a visual representation of your data for easier analysis.
- Ship data to Grafana Cloud’s backend: This involves sending your data to Grafana Cloud for storage and analysis.
- Prometheus: This is a data collection and storage service supported by Grafana Cloud.
- Monitor Kubernetes: This option allows you to monitor the health and performance of your Kubernetes clusters.
- Connect to your cloud services: This lets you connect your cloud storage services (AWS, GCP, Azure) to Grafana Cloud.
- Testing & synthetics: This enables you to run synthetic monitoring tests to check the performance of your applications.
- Quickstart: This provides the simplest and fastest way to try out Grafana Cloud with your data.
- Explore & learn: This section offers resources to help you learn more about what you can do with Grafana Cloud.
This help you to get familiar with Grafana or if you are already familiar with it then you can click on “I’m already familiar with Grafana Skip setup.”
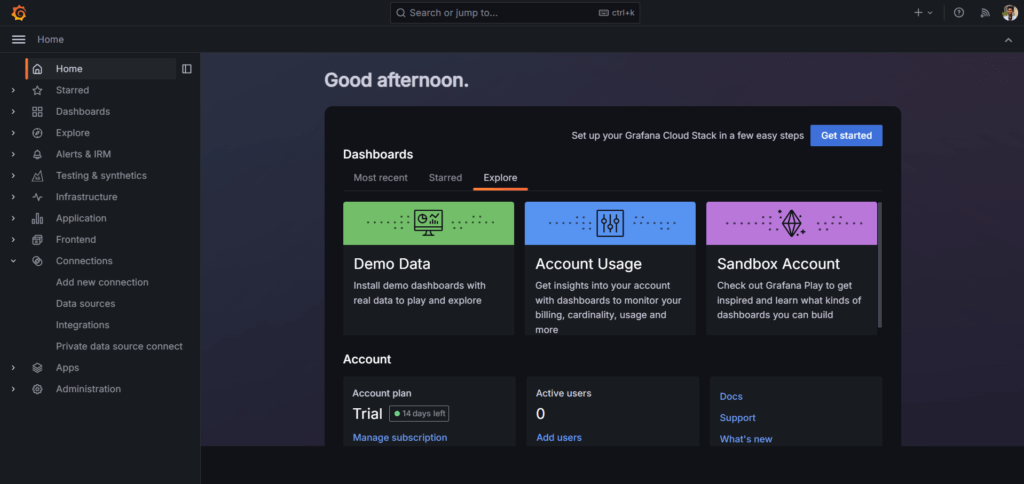
Below is the home page of Grafana.
Conclusion:
Creating a Grafana Cloud account is a straightforward process that opens the door to a wealth of possibilities for monitoring and understanding your systems’ performance. Whether you’re a developer, data scientist, or operations engineer, Grafana Cloud provides the tools you need to visualize and analyze metrics, logs, and traces seamlessly. So follow the above steps to create your own account.
Related Articles:
How to Monitor Elasticsearch with Prometheus and Grafana
Reference:
