In this article, we will learn monitor Elasticsearch using Prometheus and Grafana on an Ubuntu server. Elasticsearch, a powerful search and analytics engine, requires vigilant monitoring for optimal performance. Prometheus gathers Elasticsearch metrics, while Grafana provides customizable dashboards for visualizing this data. By integrating these tools, users can proactively manage and monitor Elasticsearch clusters, ensuring stability, scalability, and efficient resource utilization.
Table of Contents
Prerequisites
- AWS Account with Ubuntu 22.04 LTS EC2 Instance.
- Basic knowledge of AWS services, Prometheus and Grafana.
Step #1:Install Java Development Kit (JDK)
Update the system before starting the installation.
sudo apt update 
Elasticsearch requires Java to run. Install OpenJDK 8 by running the following command.
sudo apt-get install openjdk-8-jdk
Set the JAVA_HOME environment variable.
export JAVA_HOME=/usr/lib/jvm/java-8-openjdk
export PATH=$PATH:/usr/lib/jvm/java-8-openjdk/bin
Step #2:Install Elasticsearch on Ubuntu
First update the system again.
sudo apt update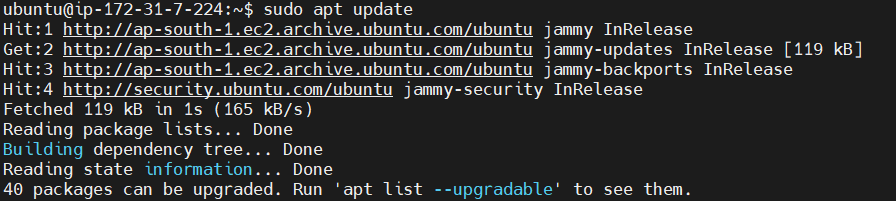
Download .deb file for elasticsearch.
wget https://download.elastic.co/elasticsearch/release/org/elasticsearch/distribution/deb/elasticsearch/2.3.1/elasticsearch-2.3.1.deb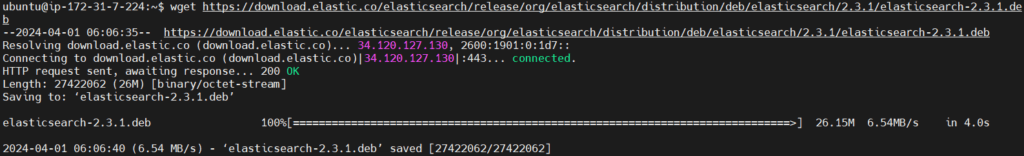
To install the .deb file use dpkg command.
sudo dpkg -i elasticsearch-2.3.1.deb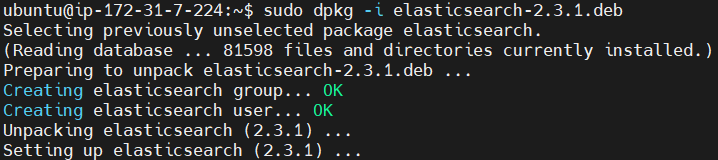
Now lets setup network configuration for that open the elasticsearch.yml file.
sudo nano /etc/elasticsearch/elasticsearch.yml
By default, Elasticsearch is configured to bind to localhost. If you want to access Elasticsearch from outside the server, you need to modify its configuration.
Find the line that starts with #network.host, uncomment it, and change its value to 0.0.0.0
network.host: 0.0.0.0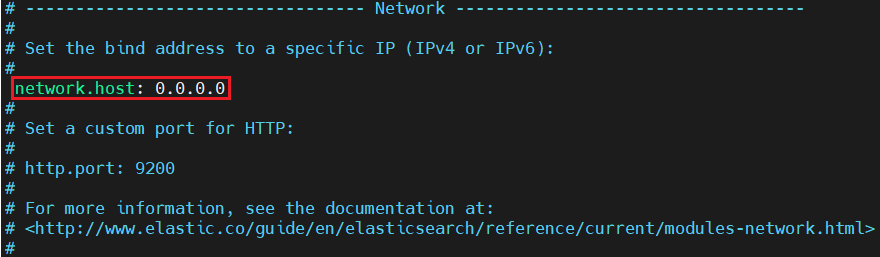
enable the elasticsearch service.
sudo systemctl enable elasticsearch.service
start the elasticsearch service
sudo systemctl start elasticsearch
you can check it’s status to see if it’s running properly or not.
sudo systemctl status elasticsearch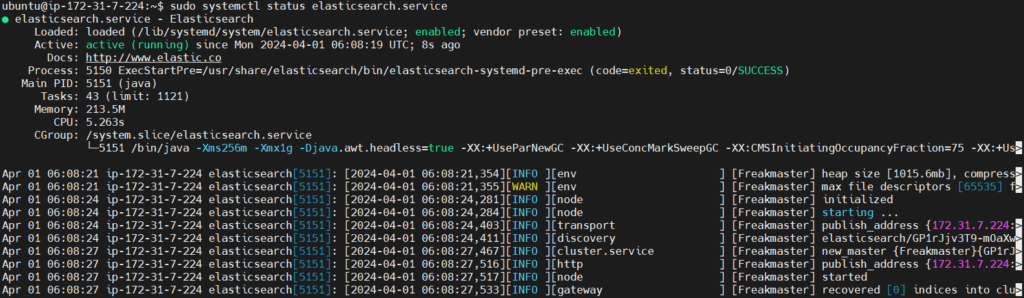
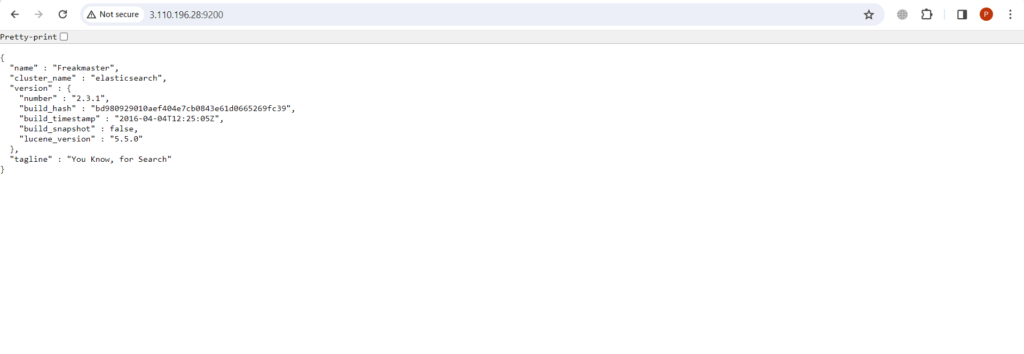
You can verify that Elasticsearch is running by accessing it through a web browser.
give your ubuntu instance PublicIP address:9200 port number which is default port number for elasticsearch.
Step #3:Install Prometheus on Ubuntu
Download the latest version of Prometheus from the GitHub repository using the following command.
wget https://github.com/prometheus/prometheus/releases/download/v2.30.0/prometheus-2.30.0.linux-amd64.tar.gz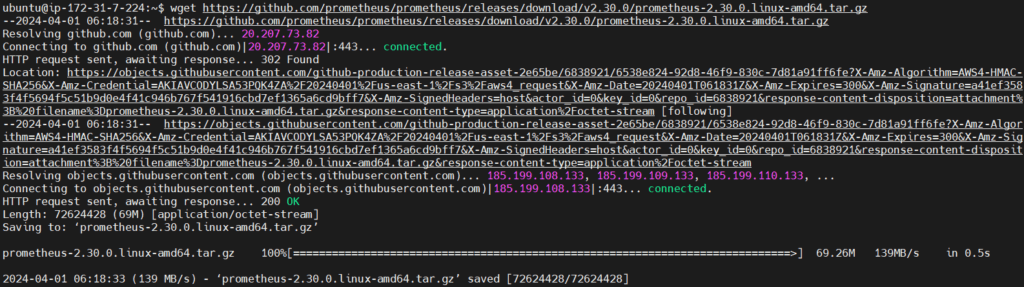
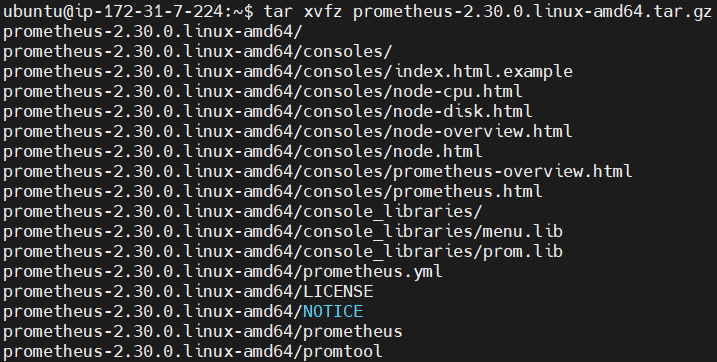
extract the downloaded archives.
tar xvfz prometheus-2.30.0.linux-amd64.tar.gzThe command extracts the contents of the file prometheus-2.30.0.linux-amd64.tar.gz
now navigate to the extracted directory using following command.
cd prometheus-2.30.0.linux-amd64
navigate to the /etc/systemd/system, this is where typically systemd unit files are located, which are used for managing services on Linux systems.
cd /etc/systemd/system
now lets create a service for Prometheus named prometheus.service.
sudo vi prometheus.service
add the following content into it.
[Unit]
Description=Prometheus
Wants=network-online.target
After=network-online.target

[Service]
ExecStart=/home/ubuntu/prometheus-2.30.0.linux-amd64/prometheus --config.file=/home/ubuntu/prometheus-2.30.0.linux-amd64/prometheus.yml
Restart=always

[Install]
WantedBy=default.target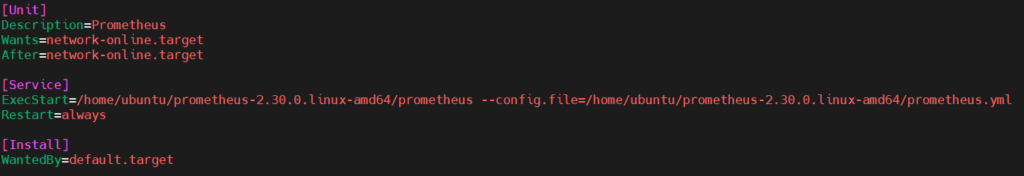
Now our prometheus.service is created.
After this reload the daemon service, enable, and start the Prometheus service:
sudo systemctl daemon-reload
sudo systemctl enable prometheus.service
sudo systemctl start prometheus.service


now Verify the status of the Prometheus service using following command:
sudo systemctl status prometheus.service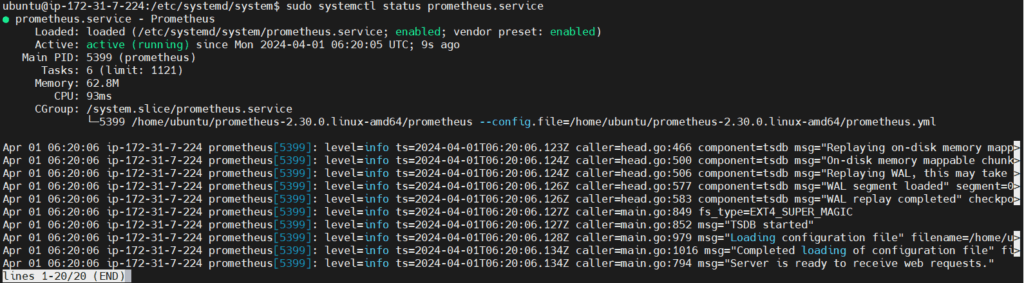
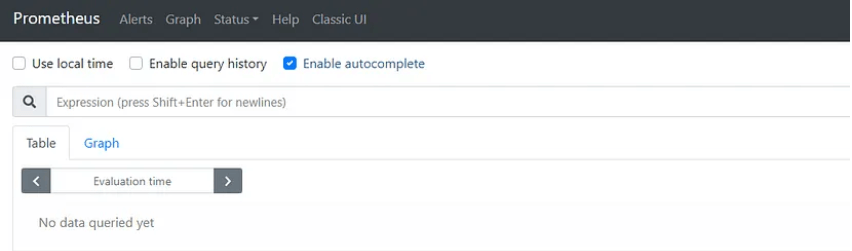
If your service is running properly then you can run prometheus by running
Public IP:9090 which is default port for prometheus in url.
Step #4:Install Grafana on Ubuntu
First import the GPG key used by the Grafana package.
wget -q -O - https://packages.grafana.com/gpg.key | sudo apt-key add -
then add the Grafana repository to the APT sources.
sudo add-apt-repository "deb https://packages.grafana.com/oss/deb stable main"
After adding the repository update the package lists
sudo apt update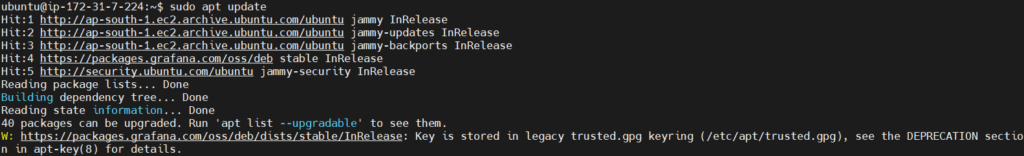
then install the grafana.
sudo apt install grafana
Start and enable the Grafana service.
sudo systemctl start grafana-server
sudo systemctl enable grafana-server

and if everything works fine and your service is running properly then run grafana by running your Public IP:3000 which is default port of grafana in searchbar.
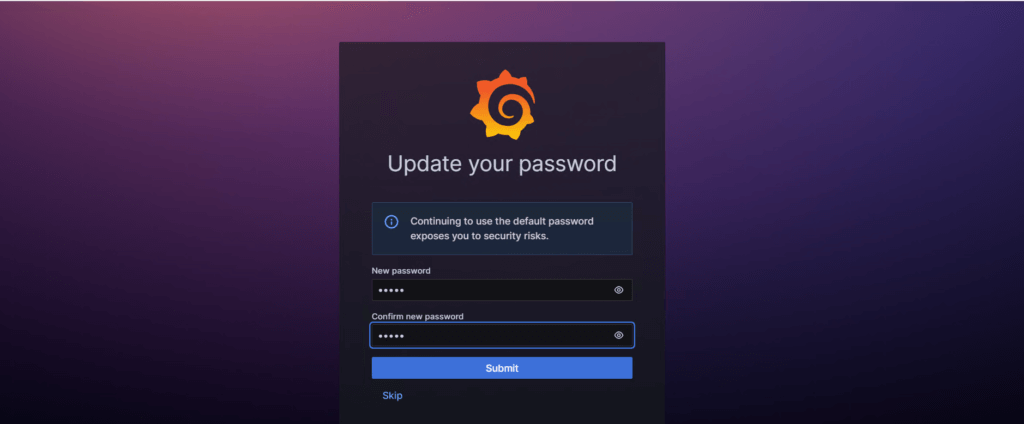
you will see the login page of grafana (UI) user interface
Grafana has admin as default username and password.

it will ask for changing the password you can change it or skip it.
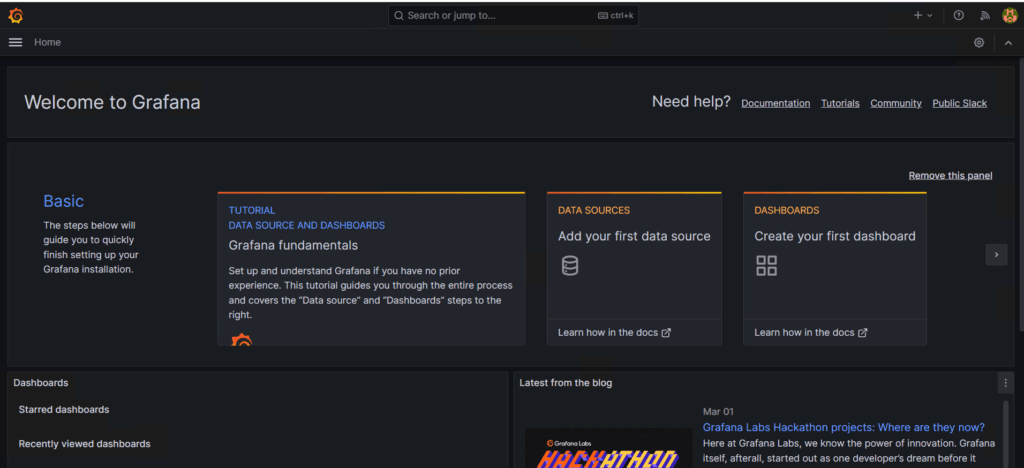
then you will see the welcome page of grafana.
Step #5:Install Elasticsearch Exporter for Prometheus
Create a system user for Elasticsearch.
sudo useradd --no-create-home --shell /bin/false elastic_search
then download the elasticsearch exporter on our ec2 instance.
To download the different versions visit the official website of Elasticsearch exporter prometheus Github page.
sudo wget https://github.com/prometheus community/elasticsearch_exporter/releases/download/v1.5.0/elasticsearch_exporter-1.5.0.linux-amd64.tar.gz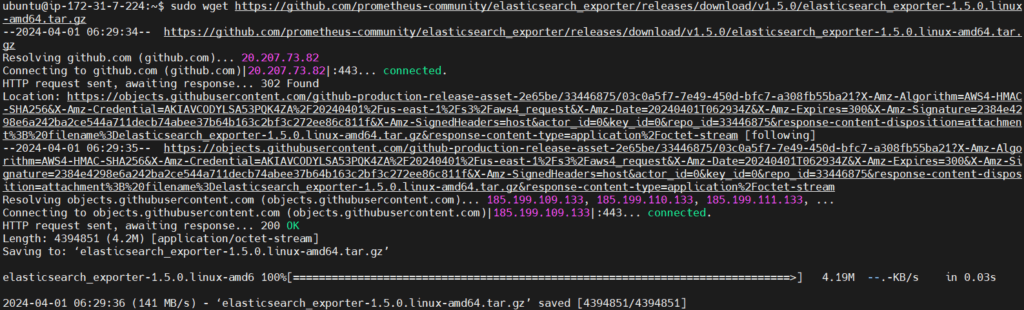
extract the files.
sudo tar -xvzf elasticsearch_exporter-1.5.0.linux-amd64.tar.gz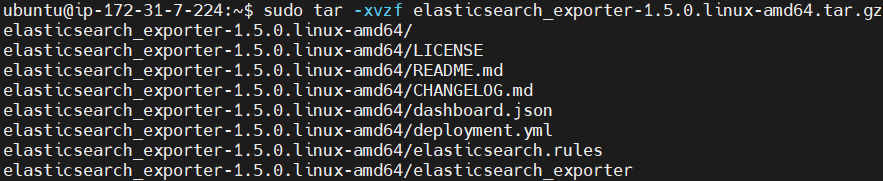
Now lets move to the extracted directory.
cd elasticsearch_exporter-1.5.0.linux-amd64/
Copy the exporter binary to /usr/local/bin/
sudo cp elasticsearch_exporter /usr/local/bin/
Now change the exporter binary ownership
sudo chown elastic_search:elastic_search /usr/local/bin/elasticsearch_exporter
Create a elasticsearch_exporter.service file.
sudo vim /etc/systemd/system/elasticsearch_exporter.service
add the following content into it.
[Unit]
Description=Prometheus ES_exporter
After=local-fs.target network-online.target network.target
Wants=local-fs.target network-online.target network.target

[Service]
User=elastic_search
Nice=10
ExecStart=/usr/local/bin/elasticsearch_exporter --es.uri=http://elastic_search@localhost:9200 --es.all --es.indices --es.timeout 20s
ExecStop=/usr/bin/killall elasticsearch_exporter

[Install]
WantedBy=default.target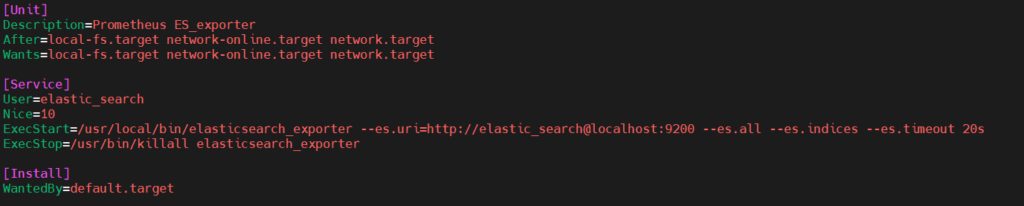
Now reload the service and after that enable and start it.
sudo systemctl daemon-reload
sudo systemctl enable elasticsearch_exporter
sudo systemctl start elasticsearch_exporter
Check the status of the service to if the service is running properly or not.
sudo systemctl status elasticsearch_exporter.service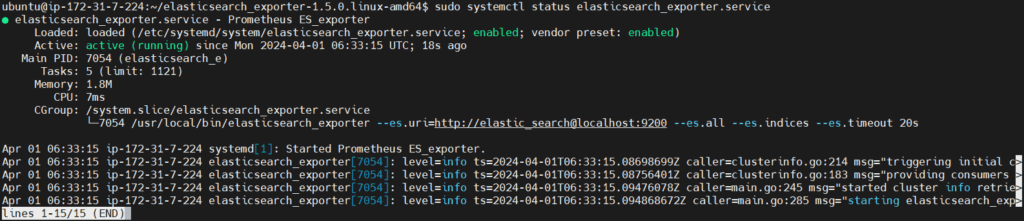
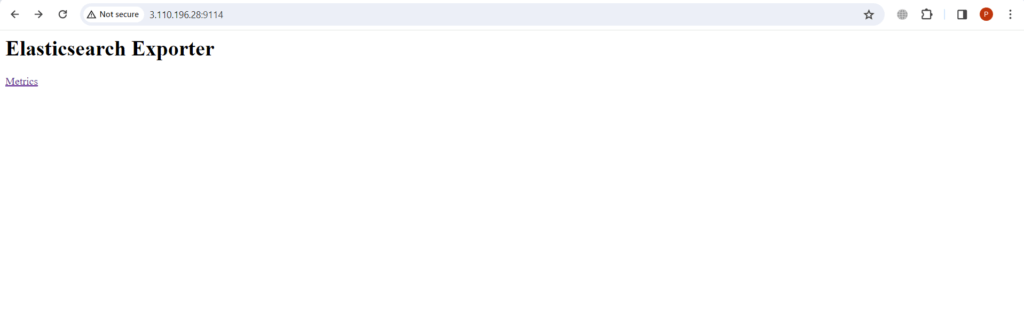
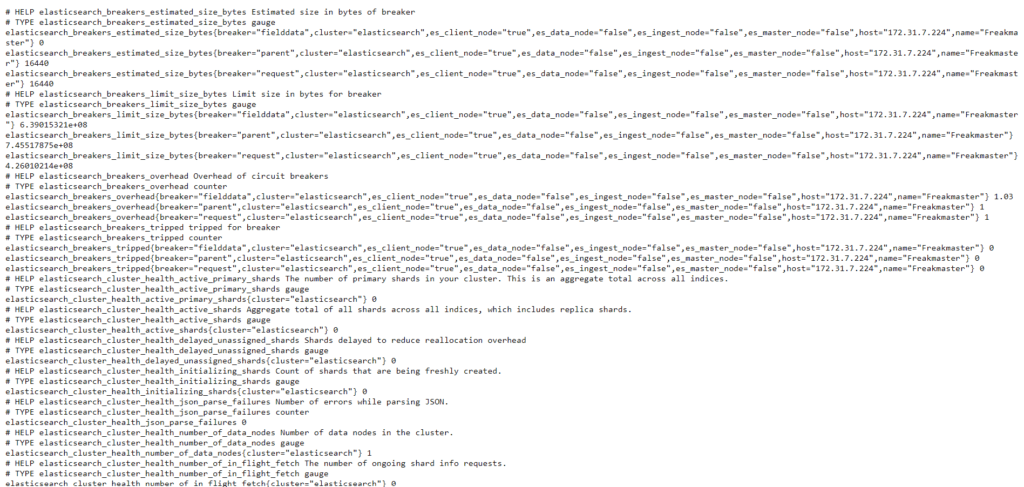
give your ubuntu instance PublicIP address:9114 port number which is default port number for elasticsearch_exporter.
Step #6:Configure Prometheus to Scrape Elasticsearch Metrics
Navigate to the directory containing the Prometheus configuration file.
cd prometheus-2.30.0.linux-amd64
Edit the prometheus.yml file.
nano prometheus.yml
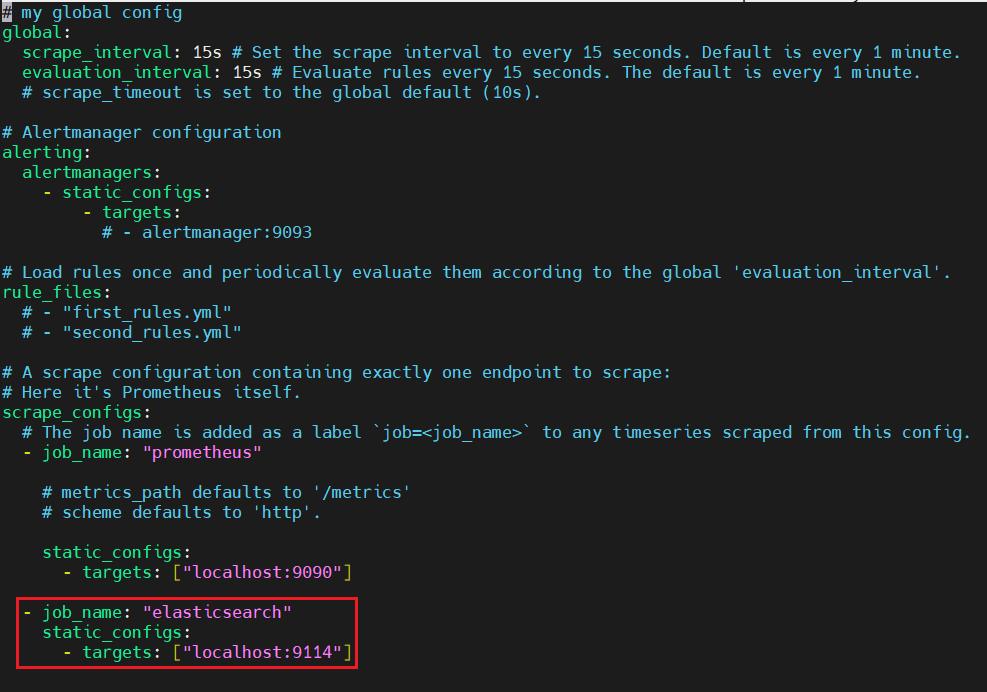
add the following content into it.
# my global config
global:
  scrape_interval: 15s # Set the scrape interval to every 15 seconds. Default is every 1 minute.
  evaluation_interval: 15s # Evaluate rules every 15 seconds. The default is every 1 minute.
  # scrape_timeout is set to the global default (10s).

# Alertmanager configuration
alerting:
  alertmanagers:
    - static_configs:
        - targets:
          # - alertmanager:9093

# Load rules once and periodically evaluate them according to the global 'evaluation_interval'.
rule_files:
  # - "first_rules.yml"
  # - "second_rules.yml"

# A scrape configuration containing exactly one endpoint to scrape:
# Here it's Prometheus itself.
scrape_configs:
  # The job name is added as a label `job=<job_name>` to any timeseries scraped from this config.
  - job_name: "prometheus"

    # metrics_path defaults to '/metrics'
    # scheme defaults to 'http'.

    static_configs:
      - targets: ["localhost:9090"]

  - job_name: "elasticsearch"
    static_configs:
      - targets: ["localhost:9114"]
Save and close the file. Then restart Prometheus.
sudo systemctl restart prometheus.service
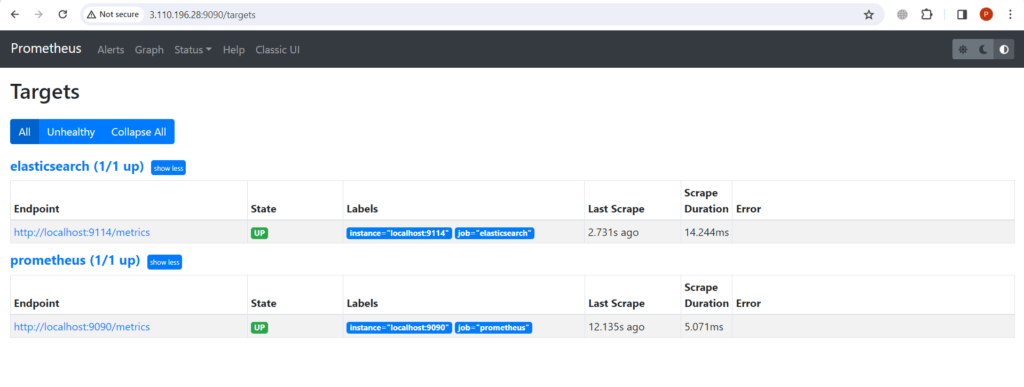
Now go to Prometheus dashboard and click on status, select target, you can see our exporter is up and running.
Step #7:Visualize Elasticsearch Metrics in Grafana
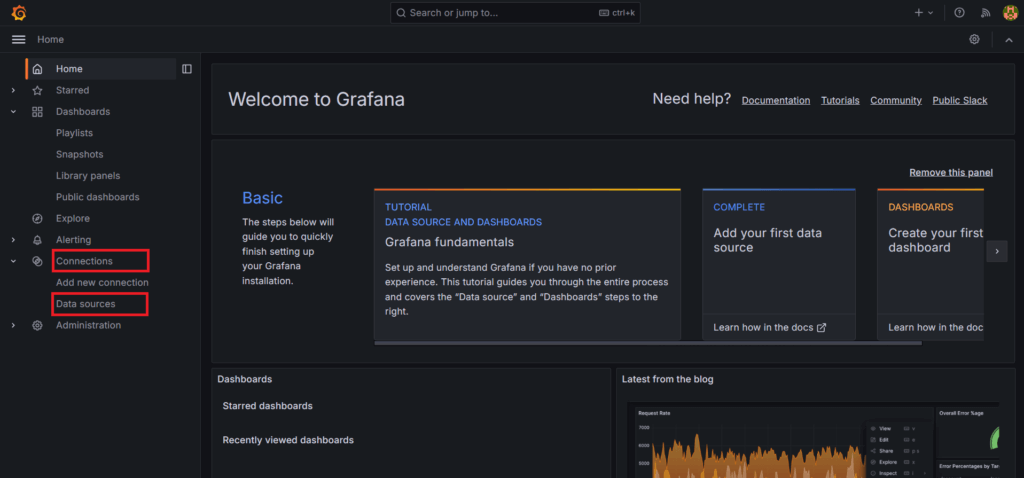
Now go back to the Grafana welcome page. Go to the Home in the left top corner.
Then go to the Connections and select the Data sources option.
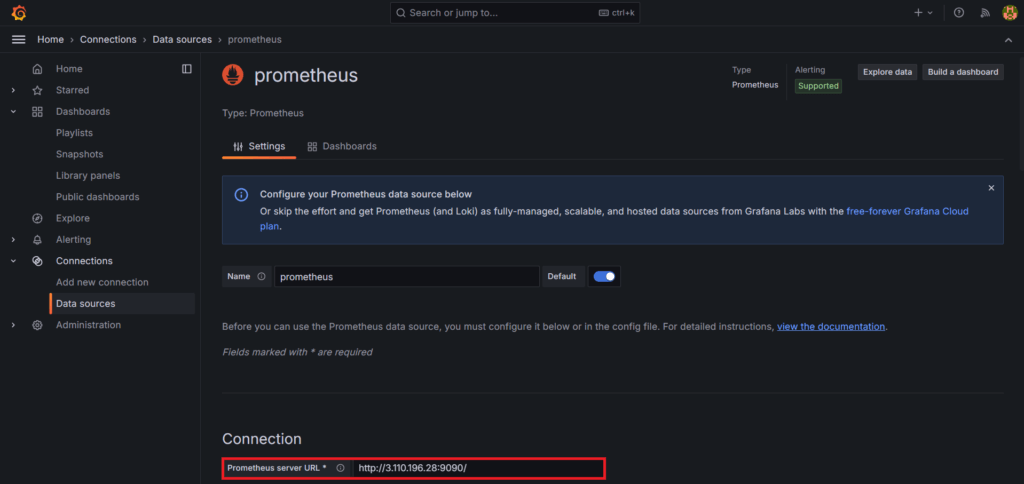
Select the prometheus as a data source
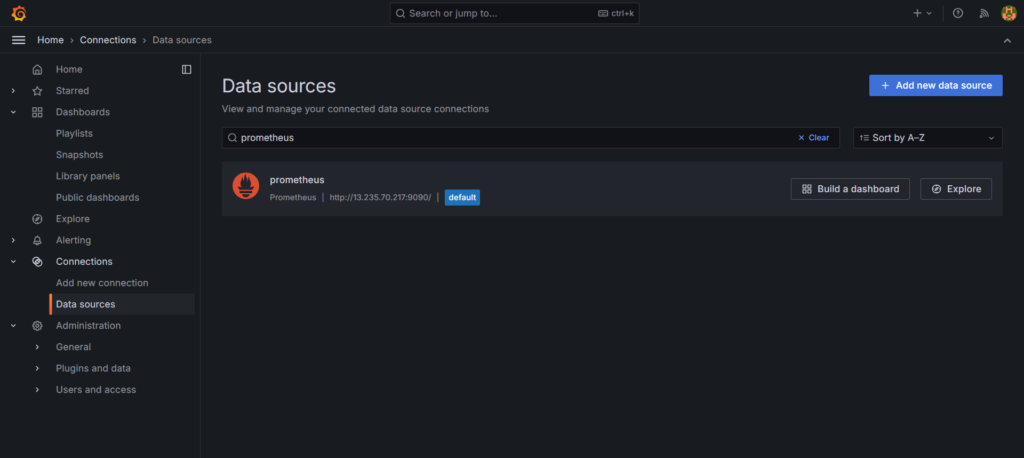
In connection, in Prometheus server URL, give the server url on which our prometheus is running.
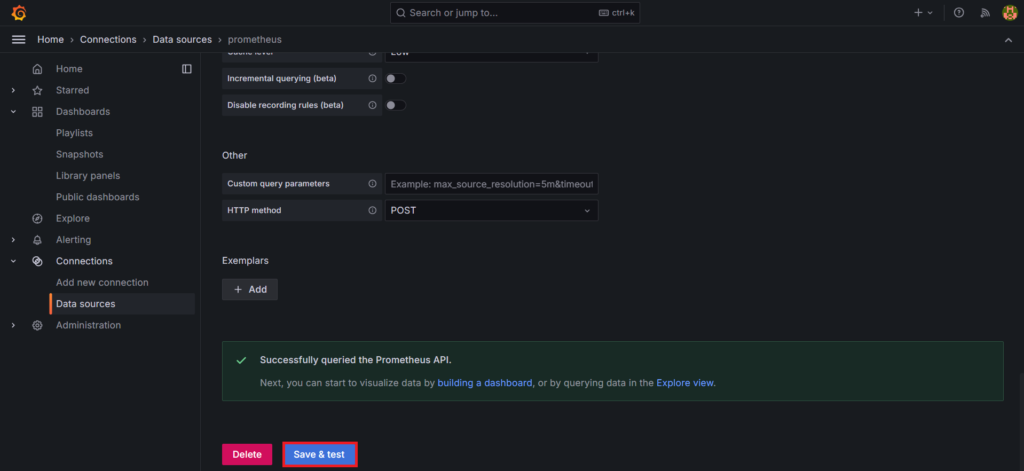
after this click on save and test button. You will see the message ‘Successfully queried the Prometheus API‘.
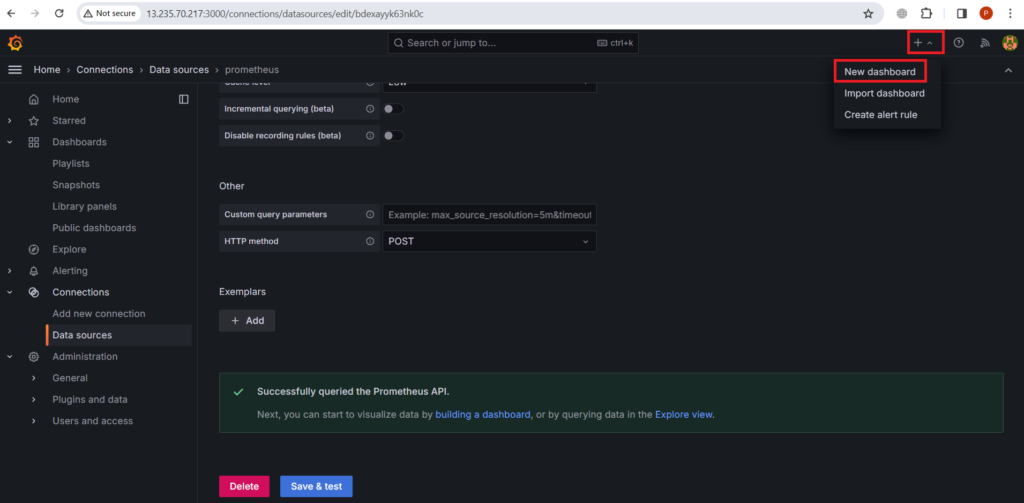
now go to the ‘+‘ icon from up-right corner and select the New dashboard.
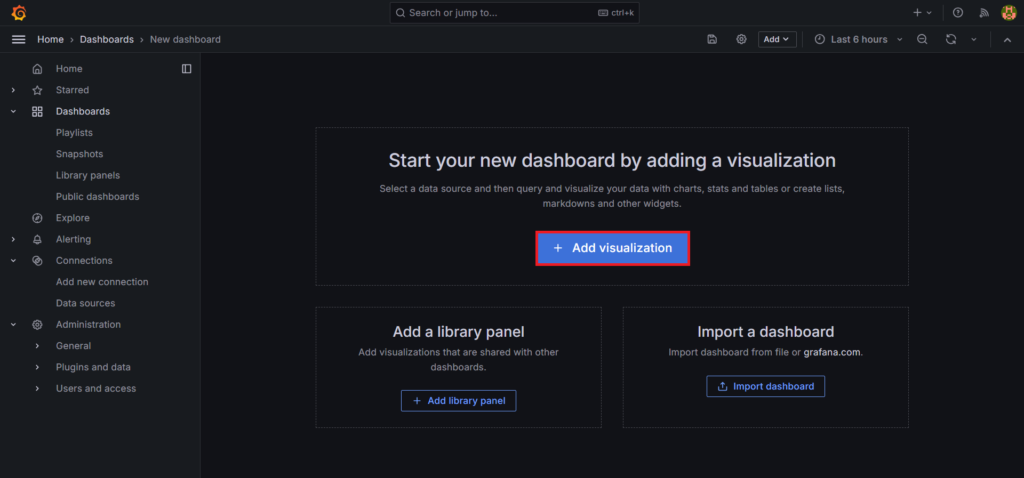
Here you can start your own new dashboard by adding a visualization.
So click on + Add visualization.
Here you can also import dashboards.
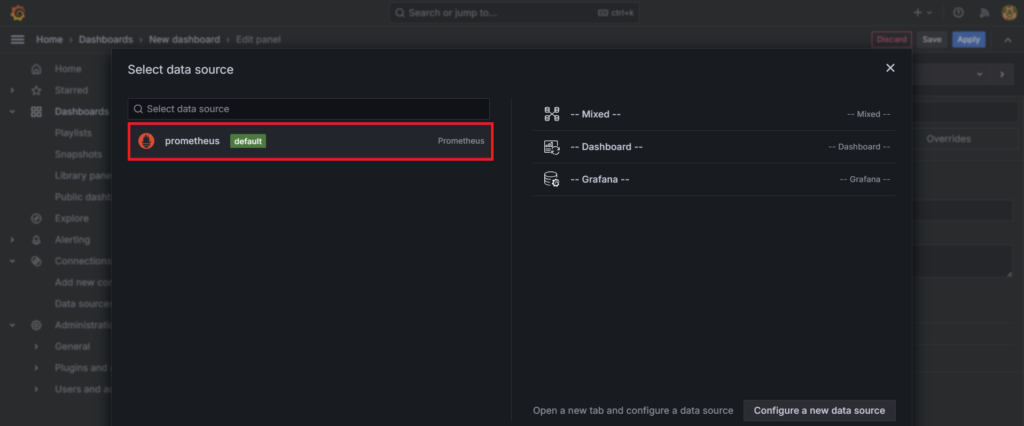
Select the Prometheus as Data source.
You will see the edit panel page
Now in the Query section add the A query.
- elasticsearch_filesyatem_data_available_bytes
- instance = localhost:9114
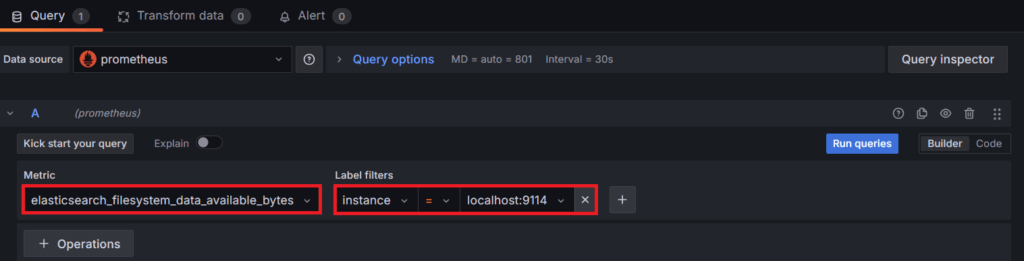
This query fetches the available bytes of data on the Elasticsearch filesystem.
then add the B query.
- elasticsearch_process_cpu_seconds_total
- cluster = elasticsearch
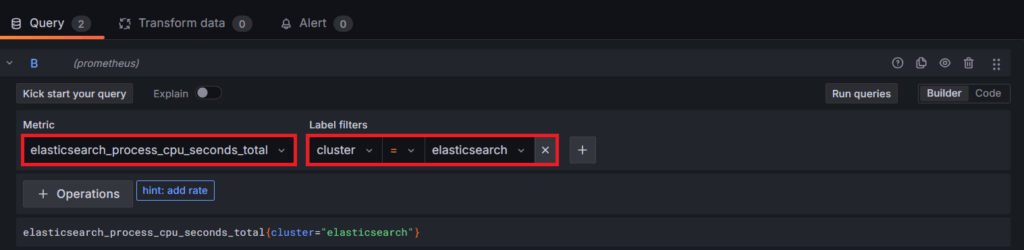
This query retrieves the total CPU time consumed by the Elasticsearch process across the entire cluster. By specifying the cluster as “elasticsearch,” Grafana fetches CPU usage metrics for all nodes within the Elasticsearch cluster.
Click on the run queries button and you will see the following output.
It’s in g\Gauge visualisation format and there are many options for visualisation like Time series, bar graph, stats etc.
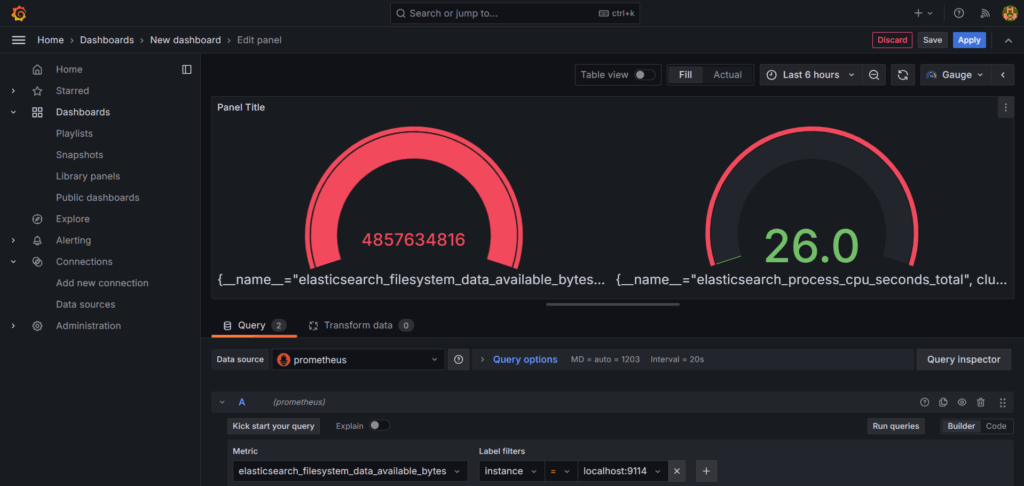
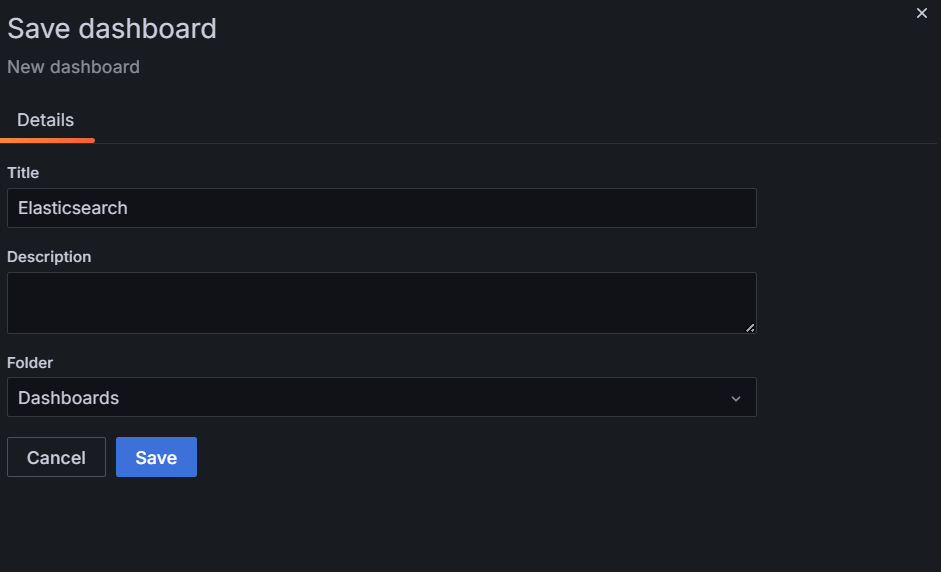
Finally click a ctrl + s to save the dashboard and give an appropriate title to it.
Conclusion:
In conclusion, monitoring Elasticsearch with Prometheus and Grafana provides invaluable insights into the health and performance of your Elasticsearch cluster. By visualizing key metrics and setting up alerts, you can proactively identify and address issues before they impact your applications. Regular monitoring allows you to optimize resource allocation, troubleshoot performance bottlenecks, and ensure the reliability and scalability of your Elasticsearch infrastructure. With the seamless integration of Prometheus and Grafana, you have a powerful monitoring solution that empowers you to maintain peak performance and maximize the value of your Elasticsearch deployment.
Related Articles:
How to Integrate InfluxDB with Grafana
Reference: