In this guide, we’ll explore how to effortlessly merge InfluxDB with Grafana to leverage their strengths in storing time-based data and crafting visually compelling dashboards.It is a time-series database, efficiently stores and retrieves time-stamped data, while Grafana provides rich visualization capabilities. In this guide, we’ll walk through the process of integrating InfluxDB with Grafana to create dynamic and insightful dashboards.
Table of Contents
What is InfluxDB ?
As a time-series database, InfluxDB specializes in efficiently storing and retrieving time-stamped data. It is designed to handle high volumes of timestamped data, making it ideal for applications such as monitoring system metrics, tracking sensor data, and analyzing IoT device telemetry.
Prerequisites
- AWS Account with Ubuntu 22.04 LTS EC2 Instance.
- Basic knowledge of AWS services and Grafana.
Step #1:Install InfluxDB on Ubuntu
To integrate InfluxDB with Grafana on Ubuntu first we need to install it.
Before you start, update the apt package index.
sudo apt update
Import the repository GPG key.
curl -fsSL https://repos.influxdata.com/influxdata-archive_compat.key | sudo gpg --dearmor -o /etc/apt/trusted.gpg.d/influxdata.gpg

Add the InfluxDB APT repository.
echo 'deb [signed-by=/etc/apt/trusted.gpg.d/influxdata.gpg] https://repos.influxdata.com/debian stable main' | sudo tee /etc/apt/sources.list.d/influxdata.list

Update the apt index again.
sudo apt update
install the InfluxDB.
sudo apt install influxdb2
Start and enable the service to run on boot.
sudo systemctl start influxdb
sudo systemctl enable influxdb
Check the status of the service
sudo systemctl status influxdb
Step #2:Install Grafana on Ubuntu
First import the GPG key used by the Grafana package.
wget -q -O - https://packages.grafana.com/gpg.key | sudo apt-key add -
then add the Grafana repository to the APT sources.
sudo add-apt-repository "deb https://packages.grafana.com/oss/deb stable main"
After adding the repository update the package lists
sudo apt update
then install the grafana.
sudo apt install grafana
Start and enable the Grafana service.
sudo systemctl start grafana-server
sudo systemctl enable grafana-server
and if everything works fine and your service is running properly then run grafana by running your Public IP:3000 which is default port of grafana in searchbar.
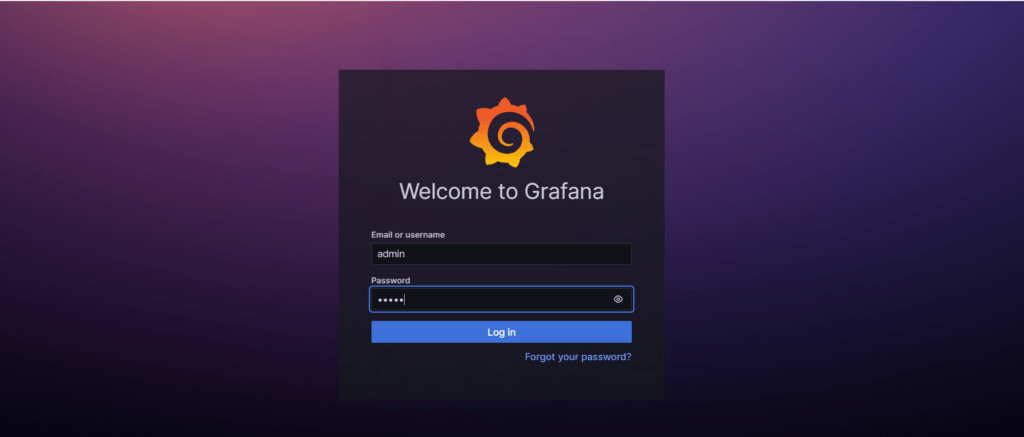
you will see the login page of grafana (UI) user interface
Grafana uses admin as a default username and password.
it will ask for changing the password you can change it or skip it.
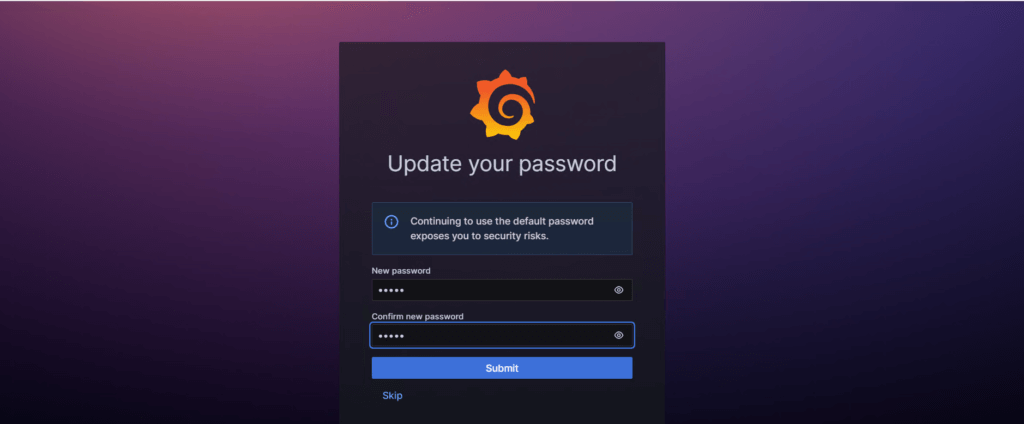
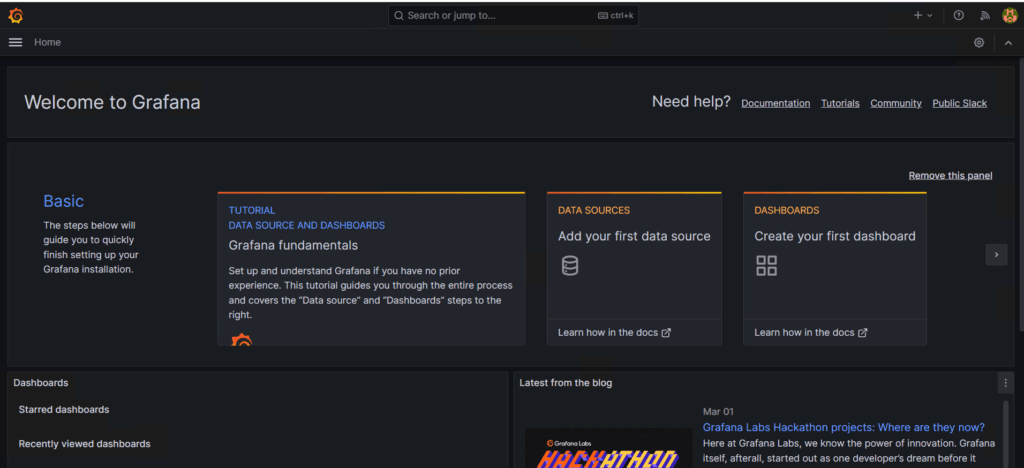
then you will see the welcome page of grafana.
Step #3:Setup InfluxDB
To set up credentials for connecting to InfluxDB use following command.
sudo influx setup -u admin -p admin@24 -o Fosstechnix \
-b my-bucket -t my-token -r 0 -f
This command creates initial super-admin credentials, an organization, a bucket, and an access token. Here’s a breakdown of the parameters
-u: Username for the admin user.-p: Password for the admin user.-o: Name of the organization you want to create.-b: Name of the bucket you want to create.-t: Name of the access token you want to create.-r: Retention policy duration in hours (0 means infinite retention).-f: Flag to overwrite any existing configurations.
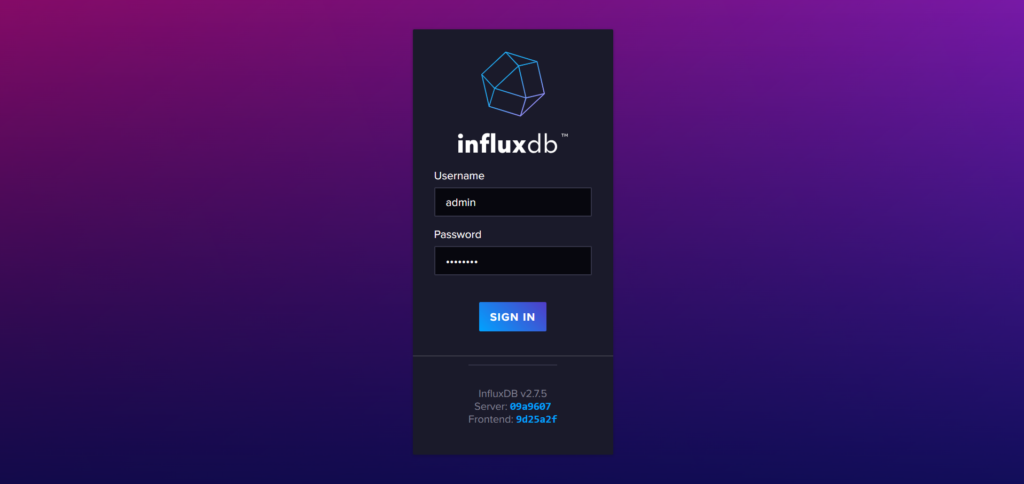
Now open the InfluxDB by providing your PublicIP address:8086 which is default port number for it.
sign in using the Username and Password which is provided in above step.

Step #4:Add InfluxDB as a Data source in Grafana
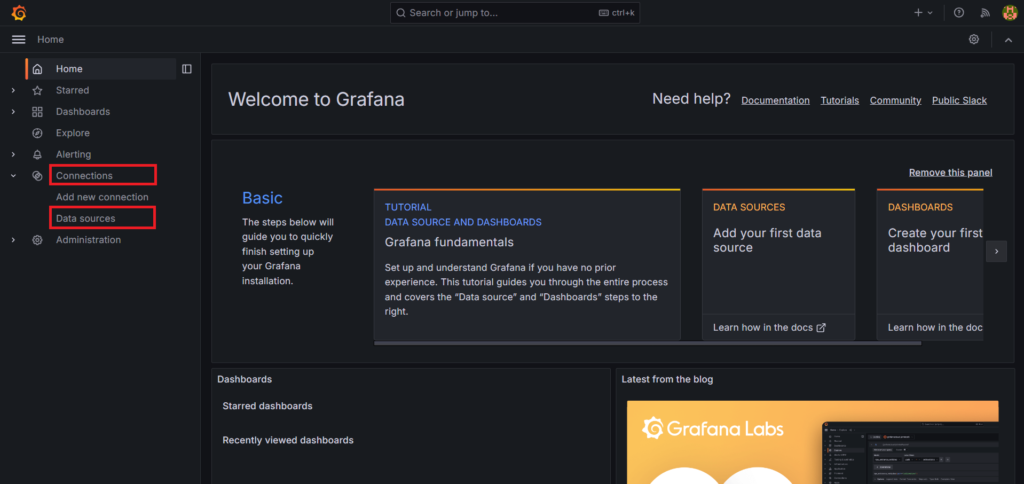
Open the Grafana UI, and in the up-left corner, click on the Connections, to open Data Sources.
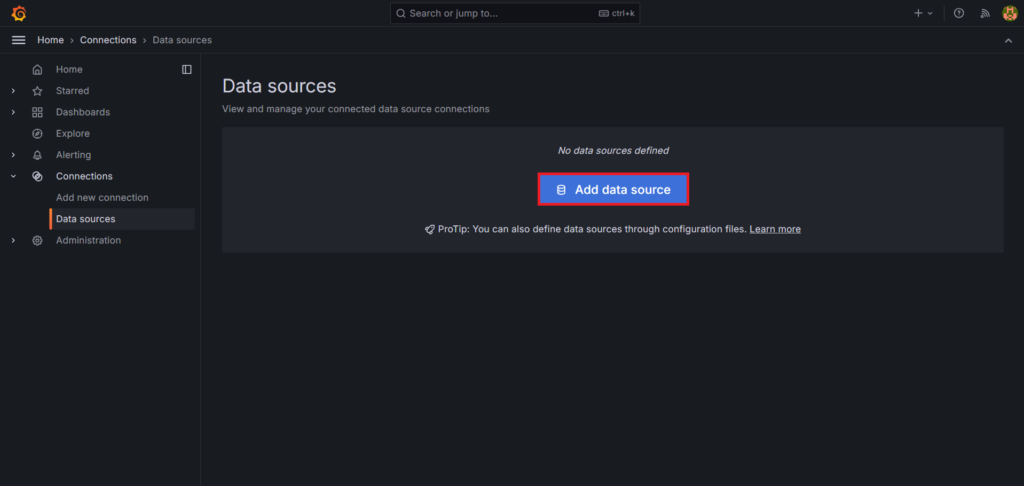
Click on Add Data Source
Select InfluxDB.

Replace InfluxQL with Flux in the dropdown called Query Language.
Type http://PublicIP:8086/ at the URL field in the section called HTTP.

Write Fosstechnix into the Organization field in the InfluxDB Details section.
Type my-token in the Token field. (Once the save and test button is clicked, the password is hidden and replaced with configured.)
Type the Bucket as my-bucket.
Click on Save & Test Success will display message (datasource is working. 3 buckets found). Please see below.

Step #5:Enter the Flux query
Now select the explore option from home bar.

In the Explorer, enter the query buckets() on line 1 and then click the Run Query button. This query will retrieve information about the buckets stored in your instance. After executing the query, you’ll see a table displaying the list of buckets.

Among the displayed buckets, you’ll notice two internal InfluxDB buckets named “_monitoring” and “_tasks”. These buckets are used internally by InfluxDB for monitoring and task management purposes.
The third bucket listed is called “my-bucket”, which was created earlier using the “influx setup” command. This bucket was specifically set up for storing your data, and it’s where you’ll store your own time-series data for analysis and visualization
Conclusion:
Integrating InfluxDB with Grafana provides a powerful solution for monitoring and visualizing time-series data. By following the steps outlined in this guide, you can create dynamic dashboards that offer valuable insights into your data, enabling informed decision-making and proactive management. Experiment with different visualization types, explore advanced features, and fine-tune your dashboards to suit your specific requirements. With the right configuration and customization, InfluxDB and Grafana can become indispensable tools in your data analytics toolkit.
Related Articles:
How to Configure Email Alerts in Grafana
Reference: