In this article, we will Integrate opentelemetry for java project. We will see the steps to integrate OpenTelemetry into a Java project using Maven, setting up the OpenTelemetry Collector, and configuring local logging. OpenTelemetry is an open-source observability framework for cloud-native software, providing a set of APIs, libraries, agents, and instrumentation to help developers collect telemetry data (traces, metrics, and logs) from applications.
Table of Contents
Prerequisites
Before you start, ensure you have the following installed on your system.
- AWS Account with Ubuntu 24.04 LTS EC2 Instance.
- Java Development Kit (JDK) and Maven with Opentelemetry collector installed.
Step #1:Set Up Ubuntu EC2 Instance
If you don’t have JDK or Maven installed on your system you can install it by using following commands.
First Update the package list.
sudo apt update
Spring Boot requires Java, so install OpenJDK.
sudo apt install openjdk-17-jdk -y
Verify the Java installation.
java -version
You should see the version details of your Java installation.
Now lets install Maven. Maven is the build tool used to manage Java projects.
sudo apt install maven -y
Verify the Maven installation.
mvn -version
Step #2:Integrate Opentelemetry for Java Project with maven
Maven follows a standard directory layout, which makes it easier to manage projects. To create a new Maven project, you can use the command line.
Run the following command to create a new project.
mvn archetype:generate -DgroupId=com.example -DartifactId=helloworld -DarchetypeArtifactId=maven-archetype-quickstart -DinteractiveMode=false
- groupId: A unique identifier for your project (usually the package name).
- artifactId: The name of your project.
- archetypeArtifactId: The template for the project;
maven-archetype-quickstartcreates a simple Java project. - interactiveMode: Set to
falseto skip interactive prompts.
This command will generate the following directory structure.
helloworld
├── pom.xml
└── src
    ├── main
    │   └── java
    │       └── com
    │           └── example
    │               └── App.java
    └── test
        └── java
            └── com
                └── example
                    └── AppTest.java
Navigate to the project directory.
cd helloworld
Open the pom.xml file and update the file for Spring Boot dependencies and OpenTelemetry dependencies.
The pom.xml (Project Object Model) file is the core of a Maven project. It contains configuration details, such as dependencies, build settings, and project information.
nano pom.xml
replace its content with the following:
<project xmlns="http://maven.apache.org/POM/4.0.0" xmlns:xsi="http://www.w3.org/2001/XMLSchema-instance"
  xsi:schemaLocation="http://maven.apache.org/POM/4.0.0 http://maven.apache.org/maven-v4_0_0.xsd">
  <modelVersion>4.0.0</modelVersion>
  <groupId>com.example</groupId>
  <artifactId>helloworld</artifactId>
  <packaging>jar</packaging>
  <version>1.0-SNAPSHOT</version>
  <name>helloworld</name>
  <url>http://maven.apache.org</url>
  <parent>
    <groupId>org.springframework.boot</groupId>
    <artifactId>spring-boot-starter-parent</artifactId>
    <version>3.0.0</version>
    <relativePath /> <!-- lookup parent from repository -->
  </parent>
  <dependencies>
    <dependency>
      <groupId>junit</groupId>
      <artifactId>junit</artifactId>
      <version>3.8.1</version>
      <scope>test</scope>
    </dependency>
    <dependency>
        <groupId>org.springframework.boot</groupId>
        <artifactId>spring-boot-starter-web</artifactId>
    </dependency>
    <dependency>
        <groupId>org.springframework.boot</groupId>
        <artifactId>spring-boot-starter-test</artifactId>
        <scope>test</scope>
    </dependency>
    <dependency>
      <groupId>io.opentelemetry</groupId>
      <artifactId>opentelemetry-api</artifactId>
    </dependency>
    <dependency>
      <groupId>io.opentelemetry</groupId>
      <artifactId>opentelemetry-sdk-trace</artifactId>
    </dependency>
    <dependency>
      <groupId>io.opentelemetry</groupId>
      <artifactId>opentelemetry-exporter-otlp</artifactId>
    </dependency>
    <dependency>
      <groupId>io.opentelemetry</groupId>
      <artifactId>opentelemetry-sdk</artifactId>
    </dependency>
    <dependency>
      <groupId>io.opentelemetry</groupId>
      <artifactId>opentelemetry-semconv</artifactId>
      <version>1.27.0-alpha</version>
    </dependency>
  </dependencies>
  <dependencyManagement>
    <dependencies>
      <dependency>
        <groupId>io.opentelemetry</groupId>
        <artifactId>opentelemetry-bom</artifactId>
        <version>1.42.1</version>
        <type>pom</type>
        <scope>import</scope>
      </dependency>
    </dependencies>
  </dependencyManagement>
  <build>
    <plugins>
        <plugin>
            <groupId>org.springframework.boot</groupId>
            <artifactId>spring-boot-maven-plugin</artifactId>
        </plugin>
  </plugins>
  </build>
</project>
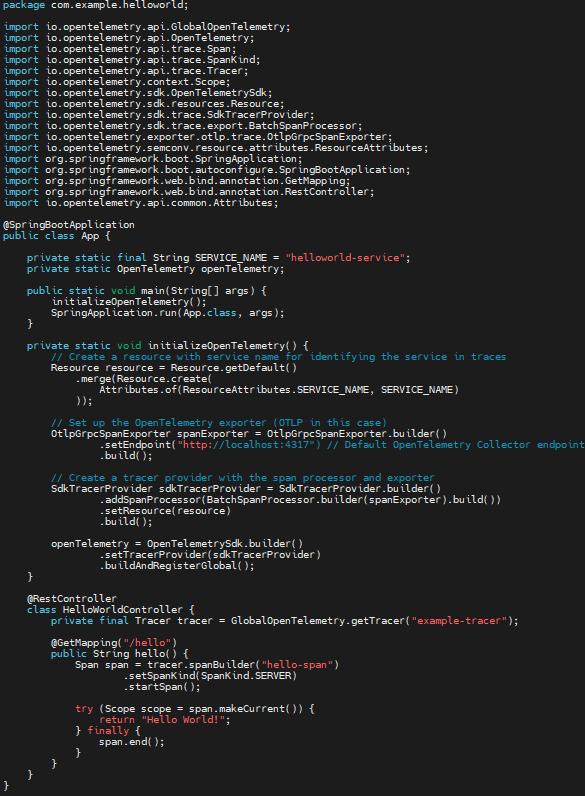
Next edit the App.java in src/main/java/com/example/ and add OpenTelemetry instrumentation.
For that first navigate to the directory.
cd src/main/java/com/example
Open a file App.java with following command.
nano App.java
Add the following content into it.
package com.example.helloworld;

import io.opentelemetry.api.GlobalOpenTelemetry;
import io.opentelemetry.api.OpenTelemetry;
import io.opentelemetry.api.trace.Span;
import io.opentelemetry.api.trace.SpanKind;
import io.opentelemetry.api.trace.Tracer;
import io.opentelemetry.context.Scope;
import io.opentelemetry.sdk.OpenTelemetrySdk;
import io.opentelemetry.sdk.resources.Resource;
import io.opentelemetry.sdk.trace.SdkTracerProvider;
import io.opentelemetry.sdk.trace.export.BatchSpanProcessor;
import io.opentelemetry.exporter.otlp.trace.OtlpGrpcSpanExporter;
import io.opentelemetry.semconv.resource.attributes.ResourceAttributes;
import org.springframework.boot.SpringApplication;
import org.springframework.boot.autoconfigure.SpringBootApplication;
import org.springframework.web.bind.annotation.GetMapping;
import org.springframework.web.bind.annotation.RestController;
import io.opentelemetry.api.common.Attributes;

@SpringBootApplication
public class App {

    private static final String SERVICE_NAME = "helloworld-service";
    private static OpenTelemetry openTelemetry;

    public static void main(String[] args) {
        initializeOpenTelemetry();
        SpringApplication.run(App.class, args);
    }

    private static void initializeOpenTelemetry() {
        // Create a resource with service name for identifying the service in traces
        Resource resource = Resource.getDefault()
            .merge(Resource.create(
                Attributes.of(ResourceAttributes.SERVICE_NAME, SERVICE_NAME)
            ));

        // Set up the OpenTelemetry exporter (OTLP in this case)
        OtlpGrpcSpanExporter spanExporter = OtlpGrpcSpanExporter.builder()
                .setEndpoint("http://localhost:4317") // Default OpenTelemetry Collector endpoint
                .build();

        // Create a tracer provider with the span processor and exporter
        SdkTracerProvider sdkTracerProvider = SdkTracerProvider.builder()
                .addSpanProcessor(BatchSpanProcessor.builder(spanExporter).build())
                .setResource(resource)
                .build();

        openTelemetry = OpenTelemetrySdk.builder()
                .setTracerProvider(sdkTracerProvider)
                .buildAndRegisterGlobal();
    }

    @RestController
    class HelloWorldController {
        private final Tracer tracer = GlobalOpenTelemetry.getTracer("example-tracer");

        @GetMapping("/hello")
        public String hello() {
            Span span = tracer.spanBuilder("hello-span")
                    .setSpanKind(SpanKind.SERVER)
                    .startSpan();

            try (Scope scope = span.makeCurrent()) {
                return "Hello World!";
            } finally {
                span.end();
            }
        }
    }
}
Step #3:Install and Configure the OpenTelemetry Collector for java project
The OpenTelemetry Collector is a service that receives, processes, and exports telemetry data. Here’s how to install and configure it.
First exit the directories till the root directory of application.
cd ../../../../..
Download it using following command.
wget https://github.com/open-telemetry/opentelemetry-collector-releases/releases/download/v0.111.0/otelcol-contrib_0.111.0_linux_amd64.deb
Now let’s create a new directory to store the OpenTelemetry Collector configuration.
mkdir otelcol-config
Create the configuration file in the new directory.
nano otelcol-config/config.yaml
Add the following configuration into the file.
receivers:
  otlp:
    protocols:
      http:
      grpc:

exporters:
  debug: {}

service:
  pipelines:
    traces:
      receivers: [otlp]
      exporters: [debug]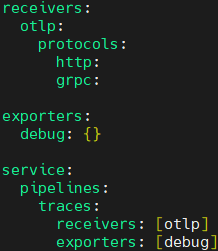
extract the contents of the OpenTelemetry Collector .deb package to locate the binary.
First create a directory to the extracted files.
mkdir otelcol-extracted
Extract the contents into the directory.
dpkg-deb -x otelcol-contrib_0.111.0_linux_amd64.deb otelcol-extracted
After extraction, the binary should be located within the extracted directory. Let’s check for its location.
find otelcol-extracted -name "otelcol-contrib"
Once you find the binary, you can run it directly using its full path.
/home/ubuntu/helloworld/otelcol-extracted/usr/bin/otelcol-contrib --config otelcol-config/config.yaml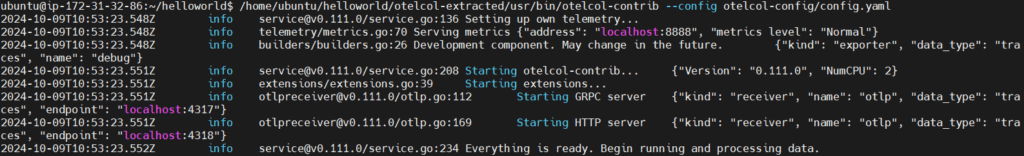
Step #4:Build and Run the Java Application with OpenTelemetry
Now that the OpenTelemetry Collector is running successfully and listening for traces on the specified endpoints, you can proceed to run your Spring Boot application.
Build the application.
mvn clean install

Explanation:
- clean: Deletes the
targetdirectory, which contains the compiled code and other build artifacts. - install: Compiles the code, runs tests, and packages the application into a JAR file, which is stored in the
targetdirectory.
If everything is set up correctly, you should see output indicating a successful build.
Run the application from the root of your project directory (where the pom.xml file is located).
mvn spring-boot:run

Output:

You can test your Spring Boot application by accessing the endpoint that returns “Hello World!” (e.g., http://<EC2-Instance-IP>:8080/hello). This should trigger trace data to be sent to the OpenTelemetry Collector.

With both the OpenTelemetry Collector and your Spring Boot application running, you should see logs in the terminal where the OpenTelemetry Collector is running, indicating that it is receiving traces from your application.

The log message you’re seeing indicates that the OpenTelemetry Collector’s debug exporter successfully received trace data from your Spring Boot application. Here’s what the message means:
- “kind”: “exporter”: This indicates that the message is related to an exporter component of the OpenTelemetry Collector.
- “data_type”: “traces”: This specifies that the data being handled is trace data.
- “name”: “debug”: The name of the exporter that is logging this message.
- “resource spans”: 1: This indicates that one resource span has been processed.
- “spans”: 1: This indicates that one individual span was sent to the debug exporter.
Conclusion:
In this article, we have learned how to integrate OpenTelemetry into a Java project using Maven, set up the OpenTelemetry Collector, and configure local logging to visualize telemetry data. This setup provides a strong foundation for monitoring and debugging your applications, enhancing their performance and reliability.
OpenTelemetry offers a comprehensive approach to observability, allowing you to gain valuable insights into your application’s behavior, and make data-driven decisions to optimize your code.
Related Articles:
How to Install Elastic Stack on Ubuntu 24.04 LTS
Reference: