In this article we are going to cover How to Monitor Jenkins Using Prometheus, Node exporter and Grafana | Jenkins monitoring with Prometheus and Grafana.
Table of Contents
Prerequisites
- Ubuntu with 22.04 Version
- Root user account with sudo privilege.
- Prometheus system user and group.
- Sufficient storage on your system and good internet connectivity.
- Ports Required- 9090 (Prometheus), 3000 (Grafana), 9100 (Node Exporter)
We will update the system repository index by using the following command. sudo apt update -y
Step #1:Install Prometheus on Ubuntu 22.04 LTS
Create a system user for Prometheus using below commnds:
sudo useradd --no-create-home --shell /bin/false prometheus
Create the directories in which we will be storing our configuration files and libraries:
sudo mkdir /etc/prometheus
sudo mkdir /var/lib/prometheus
Set the ownership of the /var/lib/prometheus directory with below command:
sudo chown prometheus:prometheus /var/lib/prometheus
You need to inside /tmp :
cd /tmp/
Go to the Official Page downloads Prometheus:
wget https://github.com/prometheus/prometheus/releases/download/v2.47.2/prometheus-2.47.2.linux-amd64.tar.gz
Extract the files using tar :
sudo tar -xvf prometheus-2.47.2.linux-amd64.tar.gz
Move the configuration file and set the owner to the prometheus
cd prometheus-2.47.2.linux-amd64
sudo mv console* /etc/prometheus
sudo mv prometheus.yml /etc/prometheus
sudo chown -R prometheus:prometheus /etc/prometheus
Move the binaries and set the owner:
sudo mv prometheus /usr/local/bin/
sudo chown prometheus:prometheus /usr/local/bin/prometheus
Create the service file using below command:
sudo nano /etc/systemd/system/prometheus.service
[Unit]
Description=Prometheus
Wants=network-online.target
After=network-online.target

[Service]
User=prometheus
Group=prometheus
Type=simple
ExecStart=/usr/local/bin/prometheus \
    --config.file /etc/prometheus/prometheus.yml \
    --storage.tsdb.path /var/lib/prometheus/ \
    --web.console.templates=/etc/prometheus/consoles \
    --web.console.libraries=/etc/prometheus/console_libraries

[Install]
WantedBy=multi-user.target
Reload systemd:
sudo systemctl daemon-reload
Start and enable Prometheus service:
sudo systemctl start prometheus
sudo systemctl enable prometheus
sudo systemctl status prometheus
Output:

Now access Prometehus in your browser
<server-ip>:9090
Step #2:Install Node Exporter on Ubuntu 22.04 LTS
Go to the official release page of Prometheus Node Exporter and copy the link of the latest version of the Node Exporter package according to your OS type
wget https://github.com/prometheus/node_exporter/releases/download/v1.6.1/node_exporter-1.6.1.linux-amd64.tar.gz
Extreact the file
sudo tar xvfz node_exporter-*.*-amd64.tar.gz
Move the binary file of node exporter to /usr/local/bin location.
sudo mv node_exporter-*.*-amd64/node_exporter /usr/local/bin/
Create a node_exporter user to run the node exporter service
sudo useradd -rs /bin/false node_exporter
Create a Custom Node Exporter Service
sudo nano /etc/systemd/system/node_exporter.service
[Unit]

Description=Node Exporter

After=network.target


[Service]

User=node_exporter

Group=node_exporter

Type=simple

ExecStart=/usr/local/bin/node_exporter


[Install]

WantedBy=multi-user.target
Reload the systemd
sudo systemctl daemon-reload
To Start, enable node exporter:
sudo systemctl enable node_exporter
sudo systemctl start node_exporter
sudo systemctl status node_exporter
Output:

Lets update our configuration file using below command:
sudo nano /etc/prometheus/prometheus.yml
- job_name: 'Node_Exporter'

    scrape_interval: 5s

    static_configs:

      - targets: ['<Server_IP_of_Node_Exporter_Machine>:9100']
After changes any configuration file we need to restart our prometheus
sudo systemctl restart prometheus.service
Step #3:Install Grafana on Ubuntu 22.04 LTS
Download the Grafana GPG key with wget, then pipe the output to apt-key. This will add the key to your APT installation’s list of trusted keys, which will allow you to download and verify the GPG-signed Grafana package:
wget -q -O - https://packages.grafana.com/gpg.key | sudo apt-key add -
Next, add the Grafana repository to your APT sources:
sudo add-apt-repository "deb https://packages.grafana.com/oss/deb stable main"
Refresh your APT cache to update your package lists:
sudo apt update
You can now proceed with the installation:
sudo apt install grafana
Once Grafana is installed, use systemctl to start the Grafana server:
sudo systemctl start grafana-server
Next, verify that Grafana is running by checking the service’s status:
sudo systemctl status grafana-server
sudo systemctl enable grafana-server

Lets Access in browser:
<instance_ip>:3000
Output:
default username: admin
default password: admin

To visualize metrics, you need to add a data source first.
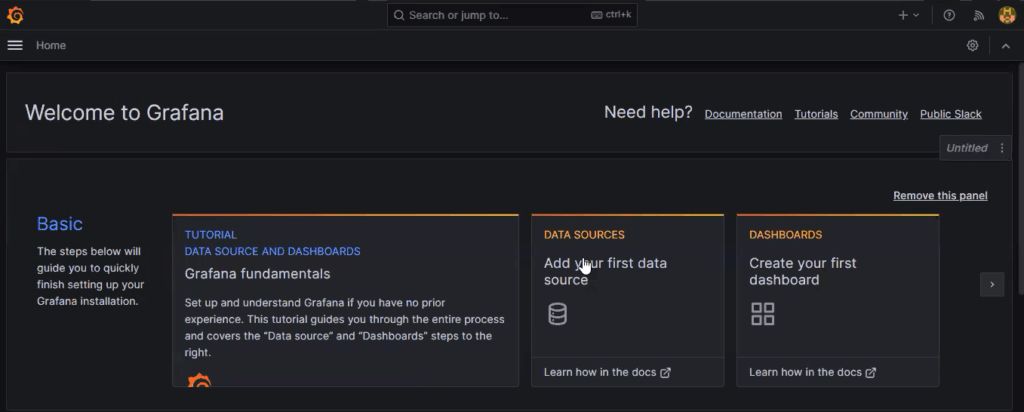
Click Add data source and select Prometheus
For the URL, enter http://localhost:9090 and click Save and test. You can see Data source is working.
Click on Save and Test.
Let’s add Dashboard for a better view in Grafana
Click On Dashboard → + symbol → Import Dashboard
Click on Import Dashboard paste this code 1860 and click on load
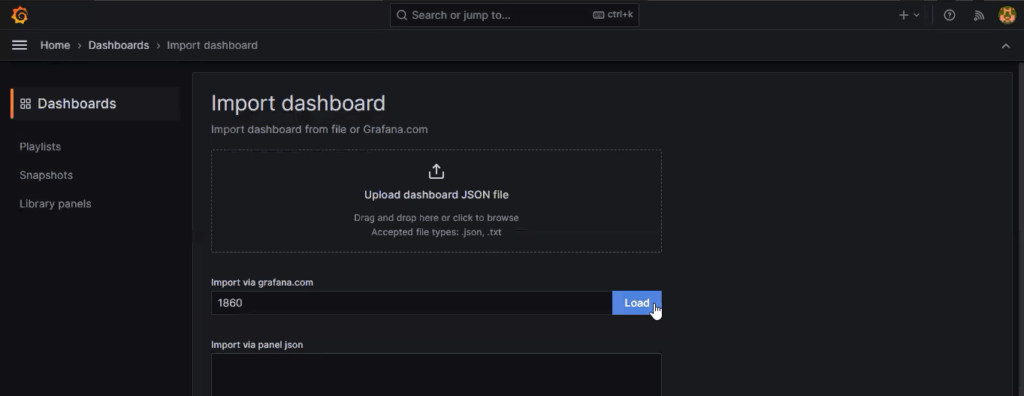
You will see this output

Step #4:Install Jenkins on Ubuntu 22.04 LTS
Installation of Java:
sudo apt update
sudo apt install fontconfig openjdk-17-jre
java -version
Output:
openjdk version "17.0.8" 2023-10-16
OpenJDK Runtime Environment (build 17.0.8+7-Debian-1deb12u1)
OpenJDK 64-Bit Server VM (build 17.0.8+7-Debian-1deb12u1, mixed mode, sharing)
Install Jenkins:
sudo wget -O /usr/share/keyrings/jenkins-keyring.asc \
 https://pkg.jenkins.io/debian/jenkins.io-2023.key
echo deb [signed-by=/usr/share/keyrings/jenkins-keyring.asc] \
  https://pkg.jenkins.io/debian binary/ | sudo tee \
  /etc/apt/sources.list.d/jenkins.list > /dev/null
sudo apt-get update
sudo apt-get install jenkins
You can enable the Jenkins service to start at boot with the command:
sudo systemctl enable jenkins
You can start the Jenkins service with the command:
sudo systemctl start jenkins
You can check the status of the Jenkins service using the command:
sudo systemctl status jenkins
Output:

Step #5:Jenkins Monitoring with Prometheus and Grafana
Go to Manage Jenkins → Plugins → Available Plugins Search for Prometheus and install it
Once that is done you will Prometheus is set to /Prometheus path in system configurations
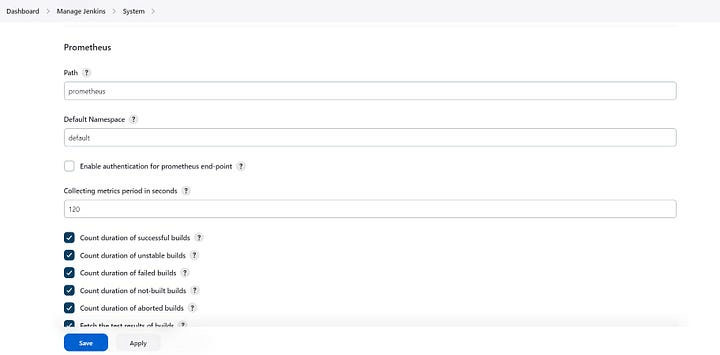
Nothing to change click on apply and save
To create a static target, you need to add job_name with static_configs
sudo vim /etc/prometheus/prometheus.yml
Paste below code
- job_name: 'jenkins'
   metrics_path: '/prometheus'
   static_configs:
     - targets: ['<jenkins-ip>:8080']
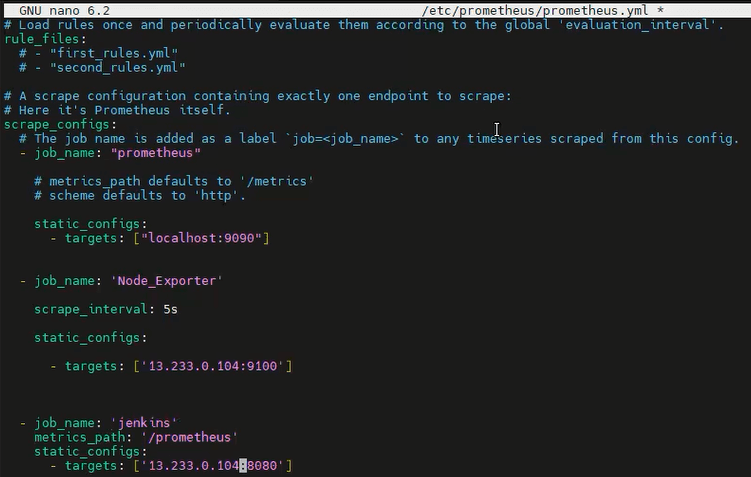
After changes in config file we need to restart prometheus
sudo systemctl restart prometheus
Check the targets section
http://<ip>:9090/targets
You will see Jenkins is added to it

Let’s add Dashboard for a better view in Grafana
Click On Dashboard → + symbol → Import Dashboard
Use Id 9964 and click on load
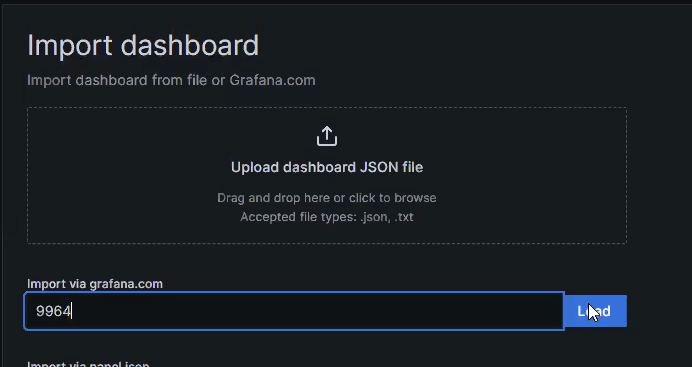
Select the data source and click on Import
Now you will see the Detailed overview of Jenkins
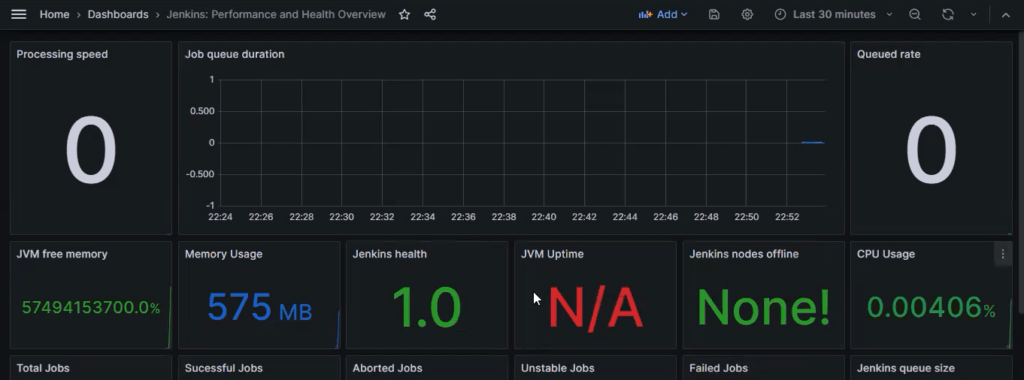
we have covered Jenkins monitoring with Prometheus and Grafana.
Conclusion:
In this article we have covered How to Monitor Jenkins Using Prometheus, Node exporter and Grafana | Jenkins monitoring with Prometheus and Grafana.
Related Articles:
