In this article we will learn Kubernetes Logging using ELK Stack and Filebeat | Setup ELK Stack and Filebeat for Kubernetes logs | How to Set Up ELK Stack and Filebeat for Kubernetes Logging. The ELK stack (Elasticsearch, Logstash, Kibana) is a popular solution for collecting, analyzing, and visualizing log data. Combined with Filebeat, it becomes a powerful tool for managing logs from Kubernetes applications. This guide will walk you through setting up the ELK stack and Filebeat on a Kubernetes cluster using Helm, making it easier to monitor and troubleshoot your applications.
Table of Contents
Prerequisites
- AWS Account with Ubuntu 24.04 LTS EC2 Instance (t3.xlarge).
- Minikube and kubectl, Helm Installed
- Basic knowledge of Kubernetes
Step #1:Set Up Ubuntu EC2 Instance
Update the Package List.
sudo apt update
Installs essential tools like curl, wget and apt-transport-https.
sudo apt install curl wget apt-transport-https -y
Installs Docker, a container runtime that will be used as the VM driver for Minikube.
sudo apt install docker.io -y
Add the current user to the Docker group, allowing the user to run Docker commands without sudo.
sudo usermod -aG docker $USER
Adjust permissions for the Docker socket, enabling easier communication with the Docker daemon.
sudo chmod 666 /var/run/docker.sock
Checks if the system supports virtualization.
egrep -q 'vmx|svm' /proc/cpuinfo && echo yes || echo no
Install KVM and Related Tools.
sudo apt install qemu-kvm libvirt-clients libvirt-daemon-system bridge-utils virtinst libvirt-daemon
Add User to Virtualization Groups.
sudo adduser $USER libvirt
sudo adduser $USER libvirt-qemu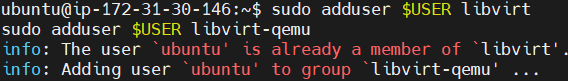
Reload Group.
newgrp libvirt
newgrp libvirt-qemu
Step #2:Install Minikube and kubectl
Download the latest Minikube binary.
curl -LO https://storage.googleapis.com/minikube/releases/latest/minikube-linux-amd64
Install it to /usr/local/bin, making it available system-wide.
sudo install minikube-linux-amd64 /usr/local/bin/minikube
Use minikube version command to confirm the installation.
minikube version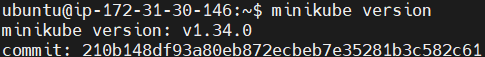
Download the latest version of kubectl (Kubernetes CLI).
curl -LO "https://dl.k8s.io/release/$(curl -L -s https://dl.k8s.io/release/stable.txt)/bin/linux/amd64/kubectl"
Make the kubectl binary executable.
chmod +x ./kubectl
move it to /usr/local/bin
sudo mv kubectl /usr/local/bin/
Use kubectl version command to check the installation.
kubectl version --client --output=yaml
Step #3:Start the Minikube
Start Minikube with Docker as the driver.
minikube start --vm-driver docker --cpus=4 --memory=8192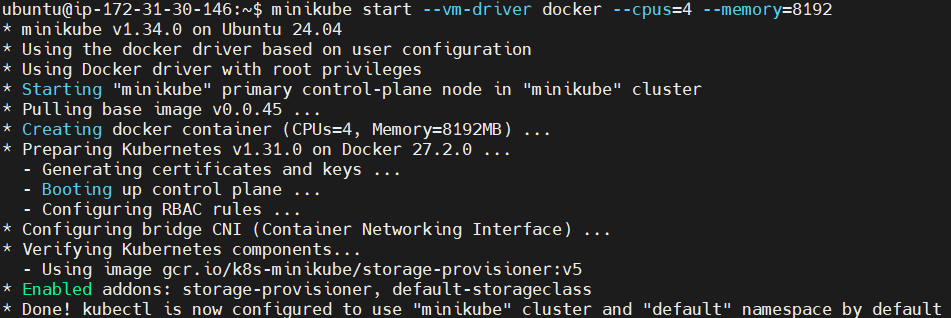
To Check the status of Minikube run the following command.
minikube status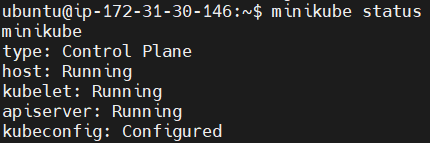
Step #4:Install the Helm
Download the helm, a package manager for Kubernetes.
curl -fsSL -o get_helm.sh https://raw.githubusercontent.com/helm/helm/main/scripts/get-helm-3
Change its permissions.
chmod 700 get_helm.sh
Install the helm.
./get_helm.sh
Check its version to confirm the installation.
helm version
Add the Elastic Helm Repository.
helm repo add elastic https://helm.elastic.co
update the Helm repositories to fetch the latest charts.
helm repo update
Step #5:Deploy the ELK Stack and Filebeat
Create elasticsearch-values.yaml file. This file configures Elasticsearch resources and affinity.
nano elasticsearch-values.yaml
add the following code into it.
resources:
  requests:
    cpu: "200m"
    memory: "200Mi"
  limits:
    cpu: "1000m"
    memory: "2Gi"

antiAffinity: "soft"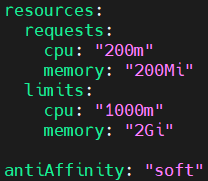
Explanation:
resourcesensures efficient resource allocation for Elasticsearch.antiAffinity: "soft"allows Elasticsearch pods to run on the same node if necessary.
Deploy elasticsearch.
helm install elasticsearch elastic/elasticsearch -f elasticsearch-values.yaml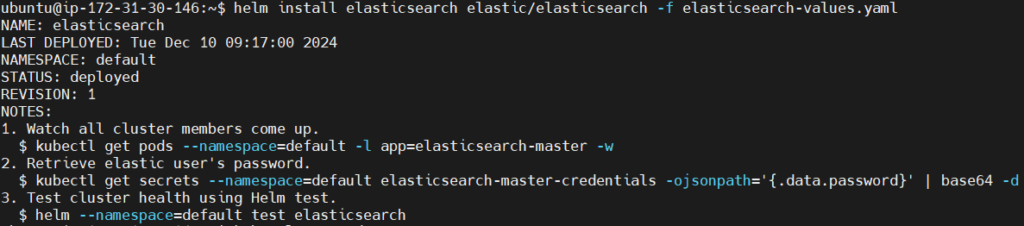
Create a Filebeat configuration file. This file configures Filebeat to collect Kubernetes logs.
nano filebeat-values.yaml
add the following code into it.
filebeatConfig:
  filebeat.yml: |-
    filebeat.inputs:
      - type: container
        paths:
          - /var/log/containers/*.log
        processors:
          - add_kubernetes_metadata:
              host: ${NODE_NAME}
              matchers:
                - logs_path:
                    logs_path: "/var/log/containers/"

    output.logstash:
      hosts: ["logstash-logstash:5044"]
Explanation:
filebeat.inputsspecifies the container logs to monitor.add_kubernetes_metadataenriches logs with Kubernetes pod details.output.logstashforwards logs to Logstash.
Deploy Filebeat.
helm install filebeat elastic/filebeat -f filebeat-values.yaml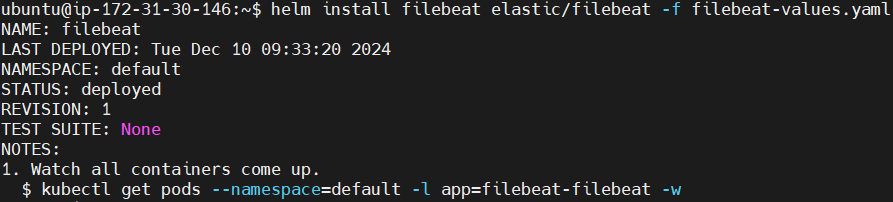
Create a Logstash configuration file. This file configures Logstash to process and forward logs.
nano logstash-values.yaml
add the following code into it.
extraEnvs:
  - name: "ELASTICSEARCH_USERNAME"
    valueFrom:
      secretKeyRef:
        name: elasticsearch-master-credentials
        key: username
  - name: "ELASTICSEARCH_PASSWORD"
    valueFrom:
      secretKeyRef:
        name: elasticsearch-master-credentials
        key: password

logstashConfig:
  logstash.yml: |
    http.host: 0.0.0.0
    xpack.monitoring.enabled: false

logstashPipeline:
  logstash.conf: |
    input {
      beats {
        port => 5044
      }
    }

    output {
      elasticsearch {
        hosts => ["https://elasticsearch-master:9200"]
        cacert => "/usr/share/logstash/config/elasticsearch-master-certs/ca.crt"
        user => '${ELASTICSEARCH_USERNAME}'
        password => '${ELASTICSEARCH_PASSWORD}'
      }
    }

secretMounts:
  - name: "elasticsearch-master-certs"
    secretName: "elasticsearch-master-certs"
    path: "/usr/share/logstash/config/elasticsearch-master-certs"

service:
  type: ClusterIP
  ports:
    - name: beats
      port: 5044
      protocol: TCP
      targetPort: 5044
    - name: http
      port: 8080
      protocol: TCP
      targetPort: 8080

resources:
  requests:
    cpu: "200m"
    memory: "200Mi"
  limits:
    cpu: "1000m"
memory: "1536Mi" 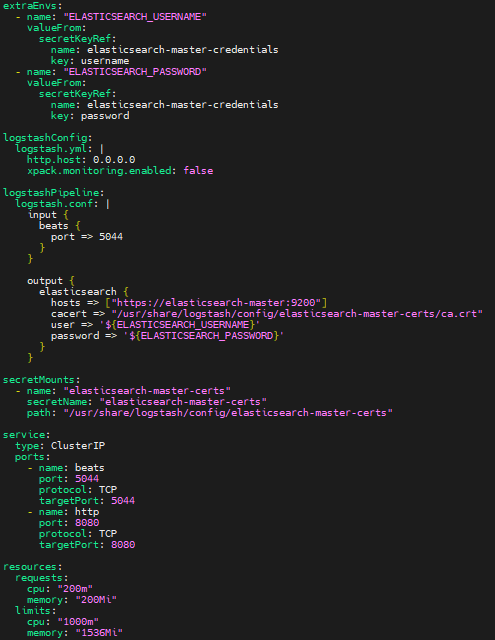
Explanation:
extraEnvsinjects Elasticsearch credentials.logstashPipelinedefines input and output configurations.secretMountsprovides secure access to Elasticsearch certificates.
Deploy Logstash.
helm install logstash elastic/logstash -f logstash-values.yaml
Create a Kibana configuration file.
nano kibana-values.yaml
add the following code into it.
service:
  type: NodePort
  port: 5601

resources:
  requests:
    cpu: "200m"
    memory: "200Mi"
  limits:
    cpu: "1000m"
    memory: "2Gi"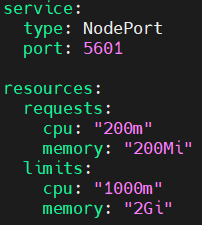
Deploy Kibana.
helm install kibana elastic/kibana -f kibana-values.yaml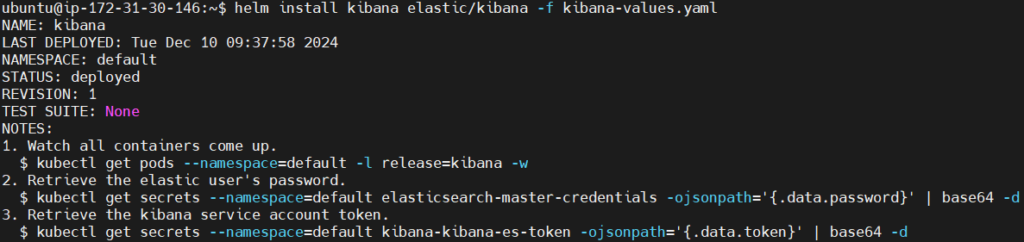
Step #6:Access the ELK Stack
List the services to get the Kibana NodePort details.
kubectl get services
Forward Kibana to Port 5601.
kubectl port-forward --address 0.0.0.0 svc/kibana-kibana 5601:5601
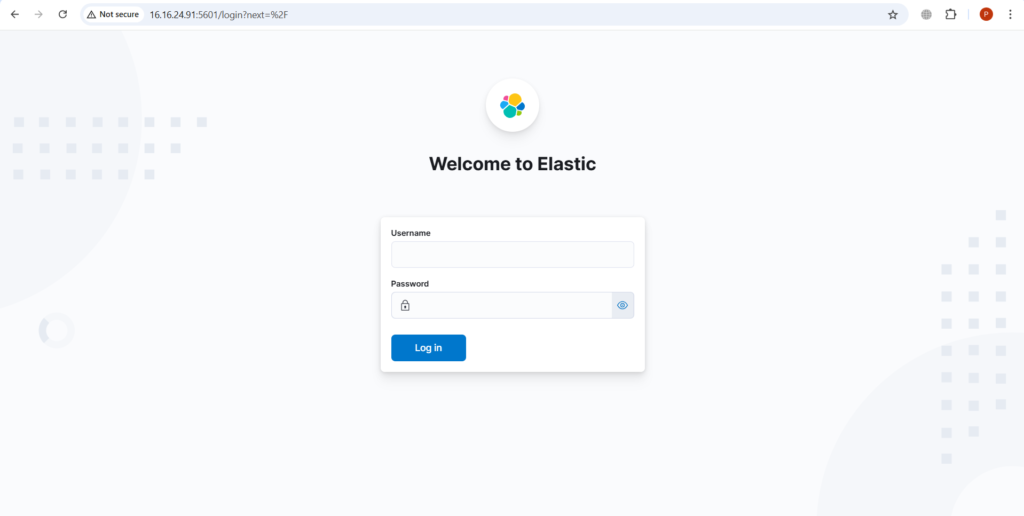
Access Kibana at http://<Public-IP-address>:5601. Replace Public IP address with you instance Public IP address.
Open the duplicate tab and retrieve the Elasticsearch credentials.
kubectl get secret elasticsearch-master-credentials -o jsonpath="{.data.username}" | base64 --decode ; echo
kubectl get secret elasticsearch-master-credentials -o jsonpath="{.data.password}" | base64 --decode ; echo
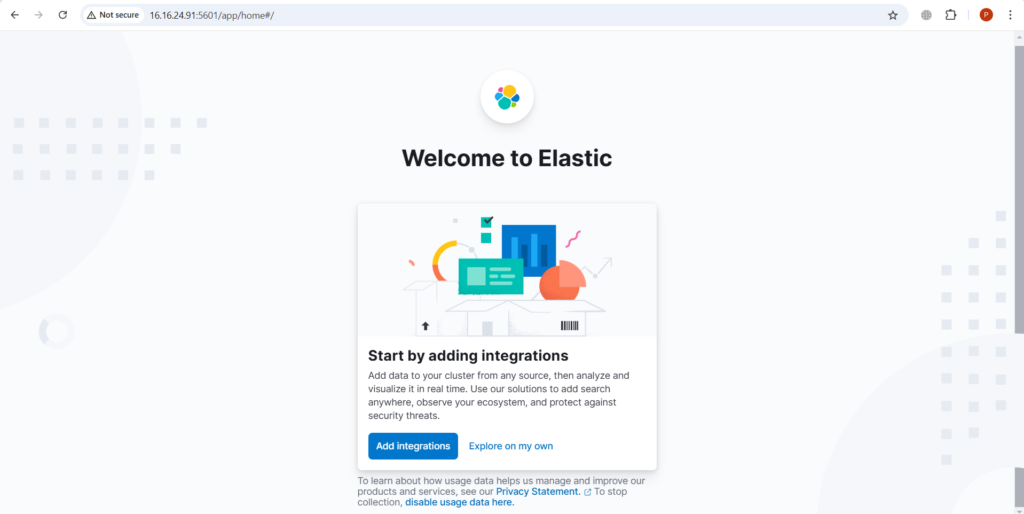
Log into it using the retrieved credentials.

Now you can start exploring. Click on explore on my own
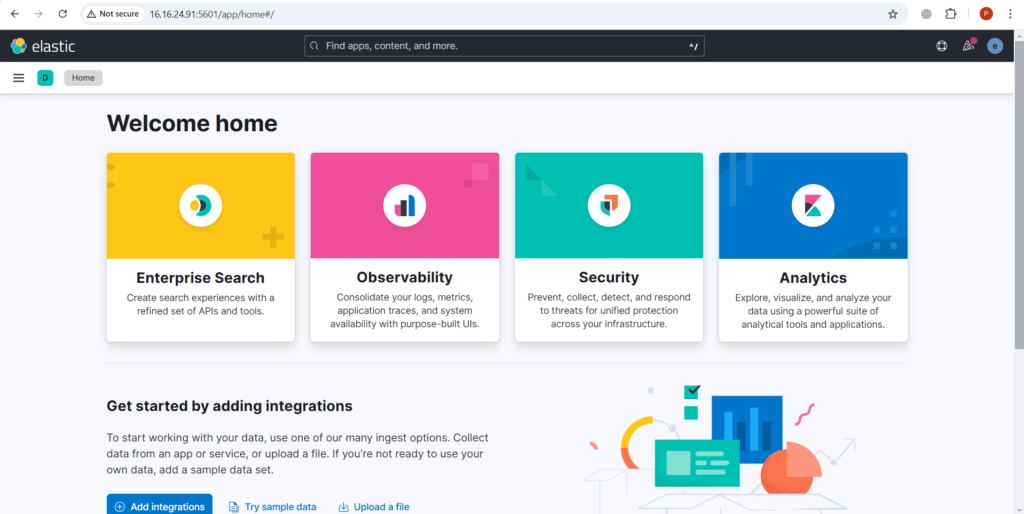
This is the home page.
Go to Logs to see the log data.
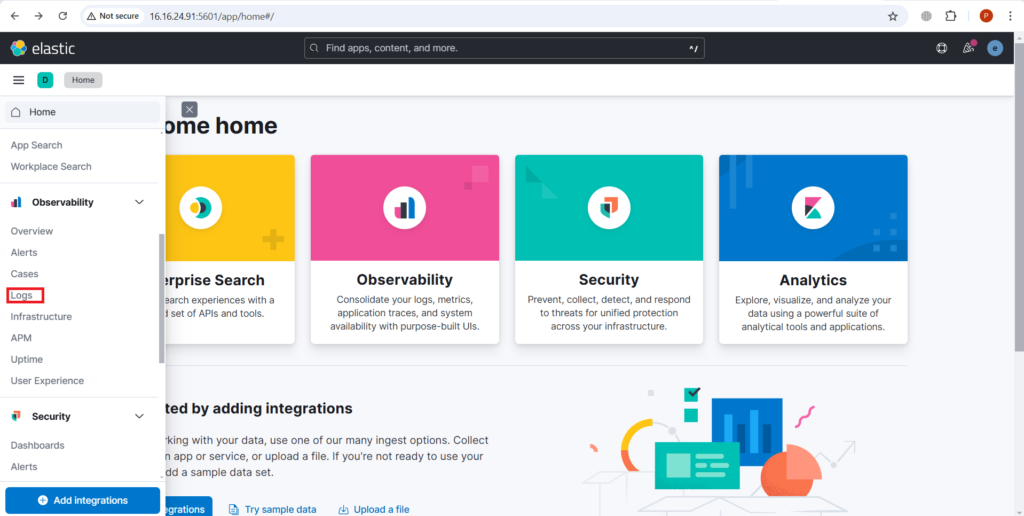
below you can see the logs generated.

Conclusion:
In conclusion, the ELK stack and Filebeat provide robust logging and visualization, helping monitor and troubleshoot your Kubernetes cluster efficiently. By following this guide, you’ve successfully set up the ELK stack and Filebeat for Kubernetes logging. With Elasticsearch storing logs, Kibana visualizing data, and Filebeat collecting logs, you now have a complete logging solution. This setup helps you monitor your Kubernetes applications and identify issues efficiently, ensuring smoother operations in your cluster.
Related Articles:
Instrumenting Java Application with Gradle Using OpenTelemetry Java Agent
Reference: