In this article we will learn Kubernetes Metrics and Logs using Prometheus, Filebeat, and Grafana Loki | about Integrating Prometheus, Filebeat and Logstash with Grafana Loki for Kubernetes Logs and metrics.
In this guide, we’ll walk you through integrating these powerful tools to create a comprehensive observability solution for Kubernetes. By the end of this article, you’ll have a setup that not only tracks metrics with Prometheus but also processes and visualizes logs using Filebeat, Logstash, and Grafana Loki, providing you with a clear view of your cluster’s health and performance.
Table of Contents
Prerequisites
- AWS Account with Ubuntu 24.04 LTS EC2 Instance.
- Minikube and kubectl, Helm Installed
- Basic knowledge of Kubernetes
Step #1:Set Up Ubuntu EC2 Instance
Update the Package List.
sudo apt update
Installs essential tools like curl, wget and apt-transport-https.
sudo apt install curl wget apt-transport-https -y
Installs Docker, a container runtime that will be used as the VM driver for Minikube.
sudo apt install docker.io -y
Add the current user to the Docker group, allowing the user to run Docker commands without sudo.
sudo usermod -aG docker $USER
Adjust permissions for the Docker socket, enabling easier communication with the Docker daemon.
sudo chmod 666 /var/run/docker.sock
Checks if the system supports virtualization.
egrep -q 'vmx|svm' /proc/cpuinfo && echo yes || echo no
Install KVM and Related Tools.
sudo apt install qemu-kvm libvirt-clients libvirt-daemon-system bridge-utils virtinst libvirt-daemon
Add User to Virtualization Groups.
sudo adduser $USER libvirt
sudo adduser $USER libvirt-qemu
Reload Group.
newgrp libvirt
newgrp libvirt-qemu
Step #2:Install Minikube and kubectl
Download the latest Minikube binary.
curl -LO https://storage.googleapis.com/minikube/releases/latest/minikube-linux-amd64
Install it to /usr/local/bin, making it available system-wide.
sudo install minikube-linux-amd64 /usr/local/bin/minikube
Use minikube version command to confirm the installation.
minikube version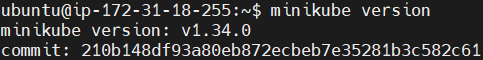
Download the latest version of kubectl (Kubernetes CLI).
curl -LO "https://dl.k8s.io/release/$(curl -L -s https://dl.k8s.io/release/stable.txt)/bin/linux/amd64/kubectl"
Make the kubectl binary executable.
chmod +x ./kubectl
move it to /usr/local/bin
sudo mv kubectl /usr/local/bin/
Use kubectl version command to check the installation.
kubectl version --client --output=yaml
Step #3:Start the Minikube
Start Minikube with Docker as the driver.
minikube start --vm-driver docker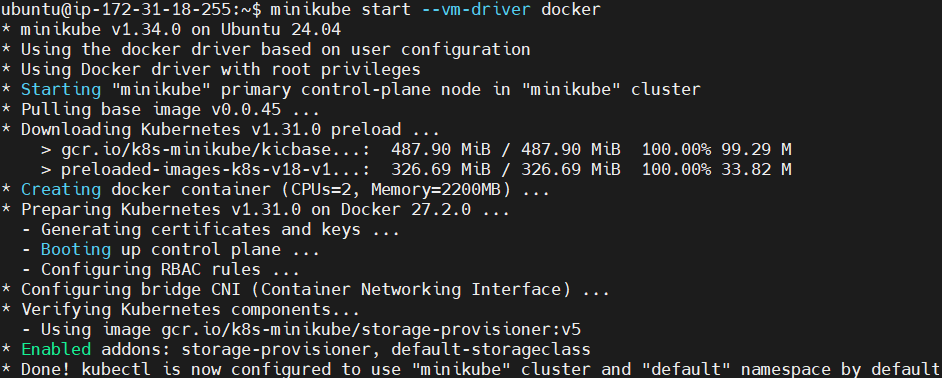
To Check the status of Minikube run the following command.
minikube status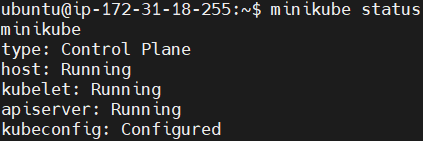
Step #4:Install the Helm
Download the helm, a package manager for Kubernetes.
curl -fsSL -o get_helm.sh https://raw.githubusercontent.com/helm/helm/main/scripts/get-helm-3
Change its permissions.
chmod 700 get_helm.sh
Install the helm.
./get_helm.sh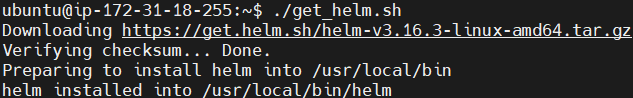
Check its version to confirm the installation.
helm version
Step #5:Customize the Helm Chart Configuration
Add Grafana Helm Chart Repository.
helm repo add grafana https://grafana.github.io/helm-charts
update the Helm repositories to fetch the latest charts.
helm repo update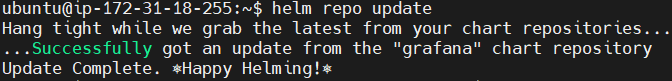
Search for the Loki stack.
helm search repo loki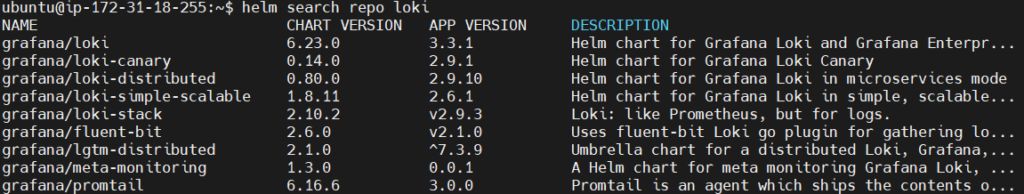
You should see the multiple repositories, but we will use the grafana/loki-stack repository to deploy Grafana, Prometheus, Filebeat, Logstash and to configure Loki.
View the default values for the Loki stack and download them to yaml file. We’ll create a custom configuration file named loki-custom-values.yaml. This file enables Filebeat for log collection, Logstash for advanced log processing, and Prometheus for metrics.
helm show values grafana/loki-stack > loki-custom-values.yaml
Open and edit the custom values file like shown below.
nano loki-custom-values.yaml
Modify it like shown below.
test_pod:
  enabled: true
  image: bats/bats:1.8.2
  pullPolicy: IfNotPresent

loki:
  enabled: true
  isDefault: true
  url: http://{{(include "loki.serviceName" .)}}:{{ .Values.loki.service.port }}
  readinessProbe:
    httpGet:
      path: /ready
      port: http-metrics
    initialDelaySeconds: 45
  livenessProbe:
    httpGet:
      path: /ready
      port: http-metrics
    initialDelaySeconds: 45
  datasource:
    jsonData: "{}"
    uid: ""


promtail:
  enabled: false
  config:
    logLevel: info
    serverPort: 3101
    clients:
      - url: http://{{ .Release.Name }}:3100/loki/api/v1/push

fluent-bit:
  enabled: false

grafana:
  enabled: true
  sidecar:
    datasources:
      label: ""
      labelValue: ""
      enabled: true
      maxLines: 1000
  image:
    tag: 10.3.3
  service:
    type: NodePort

prometheus:
  enabled: true
  isDefault: false
  url: http://{{ include "prometheus.fullname" .}}:{{ .Values.prometheus.server.service.servicePort }}{{ .Values.prometheus.server.prefixURL }}
  datasource:
    jsonData: "{}"
  server:
    service:
      type: NodePort
    persistentVolume:
      ## If true, Prometheus server will create/use a Persistent Volume Claim
      ## If false, use emptyDir
      ##
      enabled: false

filebeat:
  enabled: true
  filebeatConfig:
    filebeat.yml: |
      # logging.level: debug
      filebeat.inputs:
      - type: container
        paths:
          - /var/log/containers/*.log
        processors:
        - add_kubernetes_metadata:
            host: ${NODE_NAME}
            matchers:
            - logs_path:
                logs_path: "/var/log/containers/"
      output.logstash:
        hosts: ["logstash-loki-headless:5044"]

logstash:
  enabled: true
  image: grafana/logstash-output-loki
  imageTag: 1.0.1

  fullnameOverride: logstash-loki

  logstashConfig:
    logstash.yml: |
      http.host: 0.0.0.0
      xpack.monitoring.enabled: false

  logstashPipeline:
    logstash.conf: |
      input {
        beats {
          port => 5044
        }
      }

  filters:
    main: |-
      filter {
        if [kubernetes] {
          mutate {
            add_field => {
              "container_name" => "%{[kubernetes][container][name]}"
              "namespace" => "%{[kubernetes][namespace]}"
              "pod" => "%{[kubernetes][pod][name]}"
            }
            replace => { "host" => "%{[kubernetes][node][name]}"}
          }
        }
        mutate {
          remove_field => ["tags"]
        }
      }
  outputs:
    main: |-
      output {
        loki {
          url => "http://loki:3100/loki/api/v1/push"
          #username => "test"
          #password => "test"
        }
        # stdout { codec => rubydebug }
      }

# proxy is currently only used by loki test pod
# Note: If http_proxy/https_proxy are set, then no_proxy should include the
# loki service name, so that tests are able to communicate with the loki
# service.
proxy:
  http_proxy: ""
  https_proxy: ""
  no_proxy: ""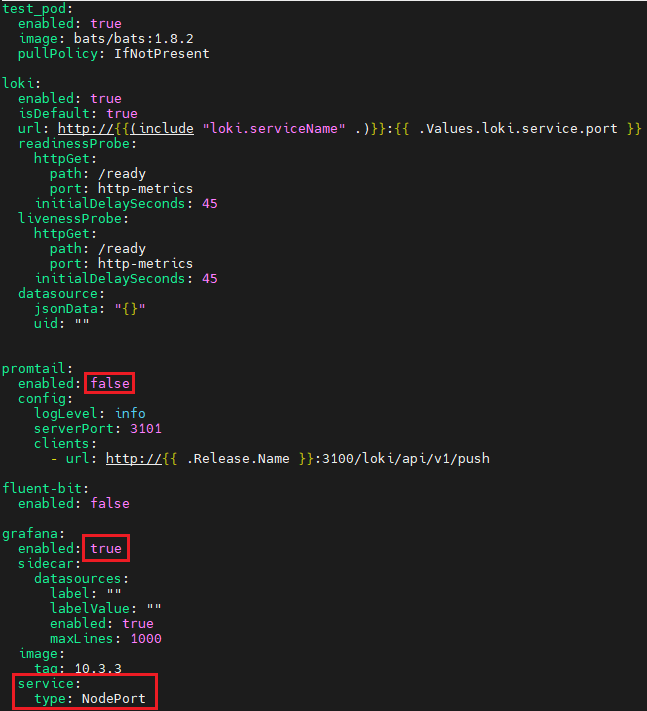

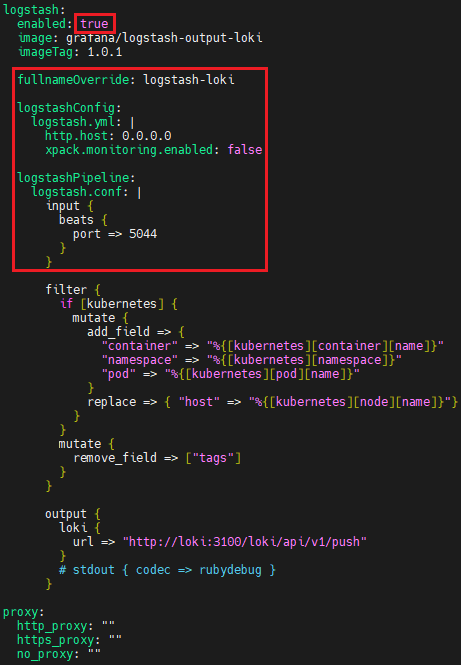
This file configures:
- Filebeat to collect logs from Kubernetes pods.
- Logstash to process logs and forward them to Loki.
- Prometheus for metrics collection.
- Grafana for log and metrics visualization.
Use the following Helm command to deploy the stack. It deploys it in grafana-loki namespace
helm upgrade --install --values loki-custom-values.yaml loki grafana/loki-stack -n grafana-loki --create-namespace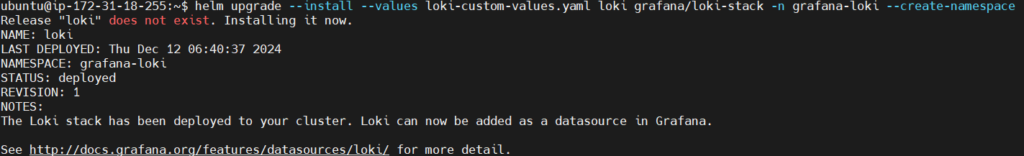
This command deploys Loki, Prometheus, Filebeat, Logstash, Grafana and configures the services as per the custom configuration file.
Step #6:Access Kubernetes Logs in Grafana
First check the pods in the grafana-loki namespace to see if everything is running or not.
kubectl get pods -n grafana-loki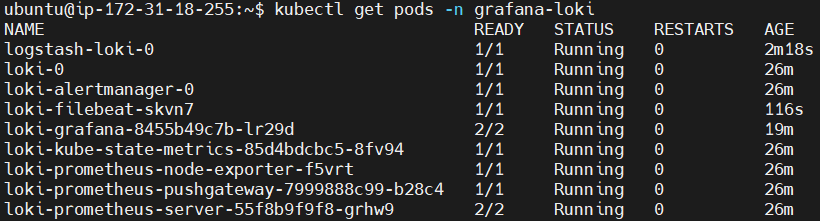
You should see pods for Loki, Grafana, Filebeat, Logstash, and Prometheus.
List the services to get NodePort details.
kubectl get services -n grafana-loki
Forward the loki-grafana to port 3000.
kubectl port-forward -n grafana-loki --address 0.0.0.0 svc/loki-grafana 3000:80
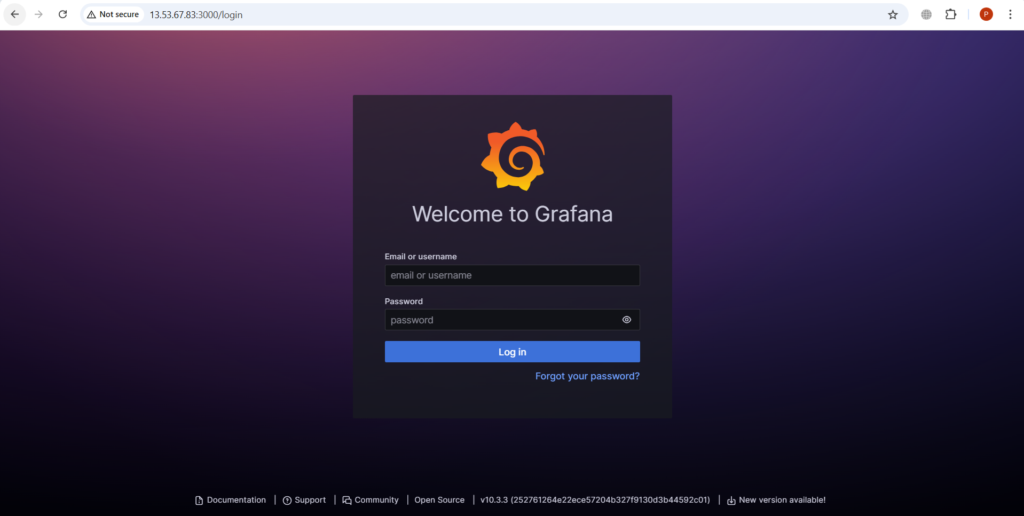
Visit the http://<Public-IP-address>:3100 on web browser.
Retrieve Grafana admin credentials using following commands.
kubectl get secret --namespace grafana-loki loki-grafana -o jsonpath="{.data.admin-user}" | base64 --decode; echo
admin is our Username.
kubectl get secret --namespace grafana-loki loki-grafana -o jsonpath="{.data.admin-password}" | base64 --decode; echo

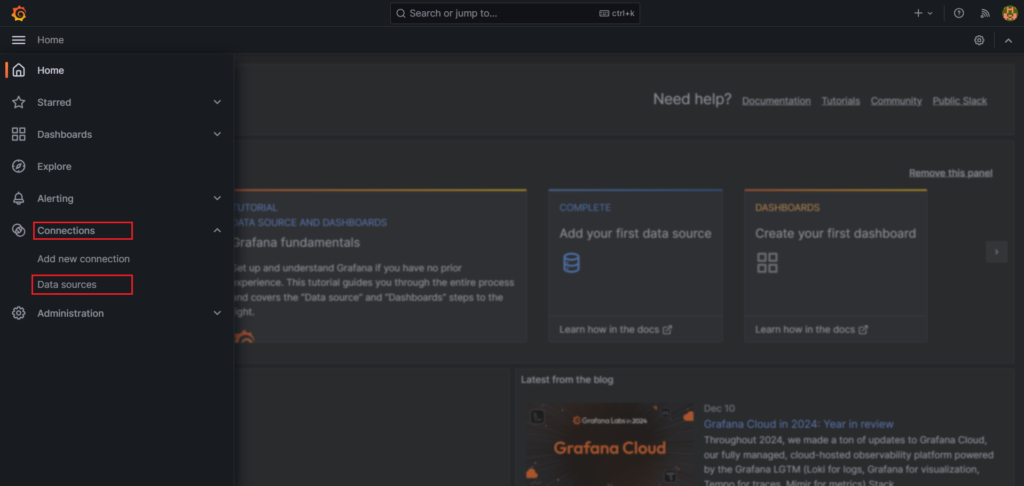
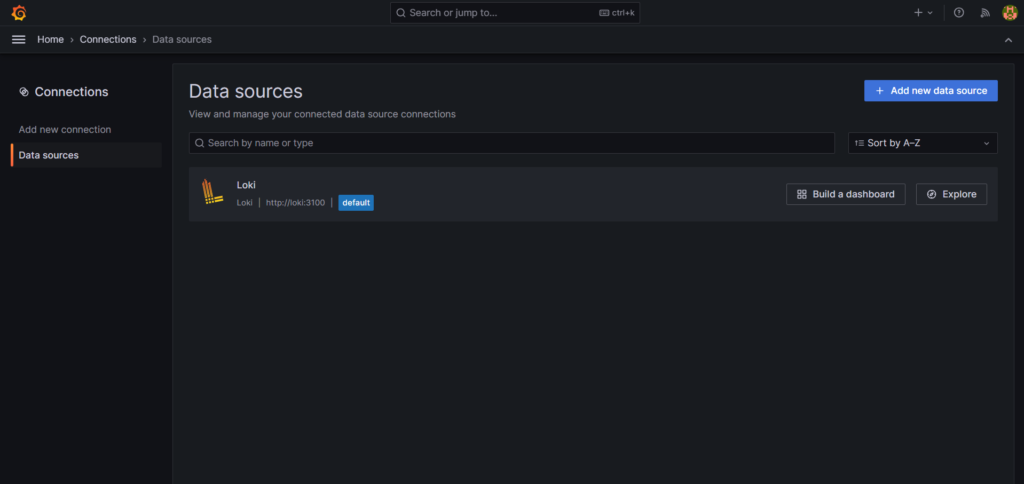
Go to Connections > Data Sources, where you can confirm that Loki has been configured.
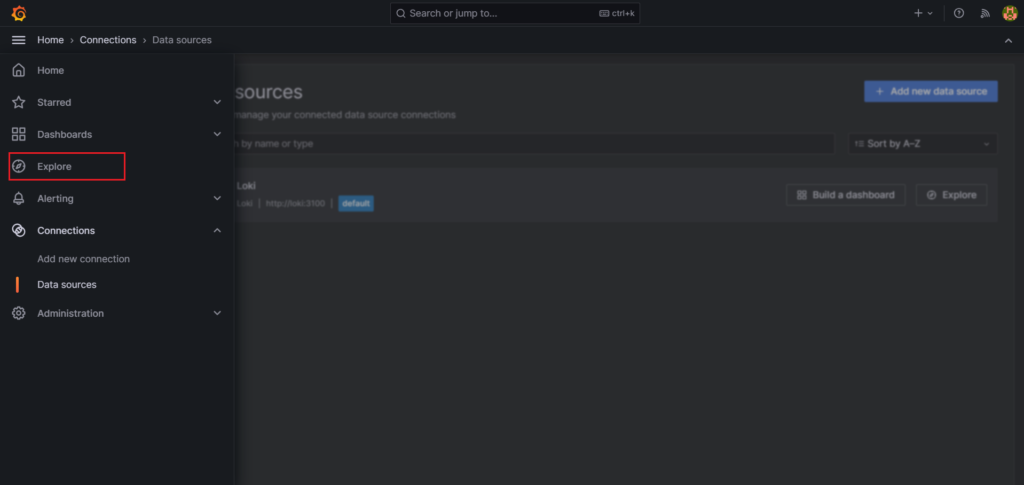
Go to Explore by pressing the Explore button.
Select a label (e.g., namespace) and a value (e.g., grafana-loki). Select in options Instant as a type and Line Limit 1000. Click the blue Run Query button in the top-right corner to view logs.

You can see the Kubernetes logs as shown below.
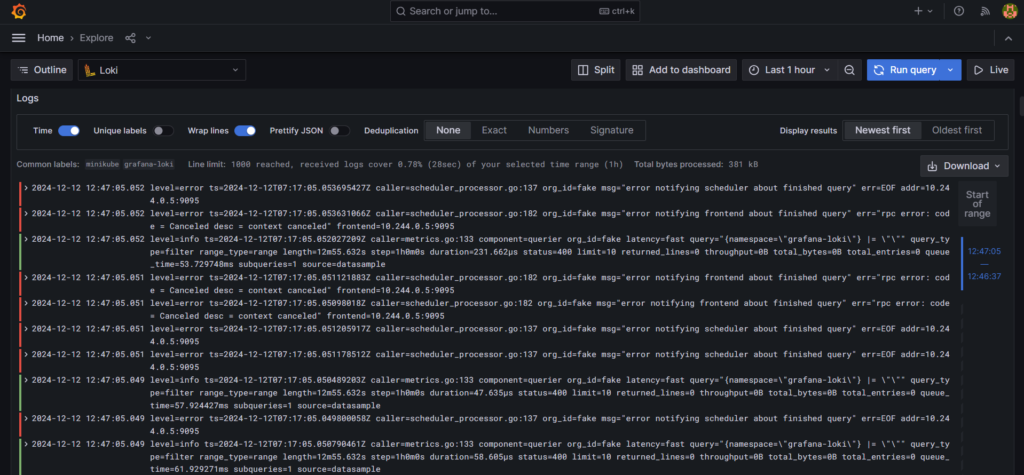
Filebeat collects logs from Kubernetes pods and forwards them to Logstash. Logstash processes the logs received from Filebeat and forwards them to Grafana Loki.
Step #7:Visualize Metrics in Grafana
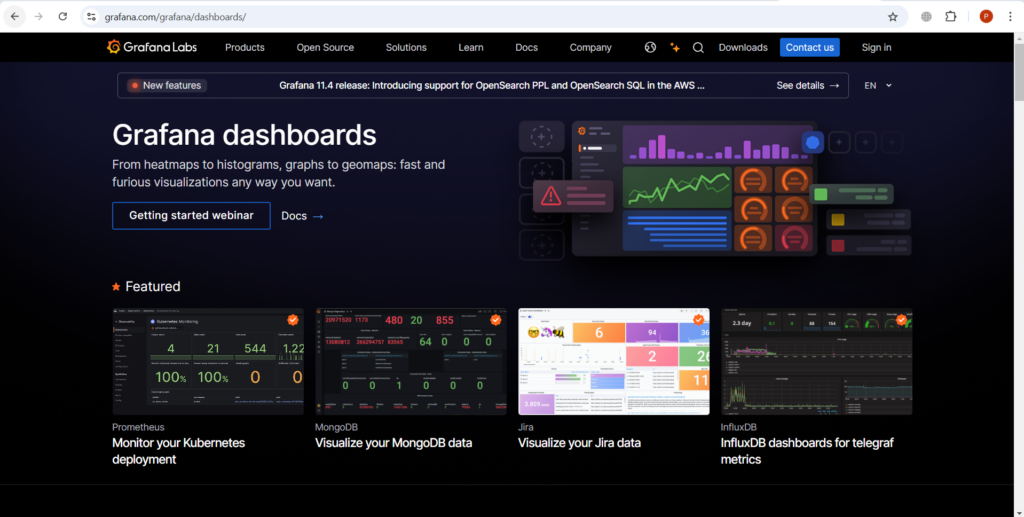
You can also import dashboards from the Grafana library.
Access the Grafana library. Search for Grafana Labs in web browser.
Select a desired dashboard, e.g. kube-state-metrics-v2.
Search for kube-state-metrics-v2.
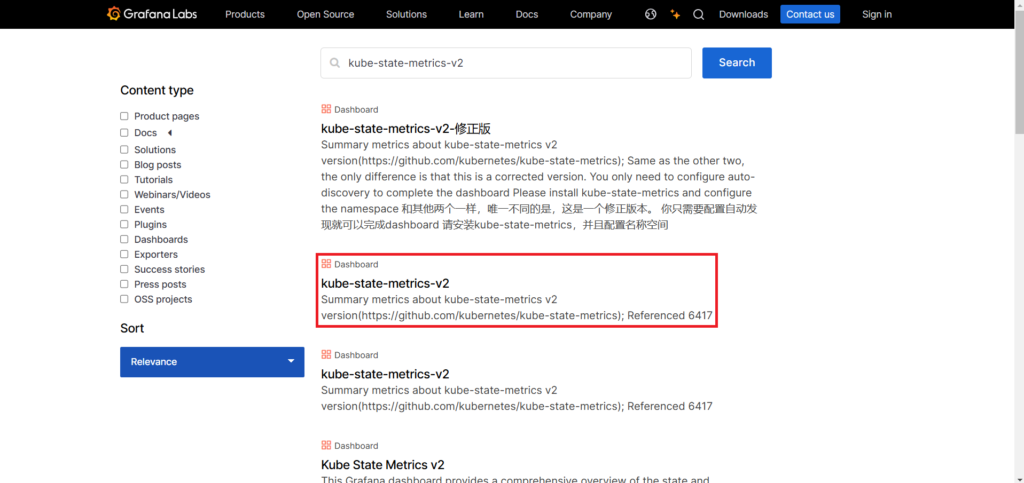
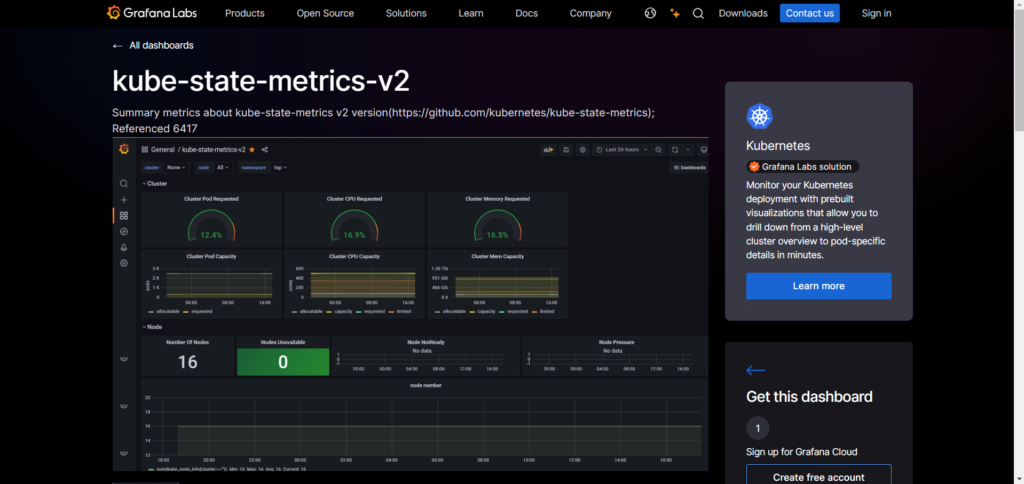
Copy its ID.

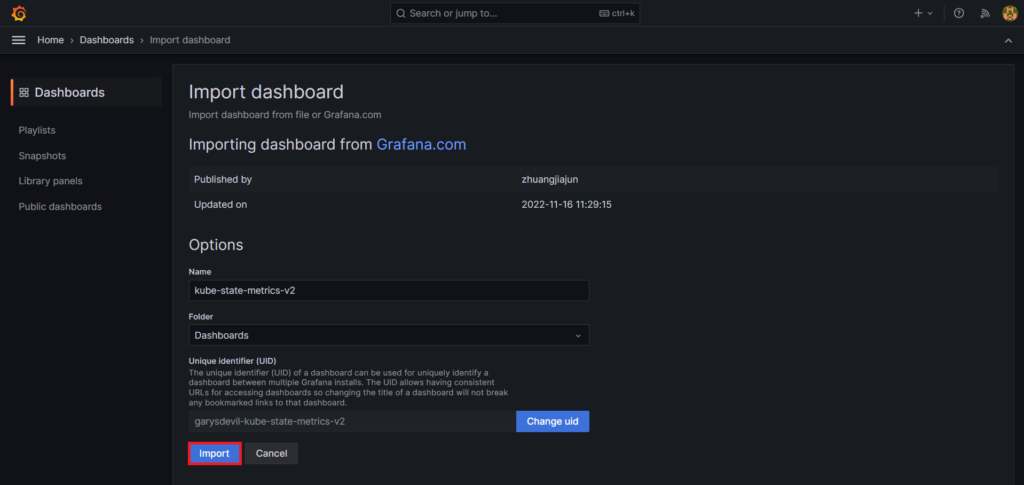
In Grafana, go to Dashboards > New > Import.

Enter the dashboard ID (11455) and click Load.

Click Import to add the dashboard..
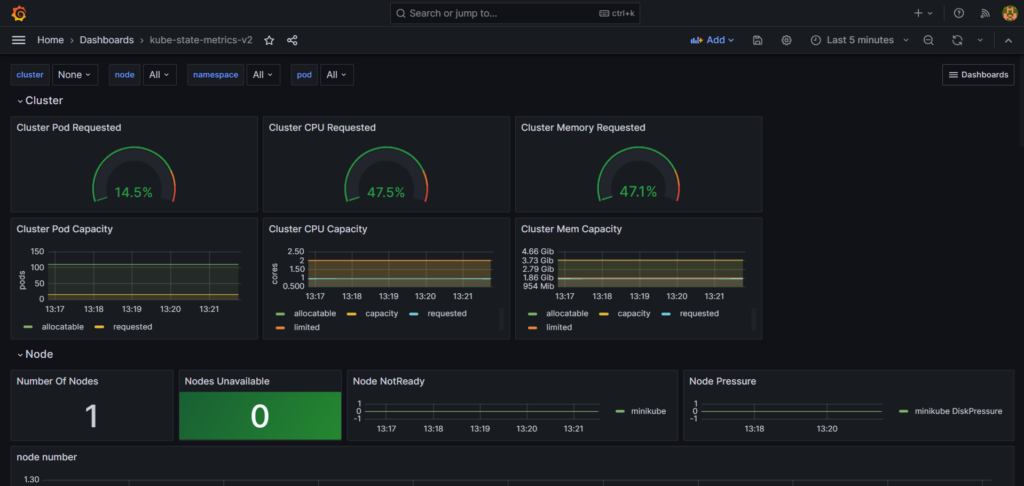
Once loaded, the dashboard will display Kubernetes metrics.
Conclusion:
In conclusion, today we have learn about Integrating Prometheus, Filebeat and Logstash with Grafana Loki for Kubernetes Logs and metrics. With the integration of Prometheus, Filebeat, Logstash, and Grafana Loki, you now have a robust system for monitoring Kubernetes. Prometheus efficiently collects metrics, while Filebeat and Logstash streamline log processing before Grafana Loki stores and visualizes them. Together, these tools provide a holistic view of your cluster, allowing you to detect, troubleshoot, and resolve issues effectively.
By combining logs and metrics in Grafana, you can correlate data to uncover insights that help improve application reliability and performance. This solution not only simplifies monitoring but also equips you with the tools needed to manage Kubernetes at scale with confidence.
Related Articles:
Collect HTTP Metrics for Java App OpenTelemetry and Prometheus
Reference: