In this article, we’ll guide you through the process of configuring Prometheus and Grafana for monitoring AWS EKS. By integrating these tools, you can effectively track metrics, set alerts, and visualize data, ensuring optimal performance for your EKS cluster | Monitoring AWS EKS using Prometheus and Grafana.
Table of Contents
What is Amazon EKS?
Amazon EKS (Elastic Kubernetes Service) is a managed Kubernetes service provided by Amazon Web Services (AWS). It simplifies the process of deploying, managing, and scaling containerized applications using Kubernetes on AWS infrastructure.
With Amazon EKS, users can leverage the power of Kubernetes without the complexity of managing the underlying infrastructure. EKS handles tasks such as cluster provisioning, upgrades, and scaling, allowing developers to focus on building and deploying applications.
Example: Imagine a software development team wants to deploy a microservices-based application using containers. Instead of managing the Kubernetes cluster themselves, they can use Amazon EKS. They define their application’s architecture, specify resource requirements, and deploy it to the EKS cluster. Amazon EKS takes care of provisioning and managing the Kubernetes control plane, worker nodes, networking, and other infrastructure components. This allows the team to focus on developing their application while benefiting from the scalability, reliability, and flexibility of Kubernetes on AWS.
What is Grafana?
Grafana is an open source tool for performing data analytics, retrieving metrics that make sense of large amounts of data, and monitoring our apps using nice configurable dashboards.
Grafana integrates with a wide range of data sources, including Graphite, Prometheus, Influx DB, ElasticSearch, MySQL, PostgreSQL, and others. When connected to supported data sources, it provides web-based charts, graphs, and alerts.
What is Prometheus?

Prometheus is an open-source monitoring and alerting toolkit designed for reliability and scalability in modern, dynamic environments. Developed by the Cloud Native Computing Foundation, Prometheus excels at collecting and storing time-series data, allowing users to gain valuable insights into the performance and health of their applications and infrastructure.
With its powerful query language and support for multi-dimensional data, Prometheus has become a popular choice for monitoring systems within cloud-native ecosystems.
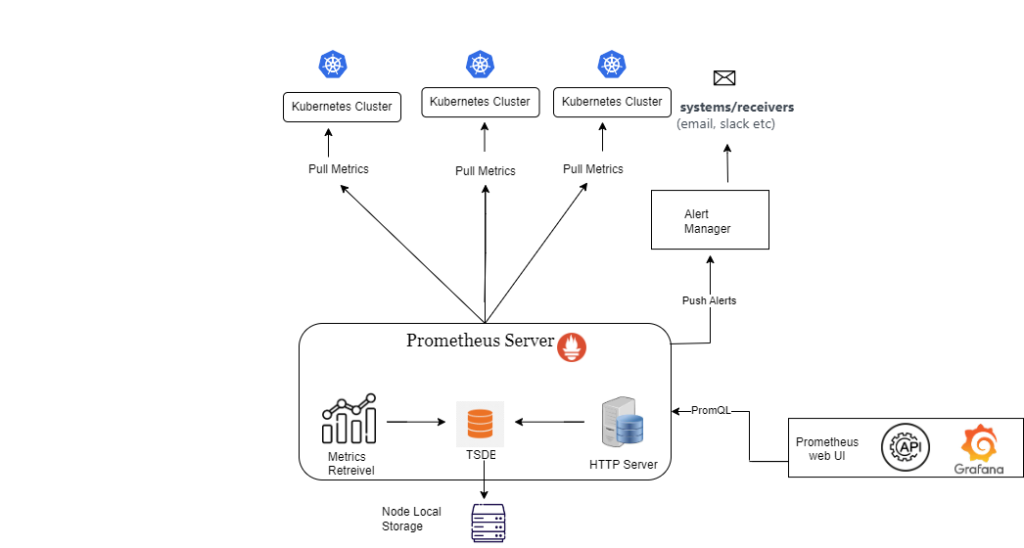
Monitoring AWS EKS Architecture
Why Use Helm?
Helm serves as a package manager tailored for Kubernetes environments. With Helm, deploying complex applications or managing multiple resources becomes simplified and streamlined.
Here’s why leveraging Helm is advantageous:
- Package Management: Helm offers a structured way to manage and organize Kubernetes manifests, making it easier to deploy and manage applications and services within your cluster.
- Simplified Installation: Helm drastically simplifies the installation process by enabling you to install all required components with a single command. This saves time and reduces the chance of missing critical configuration steps.
- Efficiency: By utilizing Helm, you can ensure that your Kubernetes deployments are efficient and consistent. Helm charts encapsulate best practices and standardized configurations, facilitating smoother deployments and reducing the risk of errors.
In essence, Helm empowers Kubernetes users to streamline their deployment workflows, enhance efficiency, and maintain consistency across their infrastructure.
Prerequisites
Before you start creating, you’ll need the following:
- an AWS account;
- identity and access management (IAM) credentials and programmatic access;
- AWS credentials that are set up locally with aws configure;
- AWS Ubuntu 22.04 LTS Instance.
- User with sudo access (see the Initial Server Setup with Ubuntu 22.04 tutorial for details).
- Install some command-line tools .i.e. – eksctl, kubectl, and Helm Chart.
Monitoring AWS EKS using Prometheus and Grafana
Step#1:Install and Setup kubectl on Ubuntu Server
Installing and setting up kubectl configures the command-line interface essential for managing Kubernetes clusters
sudo curl --silent --location -o /usr/local/bin/kubectl https://s3.us-west-2.amazonaws.com/amazon-eks/1.22.6/2022-03-09/bin/linux/amd64/kubectl
sudo chmod +x /usr/local/bin/kubectl
kubectl version --short --client

Step#2:Install and Setup eksctl on Ubuntu Server
Installing and setting up eksctl simplifies the process of creating and managing Amazon EKS clusters with its command-line utility.
curl --silent --location "https://github.com/weaveworks/eksctl/releases/latest/download/eksctl_$(uname -s)_amd64.tar.gz" | tar xz -C /tmp
Move the extracted binary to /usr/local/bin
sudo mv /tmp/eksctl /usr/local/bin
Check whether the installation has been successfully done using
eksctl version

Step#3:Install Helm Chart on Ubuntu Server
Installing Helm Charts involves deploying pre-configured packages onto Kubernetes clusters.
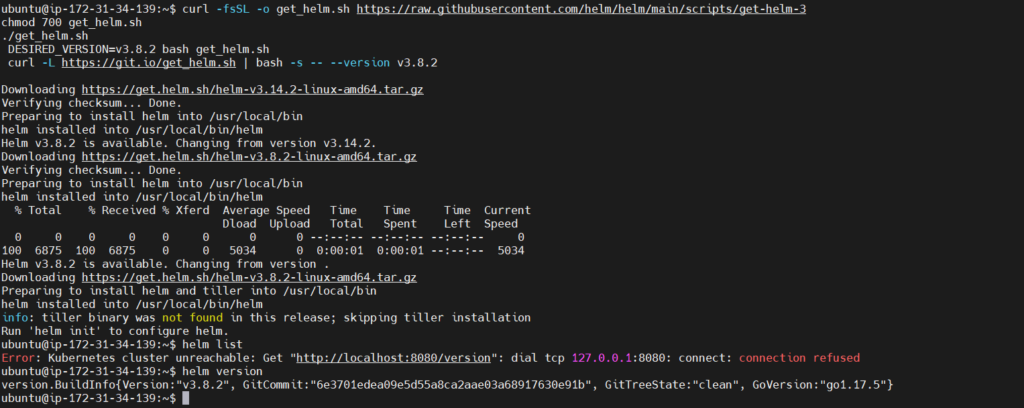
curl -fsSL -o get_helm.sh https://raw.githubusercontent.com/helm/helm/main/scripts/get-helm-3
chmod 700 get_helm.sh
./get_helm.sh
 DESIRED_VERSION=v3.8.2 bash get_helm.sh
 curl -L https://git.io/get_helm.sh | bash -s -- --version v3.8.2
The following script installs Helm, a vital tool for Kubernetes application management. Helm serves as a package manager within the open-source Kubernetes platform, simplifying application installation, updates, and removal.
You can verify the helm installation using
helm version
Now, here we are done with the installation of kubectl, eksctl and Helm
Step#4:Creating an Amazon EKS Cluster using eksctl
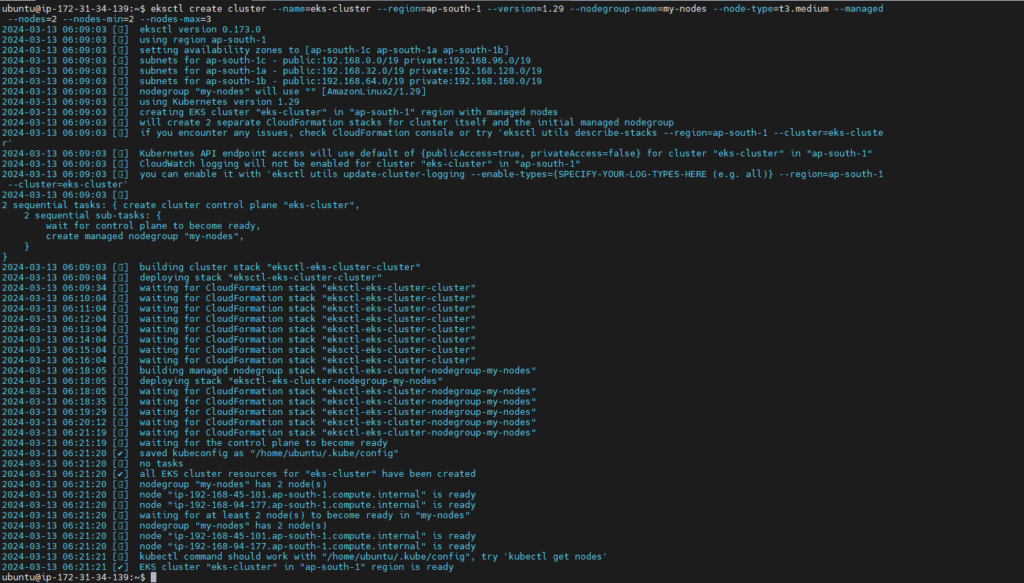
Creating an Amazon EKS Cluster using eksctl streamlines the process of setting up and managing Kubernetes clusters on AWS. It provides a simplified command-line interface for creating EKS clusters with predefined configurations, ensuring efficient cluster deployment.
eksctl create cluster --name=eks-cluster --region=ap-south-1 --version=1.29 --nodegroup-name=my-nodes --node-type=t3.medium --managed --nodes=2 --nodes-min=2 --nodes-max=3
Kindly note that it would take 15–20 minutes for this installation to complete. Once it is done, you can go to your AWS Console and look for the eksctl clusters
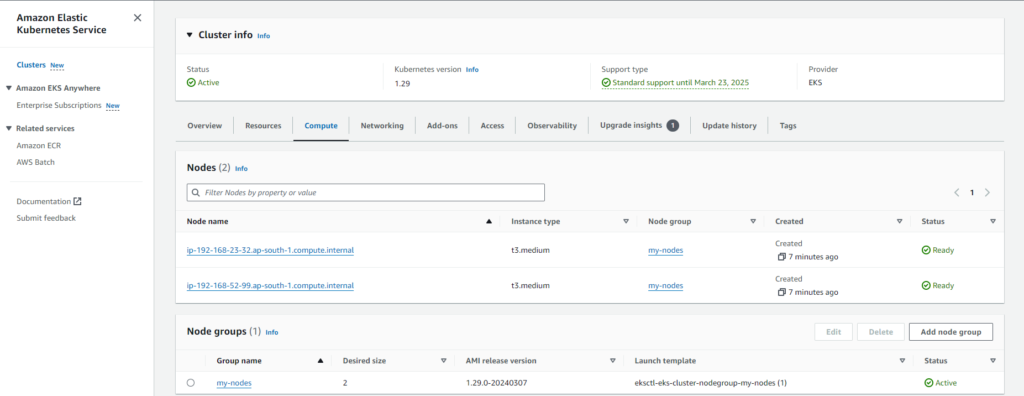
We can verify the cluster by logging into the AWS Console
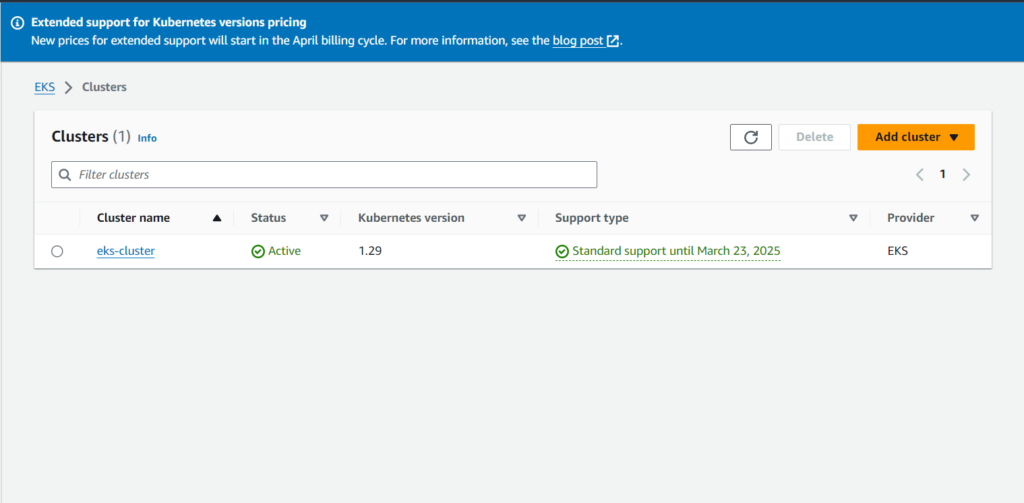
eksctl get cluster --name eks-cluster --region ap-south-1
This should confirm that EKS cluster is up and running.

Update Kube config by entering below command:
aws eks update-kubeconfig --name eks-cluster --region ap-south-1

Connect to EKS cluster using kubectl commands
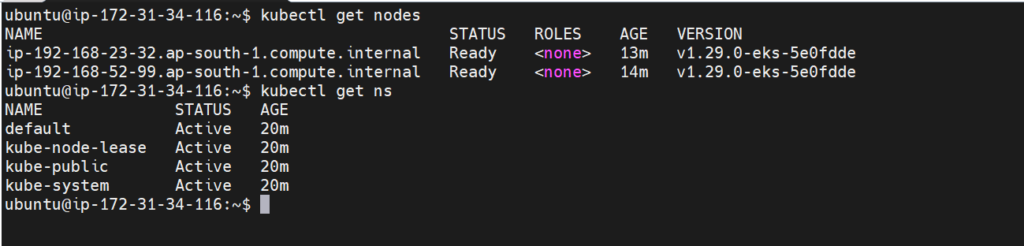
To view the list of worker nodes as part of EKS cluster.
kubectl get nodes
kubectl get ns
Step#5:Add Helm Stable Charts for Your Local Client
We need to add the Helm Stable Charts for your local client. Execute the below command:
helm repo add stable https://charts.helm.sh/stable

Step#6:Add Prometheus Helm Repository
helm repo add prometheus-community https://prometheus-community.github.io/helm-charts

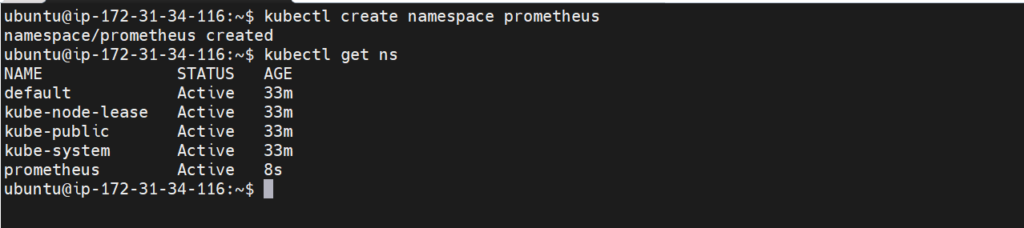
Step#7:Create Prometheus Namespace
kubectl create namespace prometheus
kubectl get ns
Step#8:Install Prometheus using Helm
helm install stable prometheus-community/kube-prometheus-stack -n prometheus
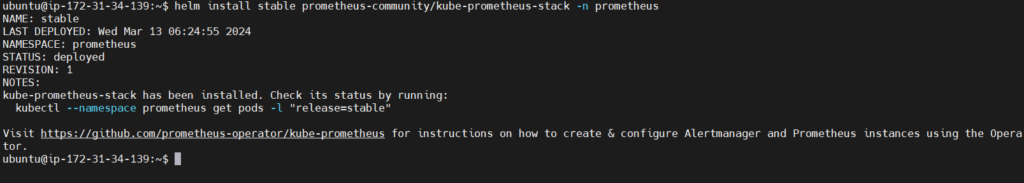
above command is used to install kube-Prometheus-stack. The helm repo kube-stack-Prometheus comes with a Grafana deployment embedded ( as the default one ).
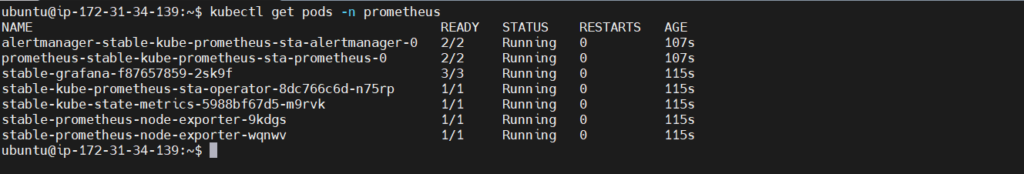
To verify if Prometheus has been successfully installed using Helm on the EC2 instance, you can execute the following command:
kubectl get pods -n prometheus
to check the services file (svc) of the Prometheus
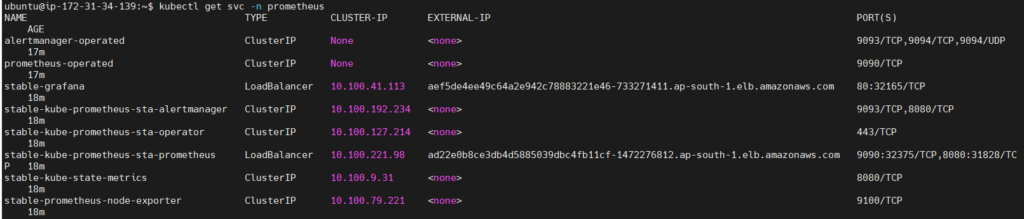
kubectl get svc -n prometheus
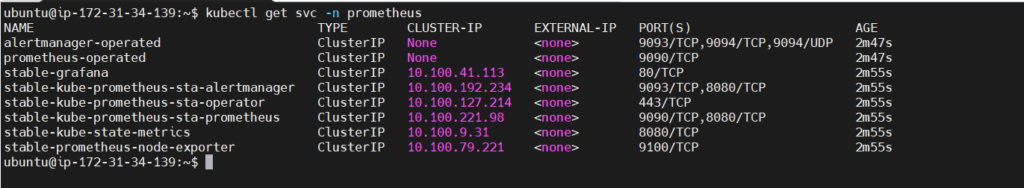
The inclusion of Grafana alongside Prometheus in the stable version confirms the successful installation of Prometheus. Since Grafana is bundled with Prometheus, there’s no need for a separate installation.
Step#9:Expose Prometheus and Grafana to the external world
Let’s expose Prometheus and Grafana to the external world
there are 2 ways to expose
1. through Node Port
2. through LoadBalancer
let’s go with the LoadBalancer
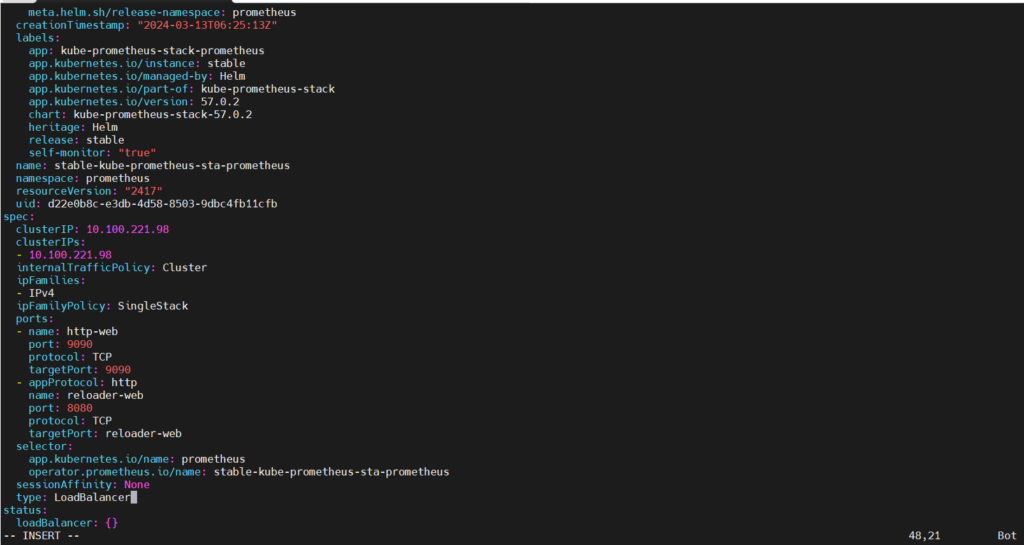
to attach the load balancer we need to change from ClusterIP to LoadBalancer
command to get the svc file
kubectl edit svc stable-kube-prometheus-sta-prometheus -n prometheus
change it from Cluster IP to LoadBalancer after changing make sure you save the file

kubectl get svc -n prometheus
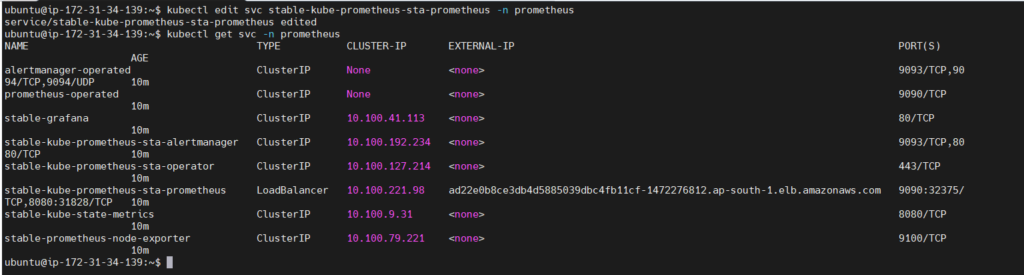
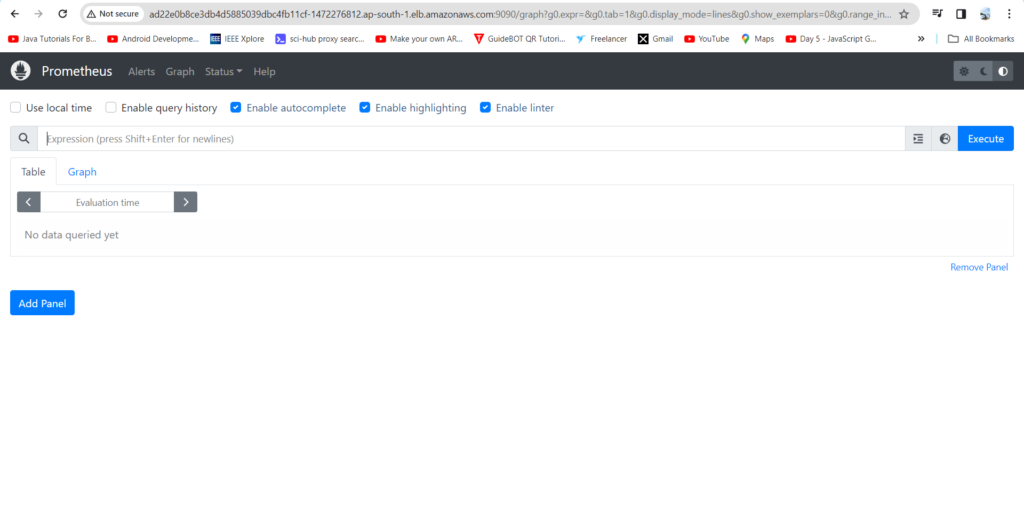
As evidenced, a load balancer has been provisioned for Prometheus, allowing access via the link provided on port 9090.
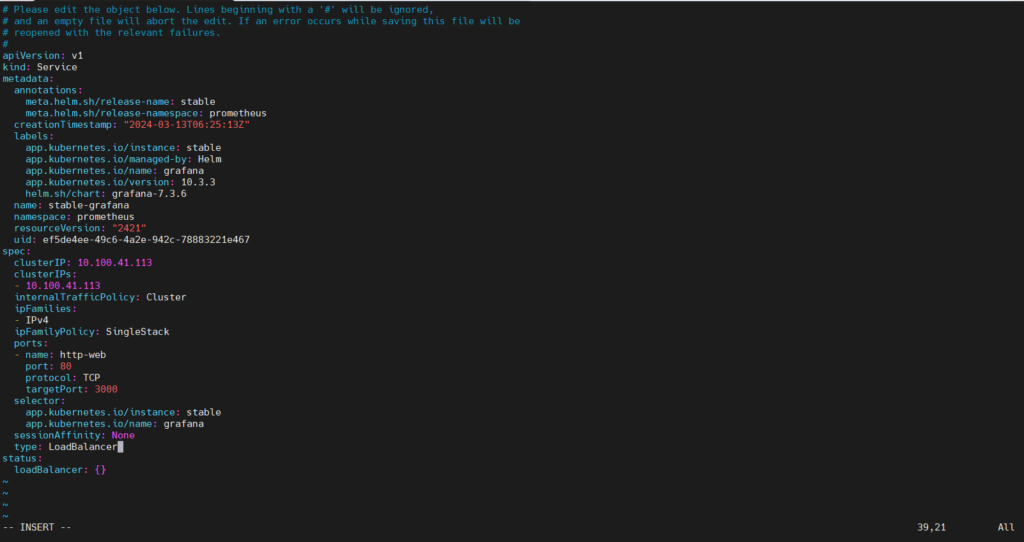
Now,let’s change the SVC file of the Grafana and expose it to the outer world
command to edit the SVC file of grafana
kubectl edit svc stable-grafana -n prometheus

kubectl get svc -n prometheus
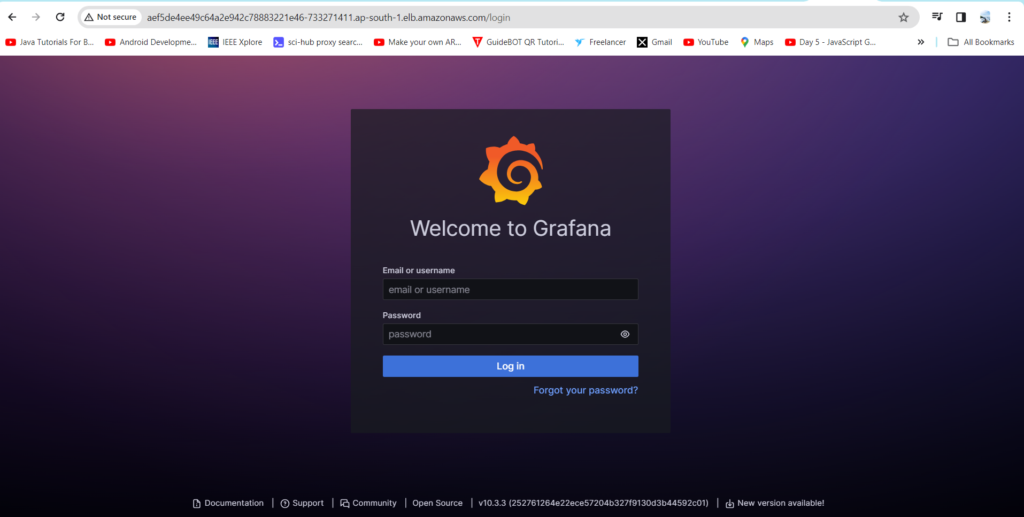
use the link of the LoadBalancer and access from the Browser
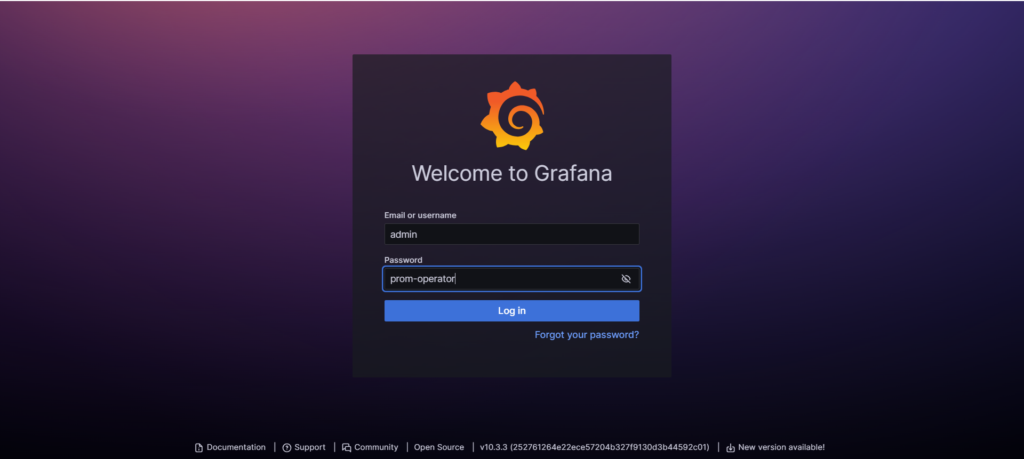
kubectl get secret --namespace prometheus stable-grafana -o jsonpath="{.data.admin-password}" | base64 --decode ; echo

use the above command to get the password
the user name is admin
Now, view the Dashboard in Grafana
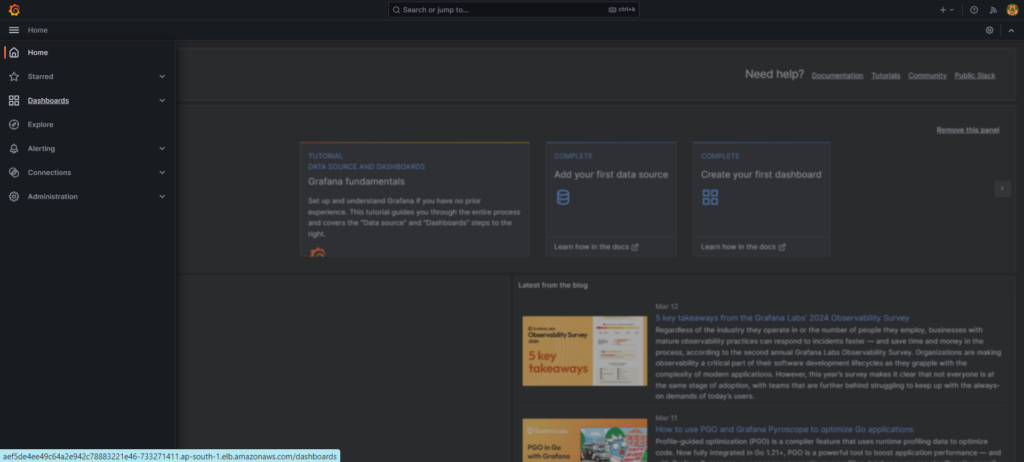
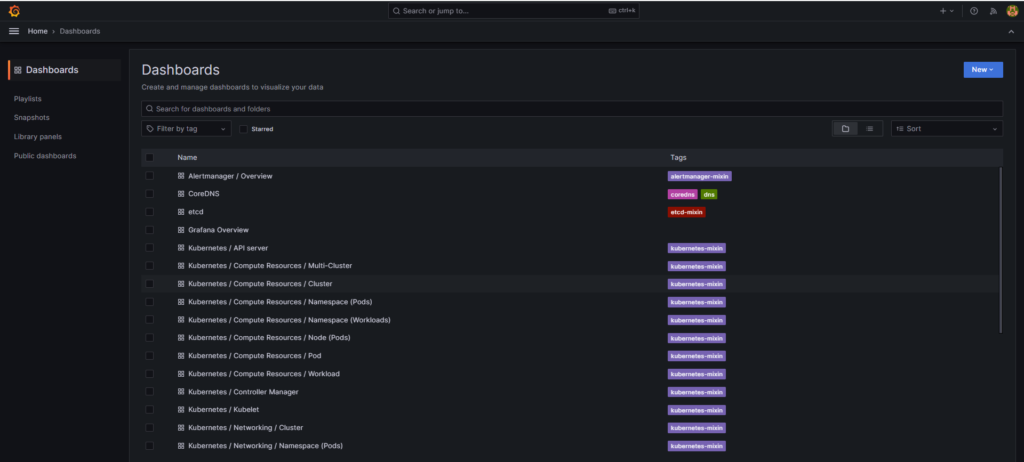
the Entire data of the cluster
where we can able to see the entire data of the EKS cluster
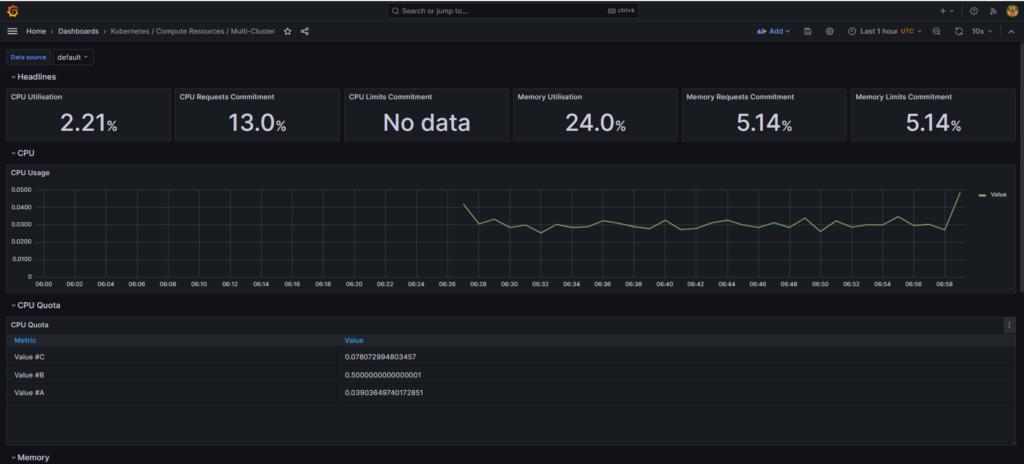
1. CPU and RAM use
2. pods in a specific namespace
3. Pod up history
4. HPA
5. Resources by Container
CPU used by container & limits
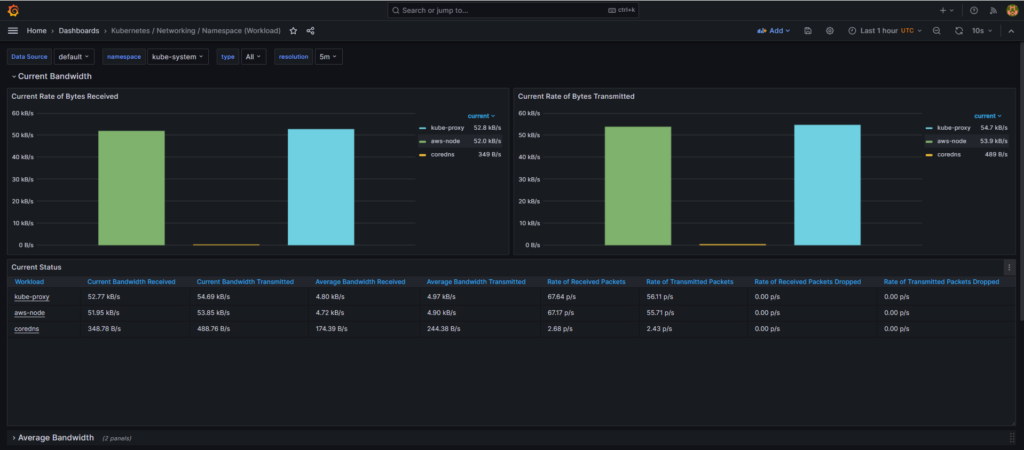
network bandwidth & packet rate
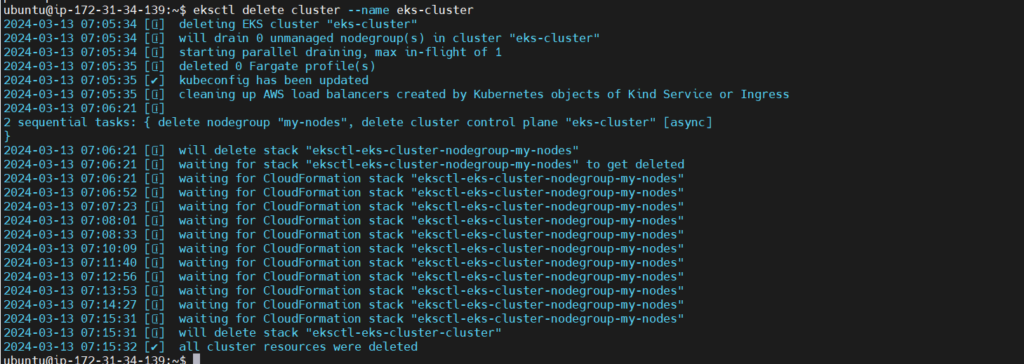
Step#10:Clean up/Deprovision-Deleting the Cluster
Now we will delete all our resources.
eksctl delete cluster --name eks-cluster
Conclusion:
In conclusion, setting up Prometheus and Grafana dashboards for monitoring AWS EKS offers a robust solution for observing and managing your Kubernetes clusters. With Prometheus collecting metrics and Grafana providing visualization capabilities, users gain insights into cluster health, resource utilization, and performance metrics.
Reference:-
For reference visit the official website .
Any queries pls contact us @Fosstechnix.com.
Related Articles:
Thanks this really helps