In this article, we’ll detail how to utilize Prometheus and Grafana to monitor MongoDB deployments, ensuring performance, availability, and stability. By combining Prometheus’ metric scraping capabilities with Grafana’s visualization tools, we’ll establish a comprehensive solution to monitor MongoDB in a concise, actionable guide.
Table of Contents
Prerequisites
- AWS Account with Ubuntu 22.04 LTS EC2 Instance.
- Basic knowledge of AWS services, Prometheus and Grafana
Step #1:Install MongoDB on Ubuntu
Update the system before start installation process.
sudo apt update 
Then import the public key used by the package management system.
sudo apt-get install gnupg curl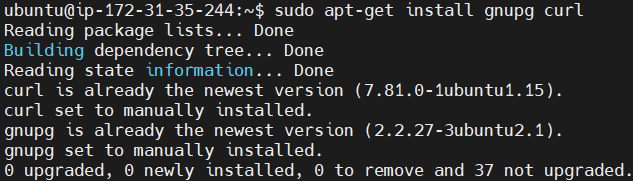
To import the MongoDB public GPG key, run the following command.
curl -fsSL https://www.mongodb.org/static/pgp/server-7.0.asc | \
   sudo gpg -o /usr/share/keyrings/mongodb-server-7.0.gpg \
   --dearmor
Create the /etc/apt/sources.list.d/mongodb-org-7.0.list file for Ubuntu 22.04.
echo "deb [ arch=amd64,arm64 signed-by=/usr/share/keyrings/mongodb-server-7.0.gpg ] https://repo.mongodb.org/apt/ubuntu jammy/mongodb-org/7.0 multiverse" | sudo tee /etc/apt/sources.list.d/mongodb-org-7.0.list
Reload the local package database using following command.
sudo apt-get update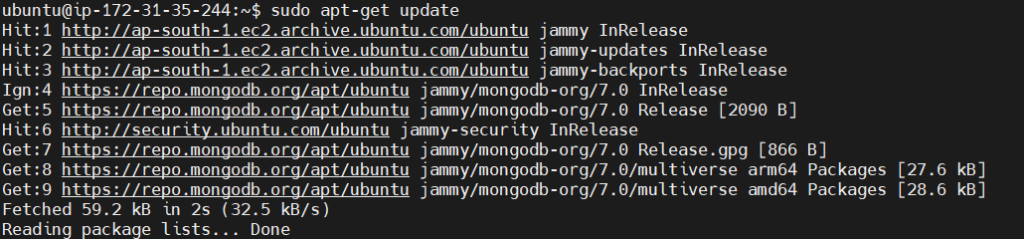
Install the latest stable version of MongoDB using following command.
sudo apt-get install -y mongodb-org
After this reload the daemon service and also enable the mongod and after that start the mongod.
sudo systemctl daemon-reload
sudo systemctl enable mongod
sudo systemctl start mongod
Check the status to if MongoDB is running successfully.
sudo systemctl status mongod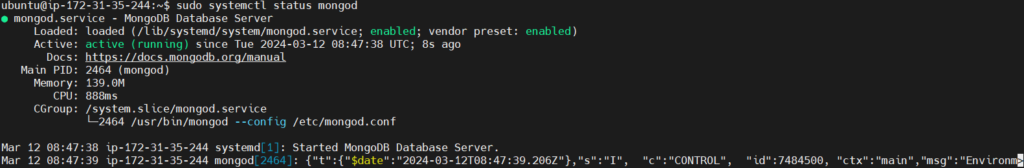
Step #2:Install Prometheus on Ubuntu
From the github repo, download the latest version of Prometheus using the following command.
wget https://github.com/prometheus/prometheus/releases/download/v2.30.0/prometheus-2.30.0.linux-amd64.tar.gz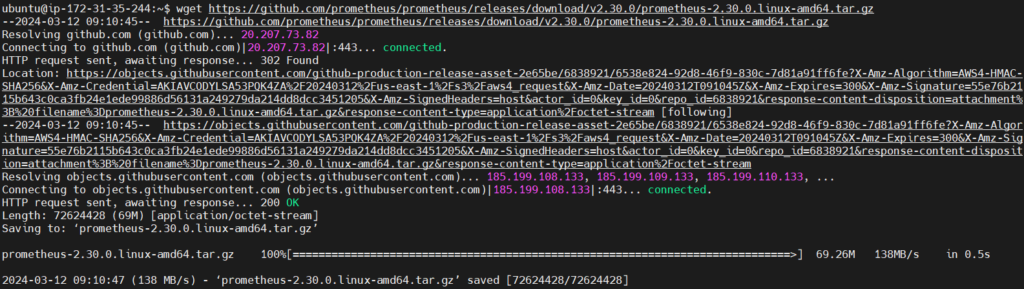
Extract the downloaded archives after the completion of download.
tar xvfz prometheus-2.30.0.linux-amd64.tar.gzThe command extracts the contents of the file prometheus-2.30.0.linux-amd64.tar.gz
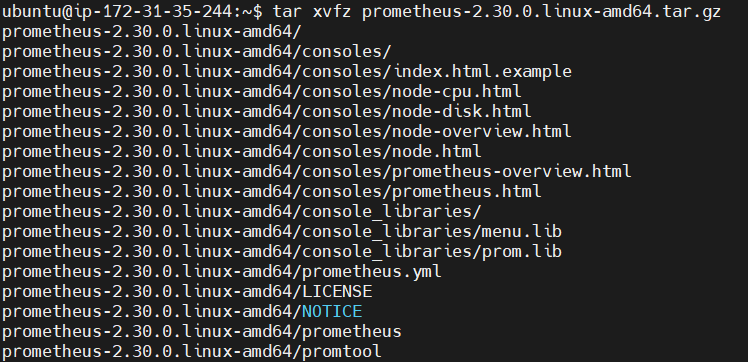
now let’s move into the extracted directory using following command.
cd prometheus-2.30.0.linux-amd64
navigate to the /etc/systemd/system, this is where typically systemd unit files are located, which are used for managing services on Linux systems.
cd /etc/systemd/system
now lets create a service named prometheus.service for Prometheus.
sudo vi prometheus.service
add the following block into it.
[Unit]
Description=Prometheus
Wants=network-online.target
After=network-online.target

[Service]
ExecStart=/home/ubuntu/prometheus-2.30.0.linux-amd64/prometheus --config.file=/home/ubuntu/prometheus-2.30.0.linux-amd64/prometheus.yml
Restart=always

[Install]
WantedBy=default.target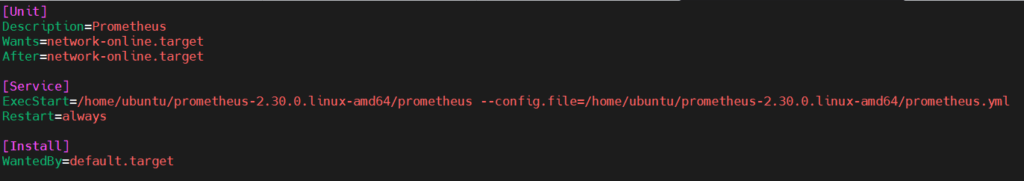
Now we’ve created our prometheus.service.
After this firstly reload the daemon service to verify our configuration file is correct then enable the Prometheus service and at last start the service.
sudo systemctl daemon-reload
sudo systemctl enable prometheus.service
sudo systemctl start prometheus.service
now check the status to see if the Prometheus service is running properly by running following command:
sudo systemctl status prometheus.service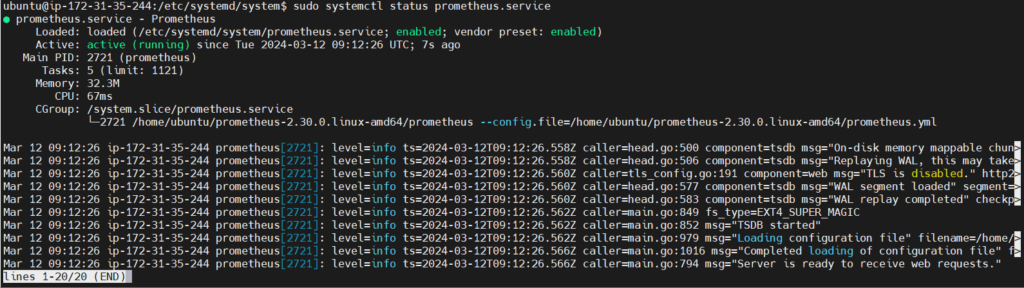
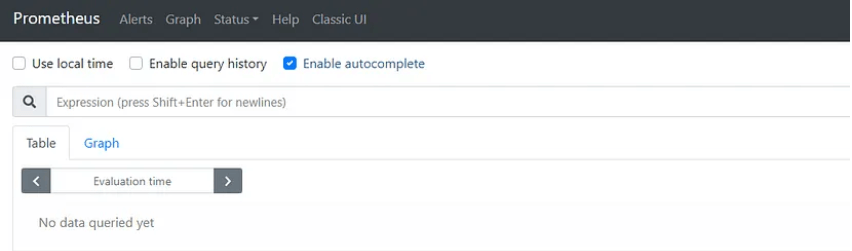
If your service is running properly then you can run prometheus by running your public ip address with port 9090 which is default port for prometheus in url.
Step #3:Install Grafana on Ubuntu
First import the GPG key used by the Grafana package.
wget -q -O - https://packages.grafana.com/gpg.key | sudo apt-key add -
Add the Grafana repository to the APT sources.
sudo add-apt-repository "deb https://packages.grafana.com/oss/deb stable main"
Update the package lists before installing in Grafana.
sudo apt update
now lets install the grafana
sudo apt install grafana
Start the Grafana service
sudo systemctl start grafana-serverthen enable the grafana service.
sudo systemctl enable grafana-server
and if everything works fine and you see your service is running properly then run the grafana by running your public ip address and port number 3000 which is default port of grafana in searchbar.
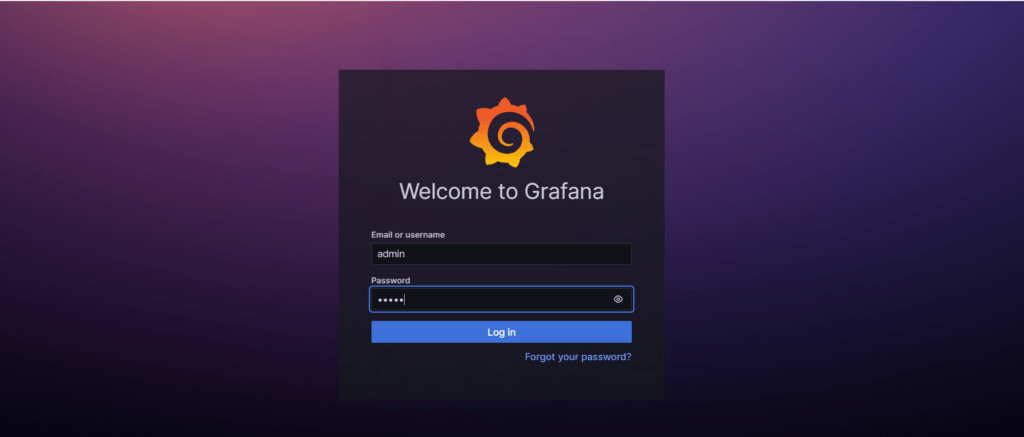
you will see the login page of grafana (UI) user interface
Grafana has admin as default username and password
it will ask for changing the password you can change the password or skip it.
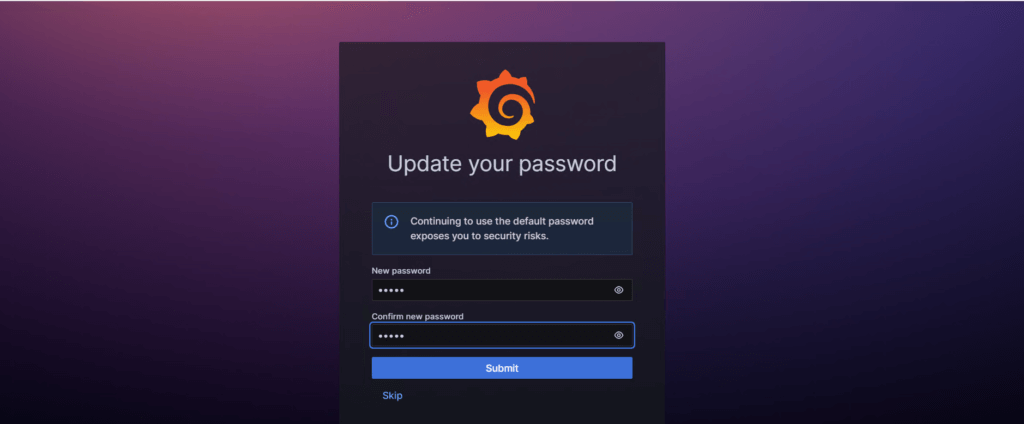
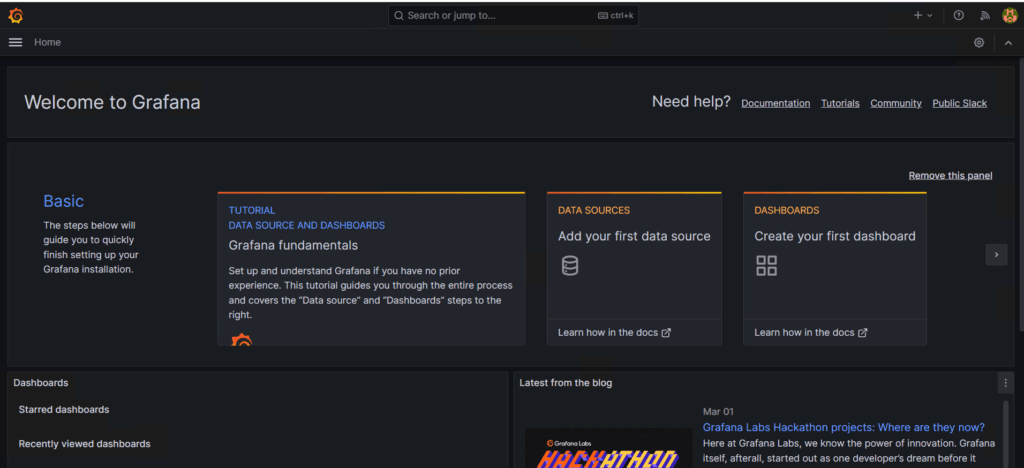
then you will see the welcome page of grafana.
Step #4:Create User Group and User for Prometheus
Now lets create User Group and User for Prometheus after the installation of Prometheus and grafana is completed.
sudo groupadd --system prometheus
sudo useradd -s /sbin/nologin --system -g prometheus prometheus
Monitor MongoDB with Prometheus and Grafana
Step #5:Download and install MongoDB exporter
First create a directory for the exporter and navigate to it.
mkdir mongodb-exporter
cd mongodb-exporter
Download the binary file of the exporter from the github repo.
wget https://github.com/percona/mongodb_exporter/releases/download/v0.7.1/mongodb_exporter-0.7.1.linux-amd64.tar.gz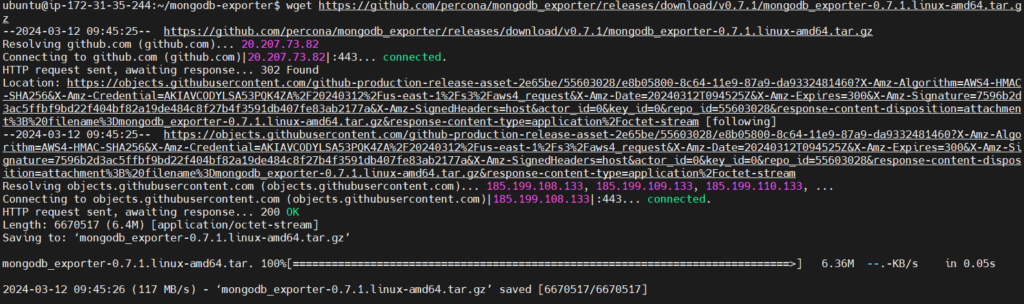
Now in your current folder extract the downloaded archive.
tar xvzf mongodb_exporter-0.7.1.linux-amd64.tar.gz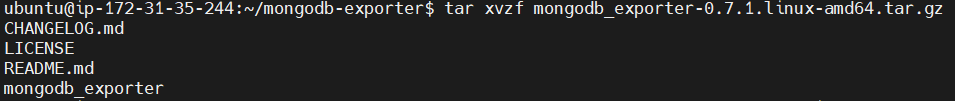
Finally, move the mongodb_exporter binary to usr/local/bin/.
sudo mv mongodb_exporter /usr/local/bin/
Next set up MongoDB authentication for the MongoDB exporter and create a user to monitor the cluster’s metrics. Begin by connecting with mongosh.
mongoshAfter connecting to your MongoDB instance with mongosh, switch to the admin database using the command.
use adminThen, create an administrator account for your exporter with the clusterMonitor role.
db.createUser({user: "test",pwd: "testing",roles: [{ role: "clusterMonitor", db: "admin" },{ role: "read", db: "local" }]})Exit the shell after creating the user.
exit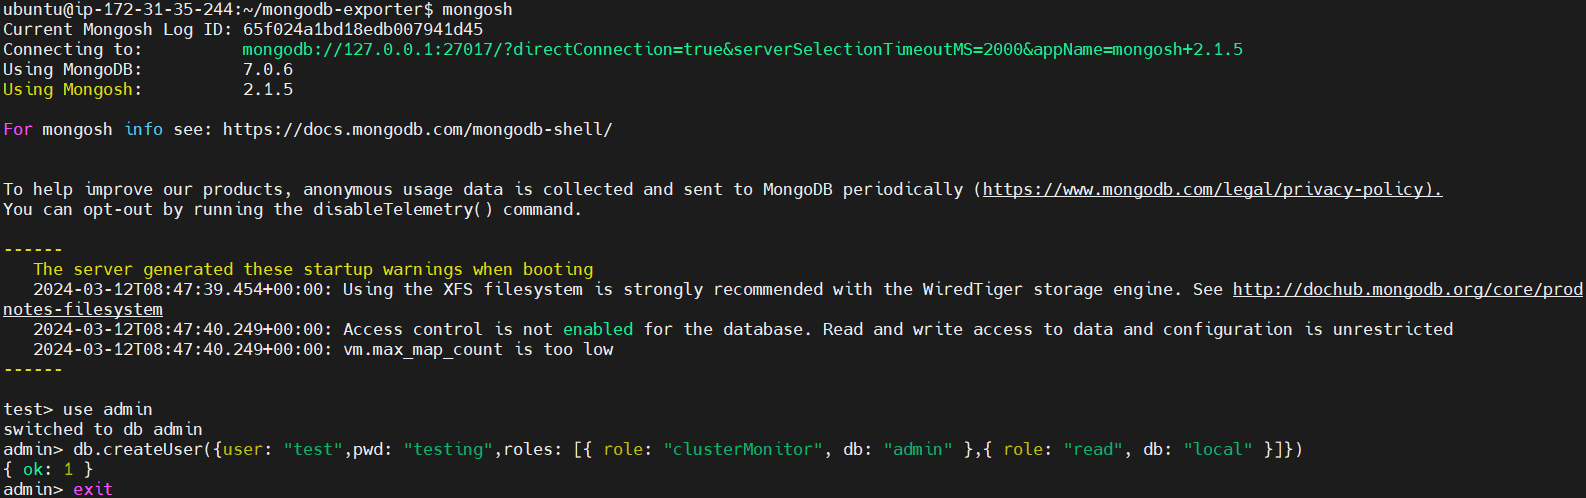
Step #6:Configuring MongoDB Exporter Service.
Next, set your MongoDB URI environment variable with the appropriate authentication credentials.
export MONGODB_URI=mongodb://test:testing@localhost:27017
To check that the environment variable was set correctly, run the following command.
env | grep mongodb
Now lets create a service for exporter. First navigate to the /lib/systemd/system folder.
cd /lib/systemd/system/
create a new service file for the exporter.
sudo nano mongodb_exporter.service
[Unit]
Description=MongoDB Exporter
User=prometheus

[Service]
Type=simple
Restart=always
ExecStart=/usr/local/bin/mongodb_exporter

[Install]
WantedBy=multi-user.target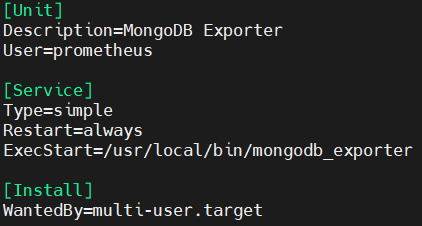
save and close file.
Next, restart your system daemon to reload the unit files, enable the service and finally start the service.
sudo systemctl daemon-reload
sudo systemctl enable mongodb_exporter.service
sudo systemctl start mongodb_exporter.service
lastly check the service is running or not by running the following command.
sudo systemctl status mongodb_exporter.service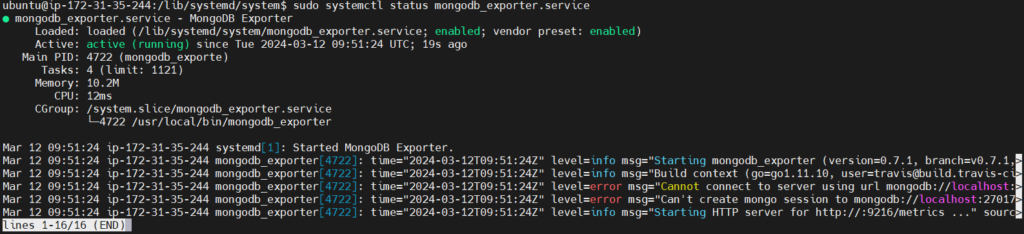
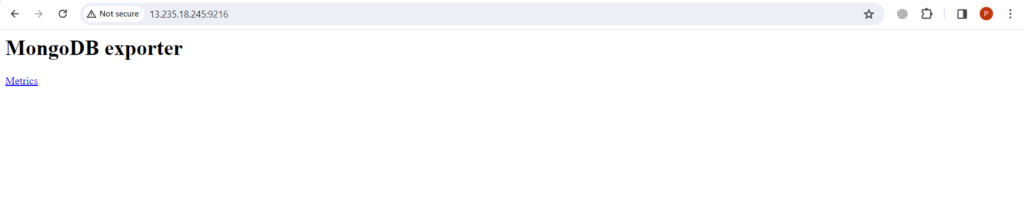
to make sure it is running properly you can run it on your local machine by running your public ip address with the port number 9216 which is default port for exporter.
Step #7:Configuring the MongoDB Exporter as a Prometheus target.
here you will configure the exporter as prometheus target, first go to the directory where prometheus is present
cd prometheus-2.30.0.linux-amd64
open the file for editing.
sudo nano prometheus.yml
add localhost:9216 as shown below.
# my global config
global:
  scrape_interval: 15s # Set the scrape interval to every 15 seconds. Default is every 1 minute.
  evaluation_interval: 15s # Evaluate rules every 15 seconds. The default is every 1 minute.
  # scrape_timeout is set to the global default (10s).

# Alertmanager configuration
alerting:
  alertmanagers:
    - static_configs:
        - targets:
          # - alertmanager:9093

# Load rules once and periodically evaluate them according to the global 'evaluation_interval'.
rule_files:
  # - "first_rules.yml"
  # - "second_rules.yml"

# A scrape configuration containing exactly one endpoint to scrape:
# Here it's Prometheus itself.
scrape_configs:
  # The job name is added as a label `job=<job_name>` to any timeseries scraped from this config.
  - job_name: "prometheus"

    # metrics_path defaults to '/metrics'
    # scheme defaults to 'http'.

    static_configs:
      - targets: ["localhost:9090" , "localhost:9216"]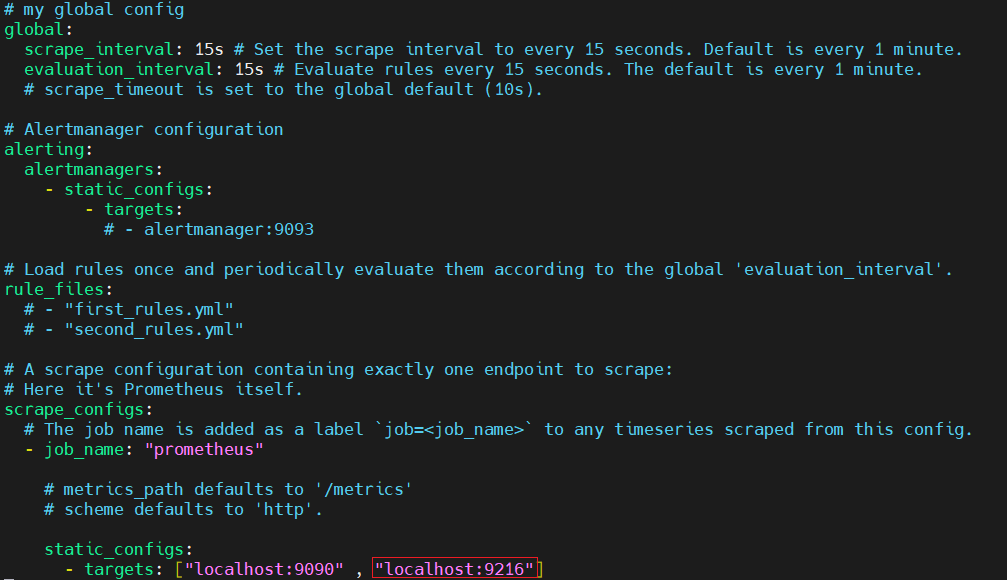
9216 is default port for exporter. Save and close your file.
Restart Prometheus after adding the target.
sudo systemctl restart prometheus
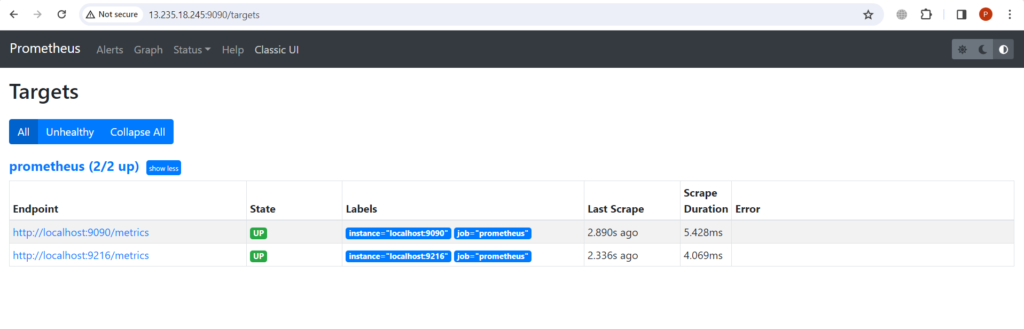
Now go to Prometheus dashboard and click on status, select target, you can see our exporter are up and running.
Step #8:Setting up Grafana Dashboards for MongoDB Metrics
In this step we will create a dashboard for MongoDB exporter in the grafana in order to view and analyze the metrics.
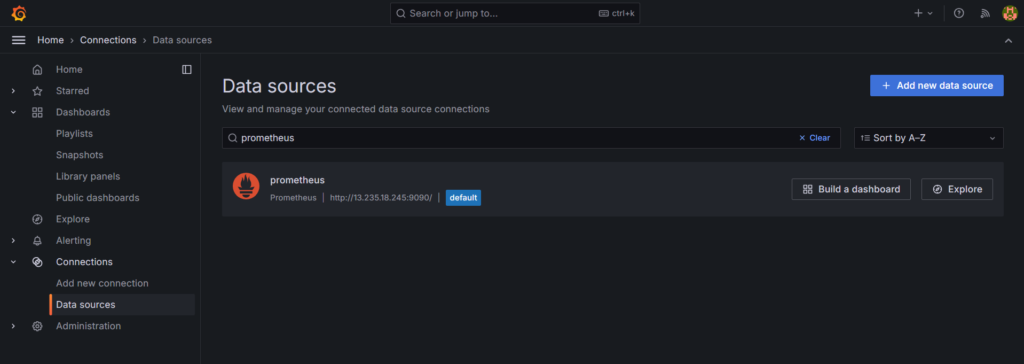
Go to Home at up left corner, go into the Connections, in the Data sources.
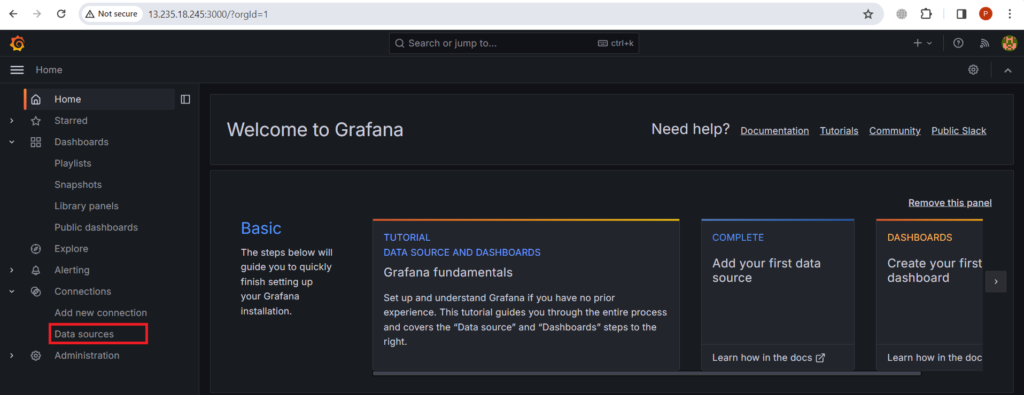
Search for the prometheus and select it.
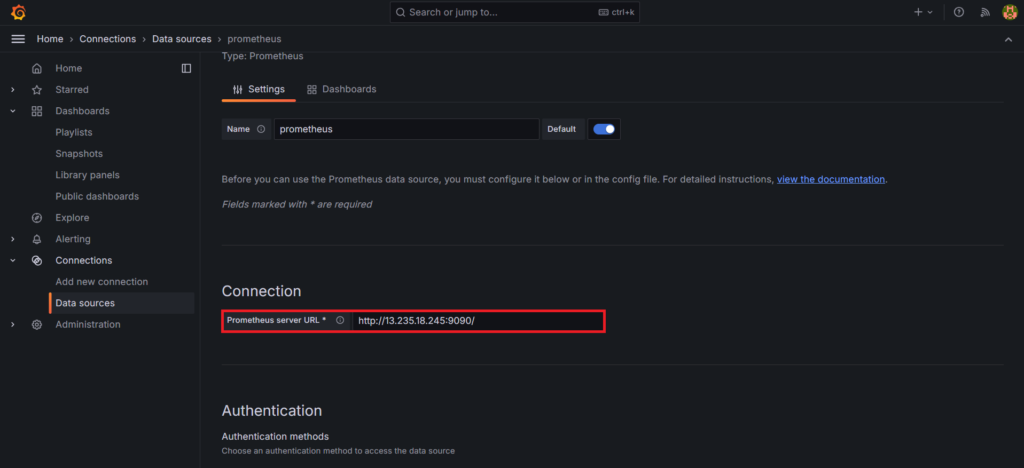
In the connections, give the prometheus server url on which our prometheus server is running.
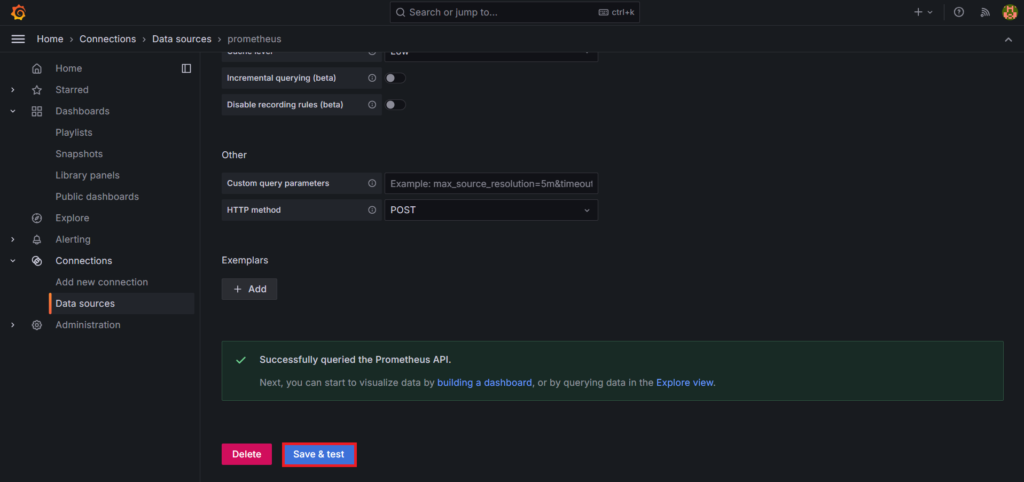
Click on the save and test button you will see the successful message as shown below.
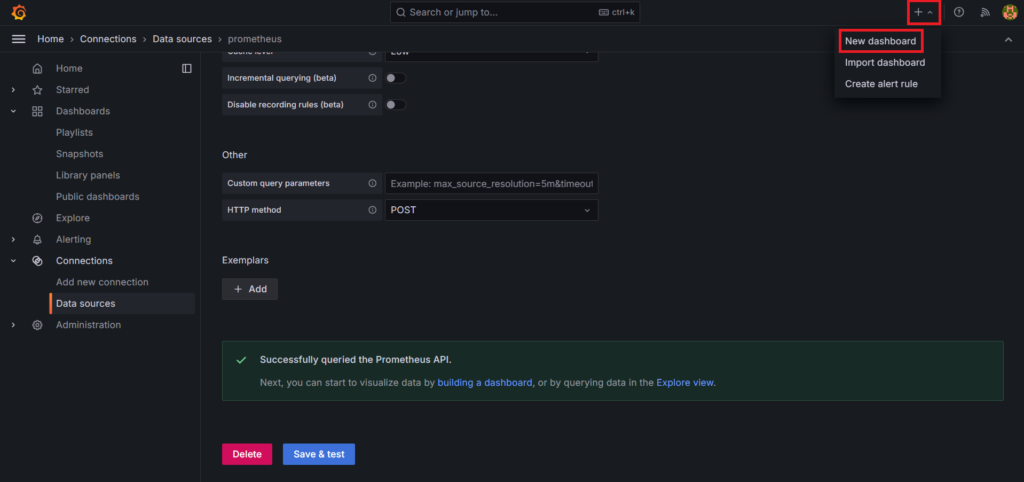
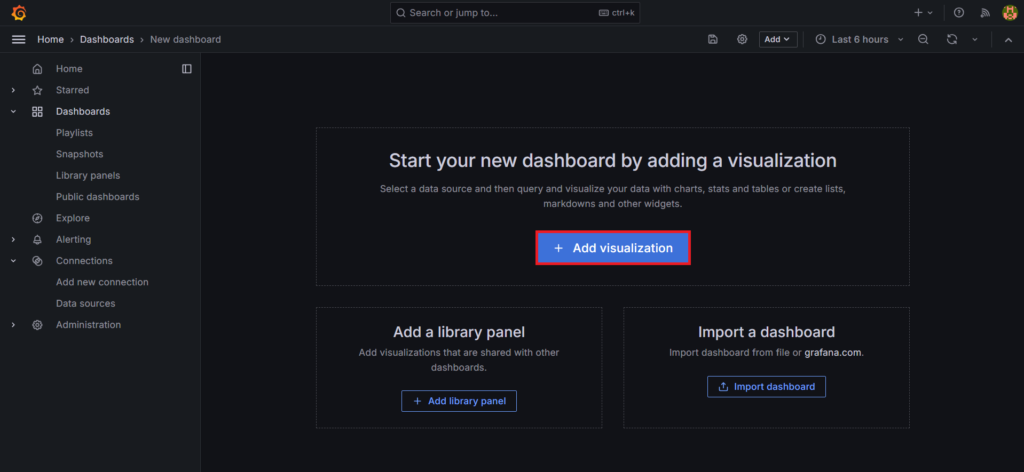
Go to the + icon and select the New dashboard from up right corner.
Here you can start your own new dashboard by adding a visualization.
Click on the Add visualization box.
You can also import dashboards.
Select the prometheus as a data source.
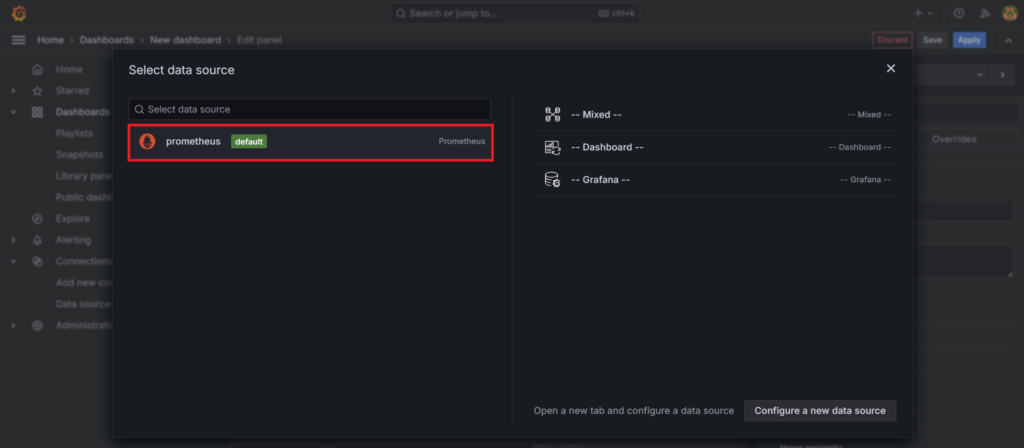
Now you can start running the queries.
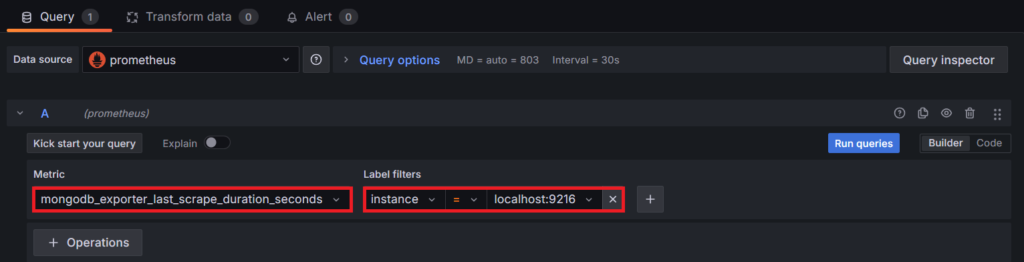
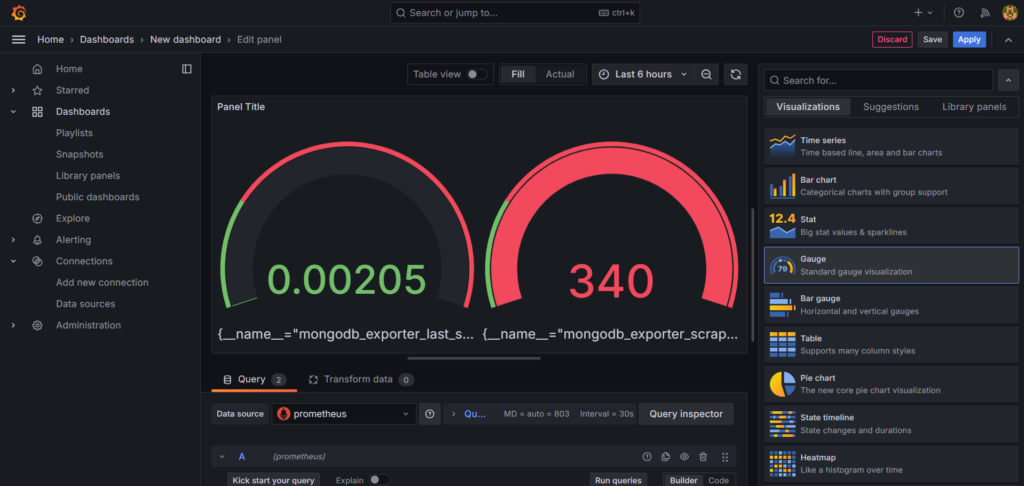
In the query section add the query A
- Metric: mongodb_exporter_last_scrape_duration_seconds
- instance: localhost:9216
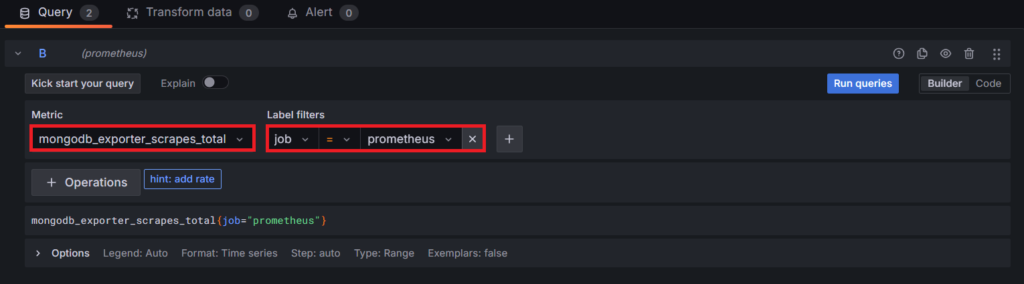
In the query section add the query B
- Metric = mongodb_exporter_scrapes_total
- job = prometheus
Click on run queries.
You will see the following output.
It’s in the Gauge visualization, but there are many visualization option like time series, stats, bar graph etc.
Click ctrl+s to save the file. Give an appropriate Title for your dashboard the save it.
Conclusion:
In conclusion, the integration of Prometheus and Grafana offers a robust solution to monitor MongoDB deployments. Through meticulous configuration, you can leverage these tools to scrutinize vital metrics like connections, operations, and replication status, empowering you to pinpoint performance bottlenecks, troubleshoot issues and monitor MongoDB effectively. Embrace these tools to gain valuable insights and ensure the optimal health and performance of your MongoDB infrastructure.
Related Articles:
How to Monitor MySQL with Prometheus and Grafana
Reference: