This article will cover Monitoring Linux And Log Management in Linux.
Table of Contents
What is Linux System Monitoring?
System monitoring in Linux involves:
- Tracking: Monitoring the state of system components such as CPU, memory, disk, network, and processes.
- Analyzing: Identifying trends, patterns, and anomalies.
- Maintaining Health: Ensuring resources are sufficient and utilized efficiently.
- Proactive Alerts: Detecting and addressing issues before they impact performance.
Why is System Monitoring Important?
- Ensures Stability: Helps maintain uptime and reliability.
- Improves Performance: Detects bottlenecks to optimize resource utilization.
- Enhances Security: Identifies unauthorized access or abnormal behavior.
- Supports Troubleshooting: Provides data to diagnose and resolve issues quickly.
Key Components of System Monitoring:
1. CPU Monitoring
- Purpose: Understand CPU usage and load.
- Metrics to Monitor:
- Utilization: Percentage of CPU in use.
- Load Average: Average number of processes waiting for CPU over time.
- System vs. User Time: Time spent on kernel operations vs. user processes.
- Idle Time: Time when the CPU is not executing tasks.
2. Memory (RAM) Monitoring
- Purpose: Ensure sufficient memory for active applications and processes.
- Metrics to Monitor:
- Used Memory: Amount of memory actively used.
- Free Memory: Memory not in use.
- Buffers/Cache: Temporary memory storage for faster access.
- Swap Usage: Disk space used as virtual memory when RAM is full.
3. Disk Monitoring
- Purpose: Track disk usage and I/O performance.
- Metrics to Monitor:
- Used vs. Available Space: Prevent disk from filling up.
- Read/Write Speeds: Monitor data transfer rates.
- I/O Wait Time: Time processes spend waiting for disk operations.
4. Network Monitoring
- Purpose: Track data flow, connections, and bandwidth usage.
- Metrics to Monitor:
- Bandwidth: Data sent and received over the network.
- Active Connections: Established network connections.
- Packet Errors: Dropped or corrupted packets.
- Latency: Time taken for data to travel between systems.
5. Process Monitoring
- Purpose: Monitor running processes to detect resource hogs or abnormal behavior.
- Metrics to Monitor:
- Process ID (PID): Unique ID for each process.
- CPU/Memory Usage: Resource consumption of processes.
- State: Whether a process is running, sleeping, or zombie.
System Monitoring in Linux
Monitoring Tools
1. Top Command
- Provides real-time view of system processes.
- Displays CPU usage, memory usage, load averages, and more.
Syntax:
top
2. htop
- Enhanced version of
topwith a user-friendly interface. - Allows process management directly from the interface.
Syntax:
htop
3. vmstat
- Reports on system performance including memory, CPU, and I/O.
Syntax:
#vmstat
#vmstat 2 5 # Updates every 2 seconds, shows 5 samples.2:
- Specifies the interval (in seconds) between each update.
- The metrics are refreshed every 2 seconds.
5:
- Specifies the number of updates to display.
- After showing 5 samples (including the initial one), the command will stop.

4. iostat
- Monitors CPU and disk I/O statistics.
Syntax:
iostat 
5. sar
- Collects, reports, and saves system activity.
- Part of the
sysstatpackage.
Syntax:
sar -u 1 3 # CPU usage every second for 3 samples.-u:
- Displays CPU usage statistics.
- Reports the percentage of time the CPU spends in different states (user, system, idle, etc.).
1:
- The interval in seconds between updates.
- In this case, CPU usage is sampled every 1 second.
3:
- The number of updates or samples to display.
- After reporting 3 samples (including the initial one), the command will stop.

6. nmon
- Provides an interactive and comprehensive system performance view.
- Useful for generating performance reports.

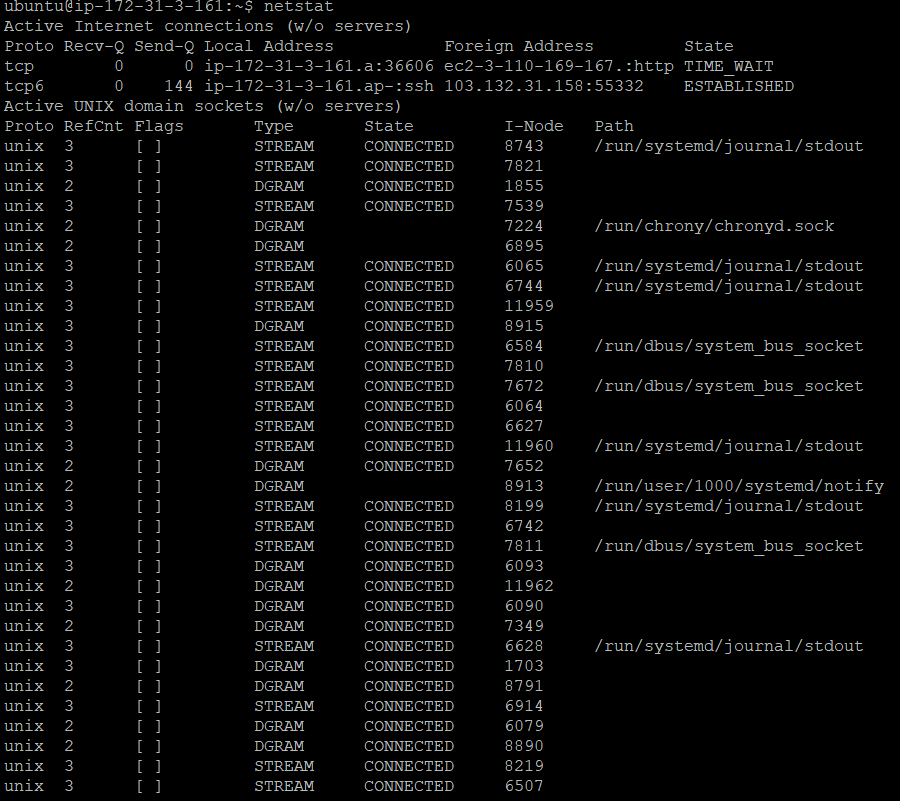
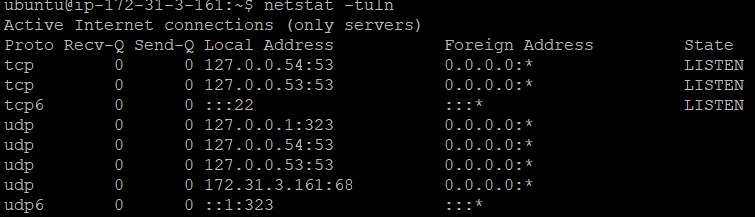
7. netstat
- Monitors network connections and statistics.
Syntax:
#netstat
#netstat -tulnOptions:
-t: Show TCP (Transmission Control Protocol) connections.-u: Show UDP (User Datagram Protocol) connections.-l: Show only listening sockets (services waiting for incoming connections).-n: Show numerical addresses and port numbers instead of resolving them to names (faster).
8. free Command: Check Memory (RAM)
- Shows how much RAM is being used and free.
Syntax:
free -h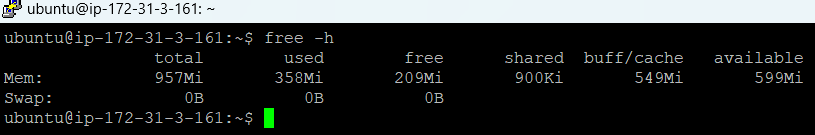
9. df Command: Check Disk Space
- Displays how much space is used and available on your drives.
Syntax:
df -h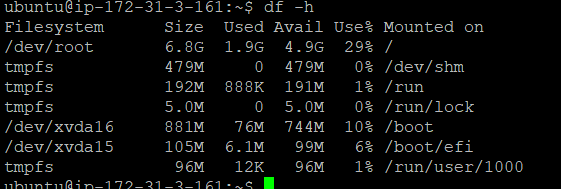
- Size: Total disk size.
- Used: Space used.
- Avail: Space available.
10. ps Command: Check Running Processes
- Shows processes running on your system.
Syntax:
#ps
#ps aux 
- USER: The user running the process.
- PID: Process ID.
- %CPU: CPU usage.
- %MEM: Memory usage.
- COMMAND: The process’s name.
Log Management in Linux:
Log management involves collecting, analyzing, storing, and archiving log files. Logs are essential for debugging, security auditing, and system performance analysis. Logs provide crucial information about system activity, performance, and errors, enabling administrators to troubleshoot issues, enhance security, and optimize performance.
What Are Logs?
- Logs are records of events that occur in the system.
- Created by the operating system, applications, and services.
- Useful for:
- Diagnosing issues.
- Auditing security events.
- Monitoring system behavior.
Log Lifecycle and Management
Stages in Log Management:
- Log Generation:
- Logs are automatically created by system processes and applications.
- Log Collection:
- Tools like
rsyslogcollect and store logs centrally.
- Tools like
- Log Rotation:
- Prevents logs from growing too large.
- Managed using
logrotate.
- Log Archiving:
- Older logs are compressed and stored for future reference.
- Log Analysis:
- Analyzing logs to identify trends, errors, or security breaches.
- Tools:
grep,awk, or advanced tools like ELK Stack.
Types of Logs in Linux:
1. System Logs
- Purpose:
- Capture general system activity, errors, warnings, and status messages.
- Provide insights into the functioning of the operating system and its components.
- Managed By:
- Stored In:
/var/logdirectory.
- Examples:
- Debian/Ubuntu:
/var/log/syslog
Syntax:
tail /var/log/syslog
Syntax:
less /var/log/syslog
Syntax:
cat /var/log/syslog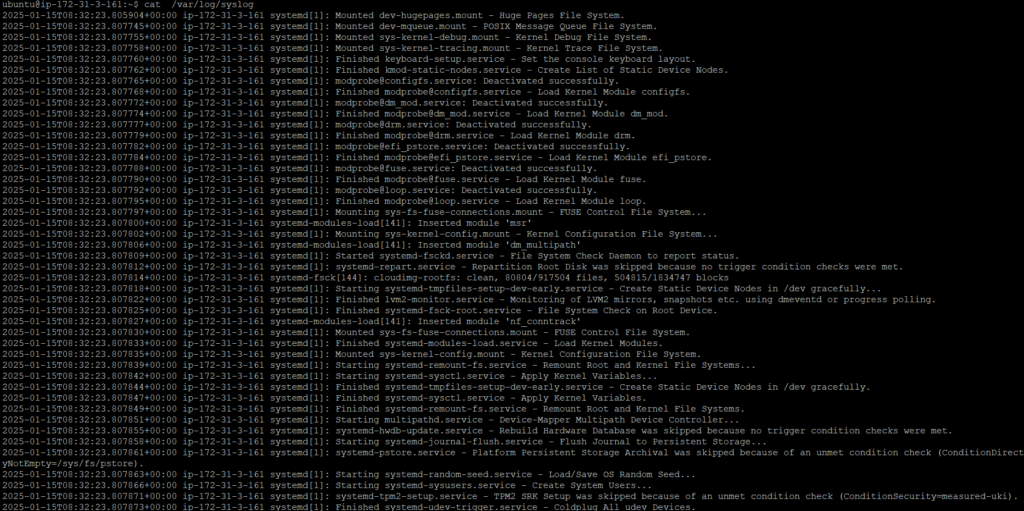
2. Authentication Logs
Purpose:
- Track authentication-related events, such as user logins, failed login attempts, and privilege escalations.
- Essential for auditing security incidents and detecting unauthorized access.
- Examples:
- Debian/Ubuntu:
/var/log/auth.log
Syntax:
tail /var/log/auth.log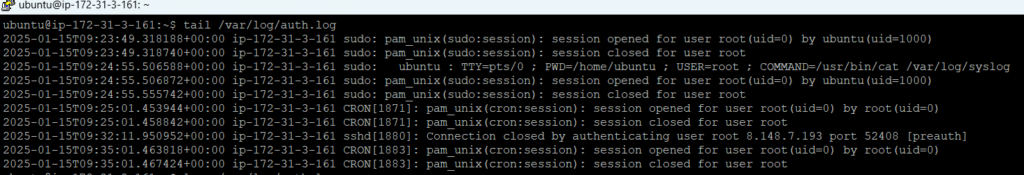
3. Application Logs
- Purpose:
- Logs generated by specific applications for debugging, usage tracking, and error reporting.
- Help troubleshoot issues with individual software or services.
- Examples:
- Web Server Logs:
- Apache:
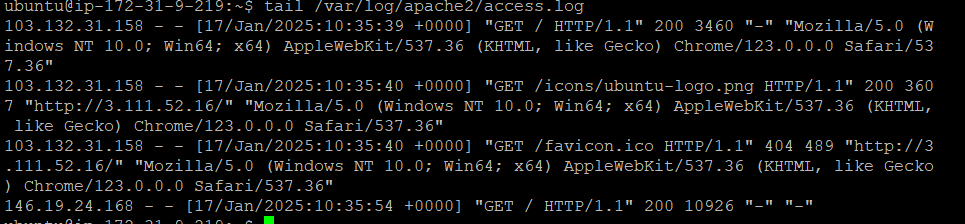
/var/log/apache2/access.log
Access the server’s public IP or domain name from a browser or another device:
Syntax:
http://<EC2-PUBLIC-IP>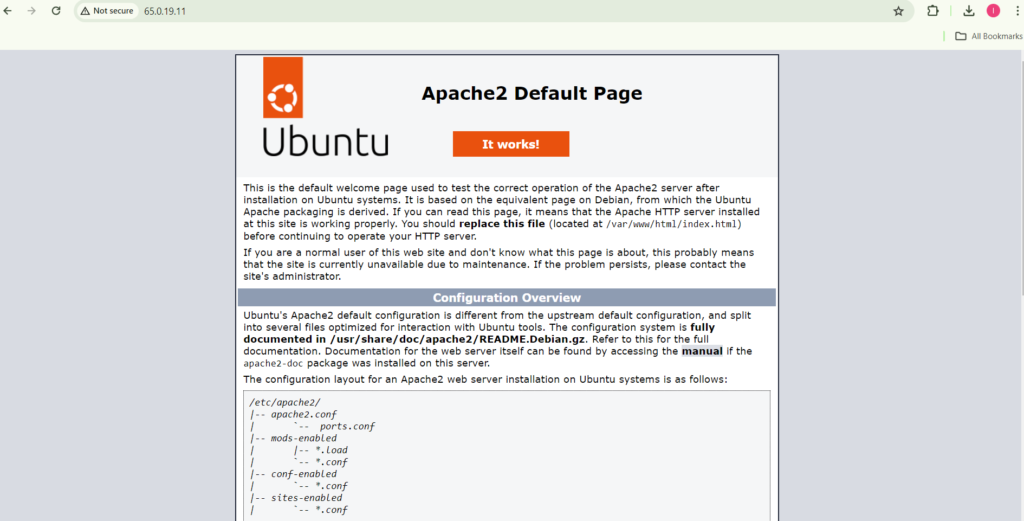
After making these requests, check the access log:
Syntax:
tail /var/log/apache2/access.log
4. Boot Logs
- Purpose:
- Record information about the system boot process, including kernel initialization, services startup, and hardware detection.
- Useful for diagnosing boot-time errors or delays.
- Example:
/var/log/boot.log
On modern Linux systems, the boot logs are stored in the systemd journal. You can view them using the journalctl command.
Syntax:
sudo journalctl -b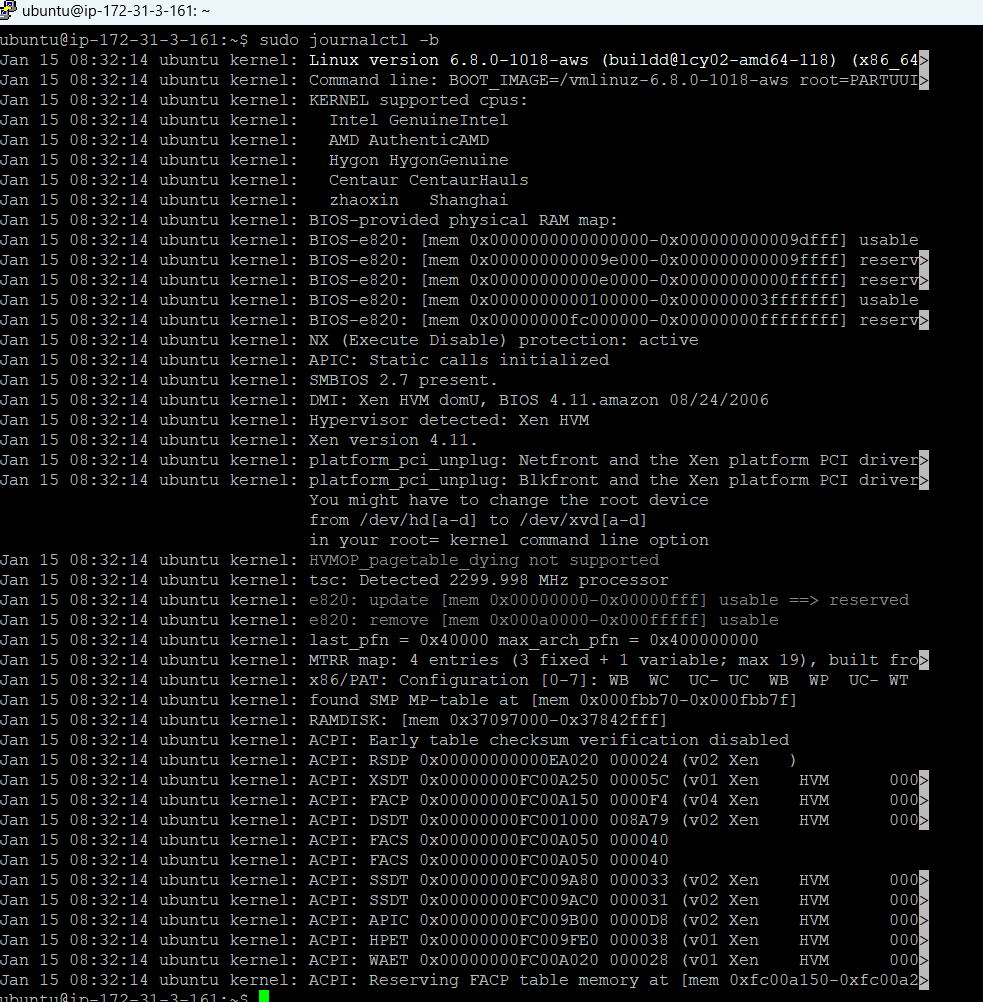
5. Kernel Logs
- Purpose:
- Contain messages generated by the Linux kernel.
- Track hardware-related activities, driver issues, and kernel-level errors.
- Example:
/var/log/kern.log(Debian/Ubuntu)
Syntax:
tail /var/log/kern.log
Troubleshooting for System Monitoring:
System monitoring is like keeping an eye on your car’s dashboard—it helps you spot issues before they become big problems. In Linux, tools like top, htop, and free let you track the CPU, memory, disk, and network usage in real-time.”
Common System Issues and Errors:
- High CPU Usage:
If your system is slow, high CPU usage could be the culprit. You can usetoporhtopto find out which process is consuming the most resources. Once you know the process, you can either optimize it or kill it. - Memory Leaks:
Sometimes, a process may use more and more memory over time without releasing it back. This is called a memory leak. To spot it, usefreeorhtopto monitor your RAM usage. If your system starts swapping heavily, you might have a memory leak issue. - Disk Space Issues:
Running out of disk space can cause a lot of issues, from application crashes to system slowdowns. To check available disk space, use thedfcommand. If you’re running low, you might need to clear up space by deleting unnecessary files or moving them to another drive.
Troubleshooting for Log Management in Linux:
- Network Issues
- If there are network problems (e.g., slow speed, disconnections), check
/var/log/syslog,/var/log/messages, or/var/log/ufw.logfor network-related errors or firewall issues.
- If there are network problems (e.g., slow speed, disconnections), check
- Security Breaches
- For security-related issues such as unauthorized access or failed login attempts, check
/var/log/auth.logand usegrepto filter for failed login attempts grep "Failed password" /var/log/auth.log
- For security-related issues such as unauthorized access or failed login attempts, check
- High CPU Usage
- If you’re experiencing high CPU usage, check logs for any error messages or resource-intensive processes. In
/var/log/syslogorjournalctl, you may find a process that’s consuming excessive CPU resources.
- If you’re experiencing high CPU usage, check logs for any error messages or resource-intensive processes. In
Interview Questions And Answers:
1. What is system monitoring in Linux? Why is it important?
- Answer:
System monitoring involves tracking and analyzing the performance and health of a Linux system, including CPU, memory, disk, network usage, and processes. It ensures stability, identifies bottlenecks, supports troubleshooting, and enhances security by detecting unauthorized access or abnormal behavior.
2. What are some common commands for monitoring Linux systems?
- Answer:
top/htop: Monitor real-time CPU, memory, and process usage.vmstat: View CPU, memory, and I/O statistics.free: Check memory usage.iostat: Monitor disk I/O performance.df: View disk space usage.netstat/ss: Monitor network connections.ps: List running processes.uptime: Show system uptime and load average.
3. Where are log files stored in Linux?
- Answer:
Log files are typically stored in the/var/log/directory. Examples include:/var/log/syslog: General system logs./var/log/auth.log: Authentication logs./var/log/dmesg: Kernel messages./var/log/messages: General messages (on some distributions)./var/log/apache2/or/var/log/nginx/: Web server logs.
4. How do you view the contents of a log file?
- Answer:
- Use
cat,less, ormoreto view logs: cat /var/log/syslogless /var/log/auth.log- Use
tailto view the last few lines: tail -f /var/log/syslog
- Use
5. What is the difference between /var/log/messages and /var/log/syslog?
- Answer:
/var/log/messages: Contains general system activity logs (used in older distributions or CentOS)./var/log/syslog: Contains all system messages, including kernel, daemon, and authentication logs (used in Debian-based systems like Ubuntu).
6. What is journalctl, and how is it used?
- Answer:
journalctlis a tool to view and query logs from the systemd journal. Examples:- View all logs:bashCopyEdit
journalctl
- View all logs:bashCopyEdit
7.How do you troubleshoot high CPU usage using system monitoring tools?
- Answer:
- Use
toporhtopto identify processes consuming high CPU. - Use
psto get detailed information about the process:ps -p <PID> -o %cpu,%mem,cmd- Analyze system logs (
/var/log/syslog) for related errors. - Check load average using
uptimeorvmstat.
- Use
8. What is the difference between df and du commands?
- Answer:
df: Displays disk space usage by file system.df -hdu: Shows the disk space used by files and directories.du -sh /path/to/directory
9. What is the difference between top and htop?
- Answer:
top: A basic command-line tool for monitoring processes, CPU, and memory usage in real-time.htop: A more advanced and user-friendly version oftopwith a colorful interface, mouse support, and features like process searching and filtering.
10. How do you monitor memory usage in Linux?
- Answer:
free: Displays memory usage summary.free -h
Conclusion:
we have covered Monitoring Linux And Log Management in Linux.
Related Articles: