In this article, we will cover Performance Tuning for Linux servers with Examples.
What is performance tuning ?
Performance tuning is the process of making your computer or server work more efficiently. It involves adjusting different settings—like how the CPU, memory, disk, and network are used—to make sure everything runs smoothly and quickly. The goal is to avoid slowdowns, reduce delays, and use resources in the best way possible
Explain why performance tuning is essential for Linux servers?
Performance tuning is essential for Linux servers because it directly impacts the efficiency, reliability, and scalability of the systems they support. Performance tuning is not just a technical necessity but a strategic priority for any organization relying on Linux servers.
Table of Contents
Key Areas Covered in Linux Server Performance Tuning
1. System Monitoring
Definition: System monitoring tools help you keep track of resource usage like CPU, memory, disk, and network, enabling proactive performance tuning.
How it works: These tools periodically collect and display real-time statistics about system resource usage.
Syntax Examples:
- top: A dynamic, real-time view of system resource usage (CPU, memory, processes).
top
2. htop: A user-friendly interactive process viewer.
htop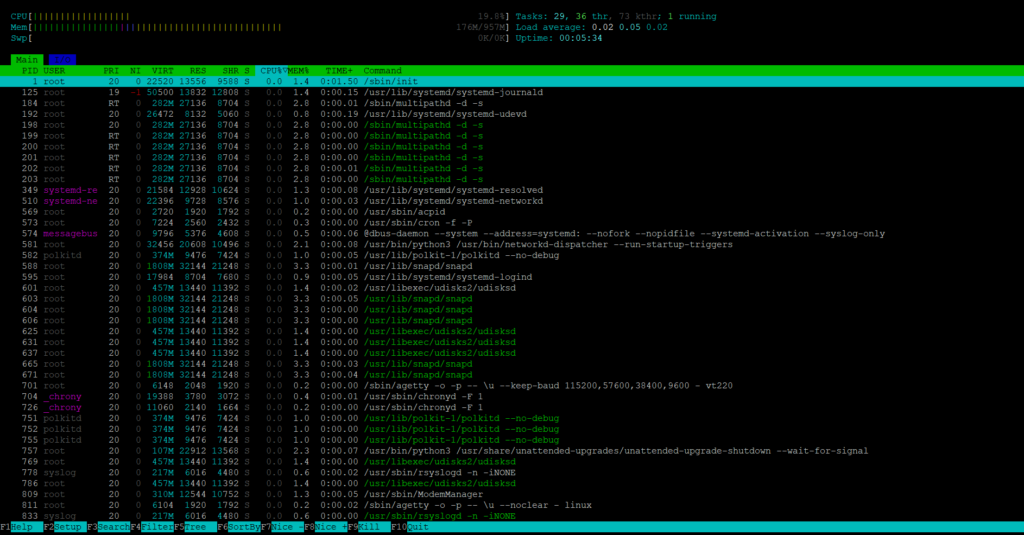
3. vmstat: Reports system activity, CPU, memory, and I/O statistics.
vmstat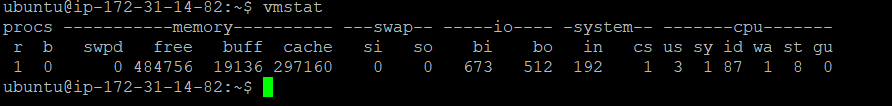
4. iostat: CPU and I/O statistics.iostat
iostat
5. sar: Collects, reports, and saves system activity information.
Sar
2. CPU Performance
Definition: CPU performance tuning focuses on optimizing CPU usage to handle workload efficiently.
How it works: You can configure CPU frequency scaling, assign CPU affinity, and balance workload using CPU-specific features.
Syntax Examples:
- lscpu: Displays detailed CPU architecture and configuration.
lscpu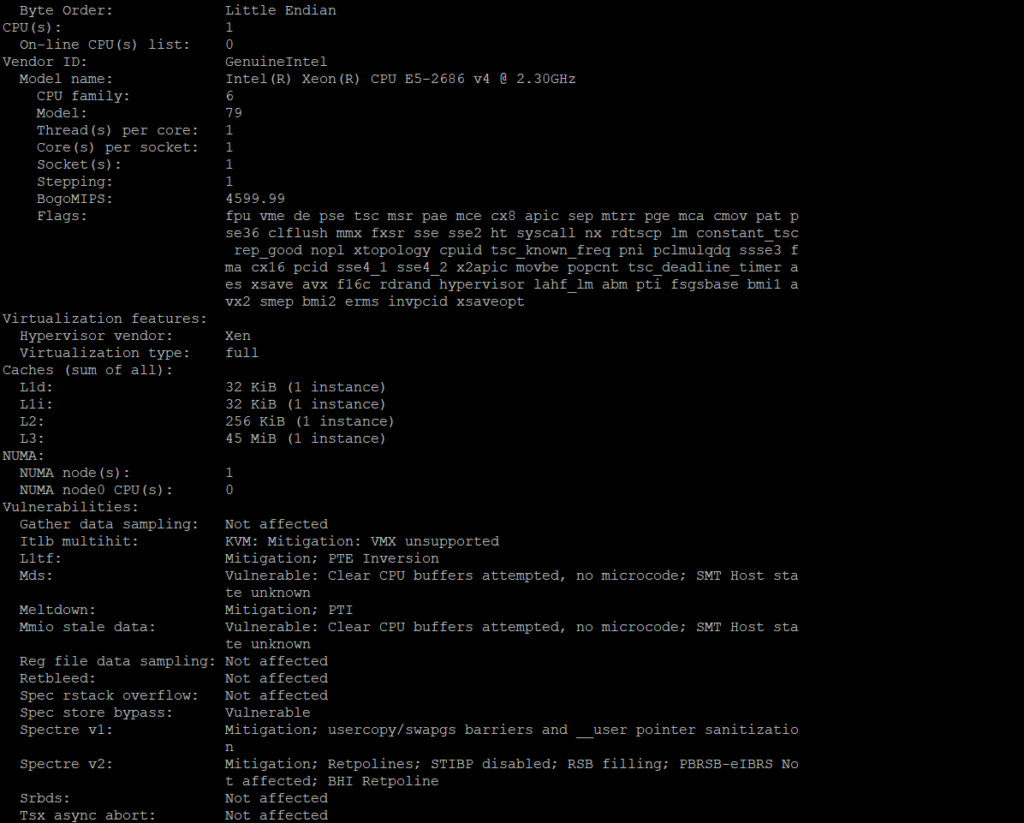
2. cat /proc/cpuinfo: Provides information about CPU configuration.
cat /proc/cpuinfo
3. Memory Tuning
Definition: Memory tuning ensures efficient use of RAM and swap space to avoid bottlenecks.
How it works: Tuning involves adjusting kernel memory management parameters to optimize how memory is allocated and used.
Syntax Examples:
- free: Displays total and used memory in the system.
free
2. vmstat: Reports system activity including memory stats.
vmstat
3. sysctl: Modify kernel parameters at runtime.
sysctl vm.swappiness
4. cat /proc/meminfo: Displays detailed memory usage information.
cat /proc/meminfo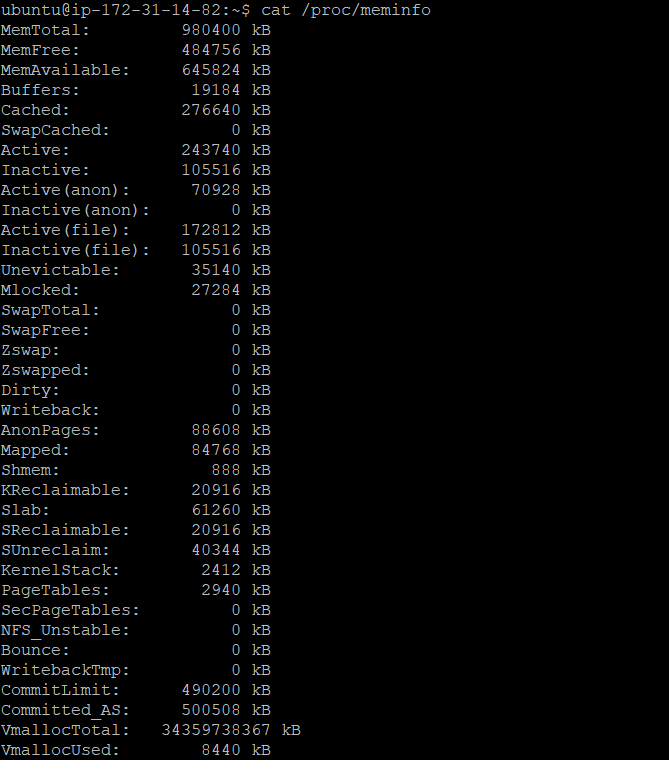
4. Disk I/O Optimization
Definition: Disk I/O optimization involves reducing wait times and improving data transfer efficiency to disks.
How it works: It configures disk I/O scheduler and other parameters to ensure optimal performance in read/write operations.
Syntax Examples:
- iostat: Reports CPU and I/O statistics.
iostat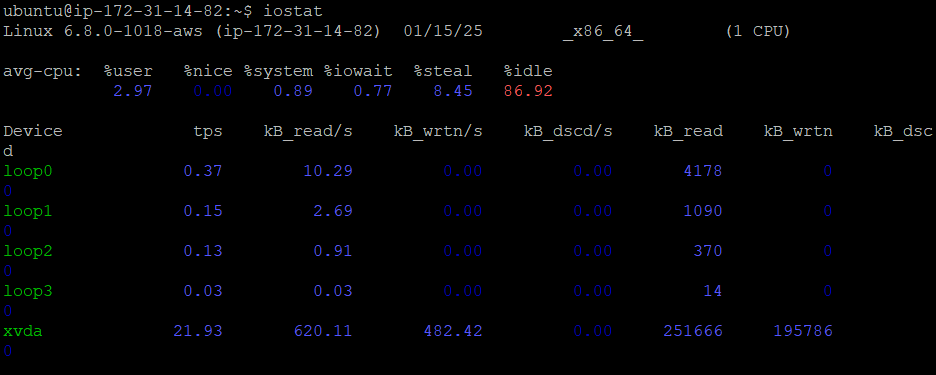
2. df: Displays disk space usage.
df -h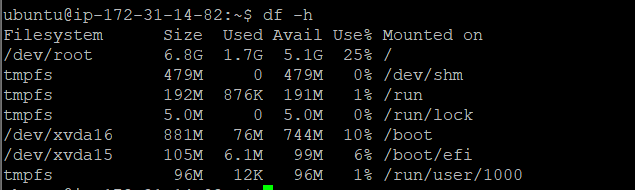
3. mount: Displays information about file systems.
mount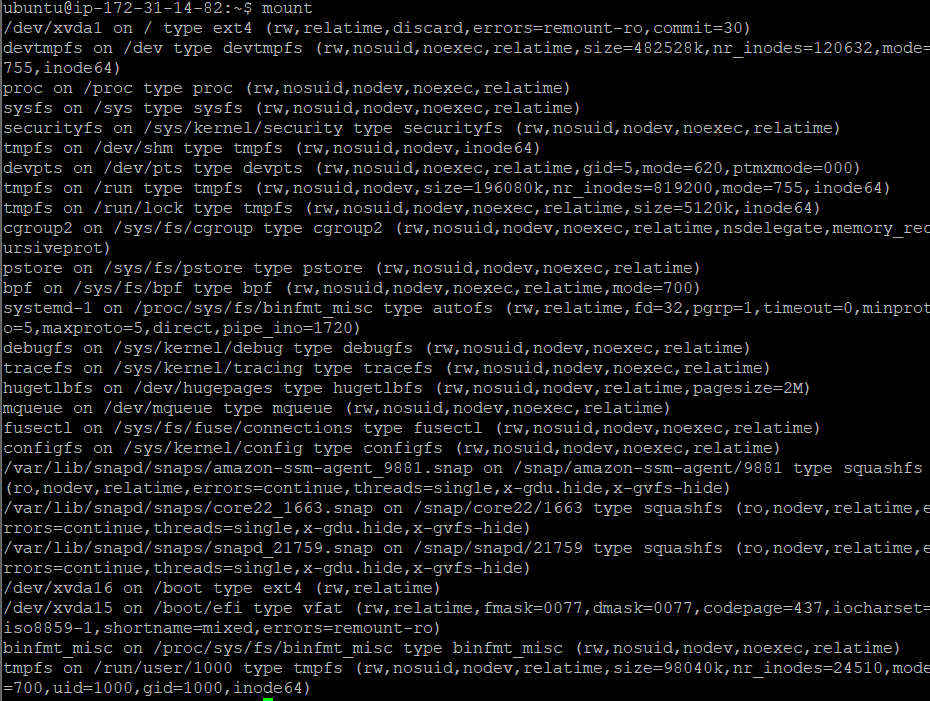
4. cat /proc/partitions: Lists partitions on the system.
cat /proc/partitions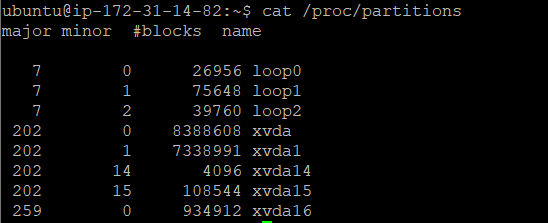
5. Network Performance
Definition: Network performance tuning ensures that network throughput, latency, and efficiency are optimized for the workload.
How it works: Tuning involves adjusting TCP/IP stack parameters and monitoring network traffic.
Syntax Examples:
- ifconfig: Displays network interfaces.
ifconfig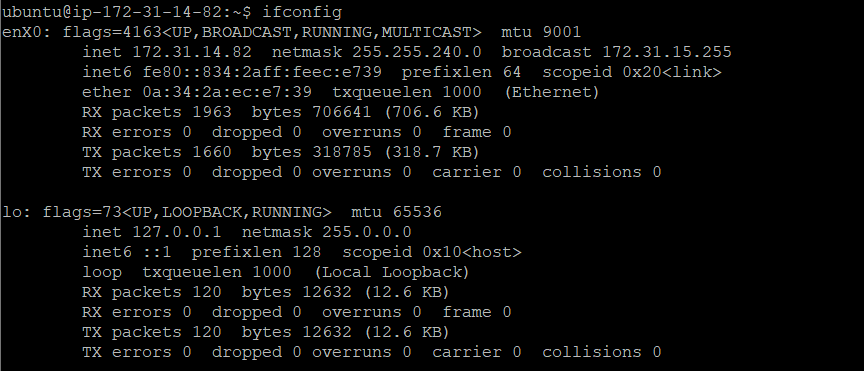
2. netstat: Shows network connections, routing tables, etc.
netstat -i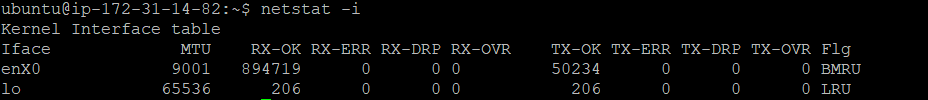
3. iperf: Measures network bandwidth.
iperf3 -c <Service - name>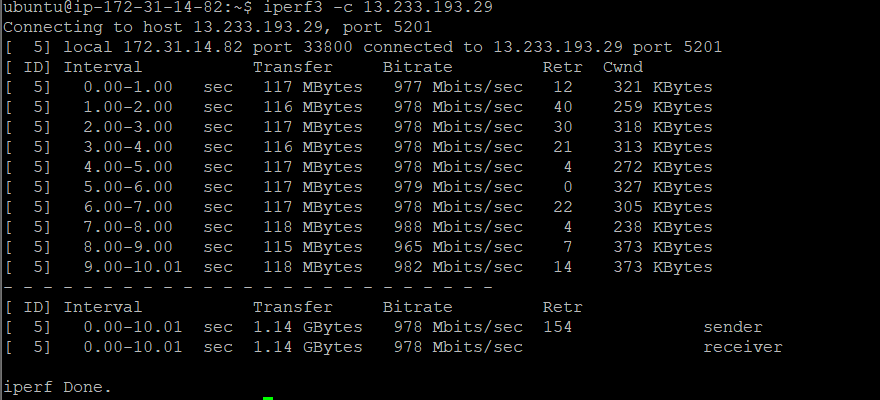
4. tc: Traffic control, used for shaping network traffic.
tc qdisc show
6. Load Balancing
Definition: Load balancing is distributing incoming network traffic across multiple servers to ensure no single server is overwhelmed.
How it works: Load balancers forward client requests to backend servers based on load and availability.
Syntax Examples:
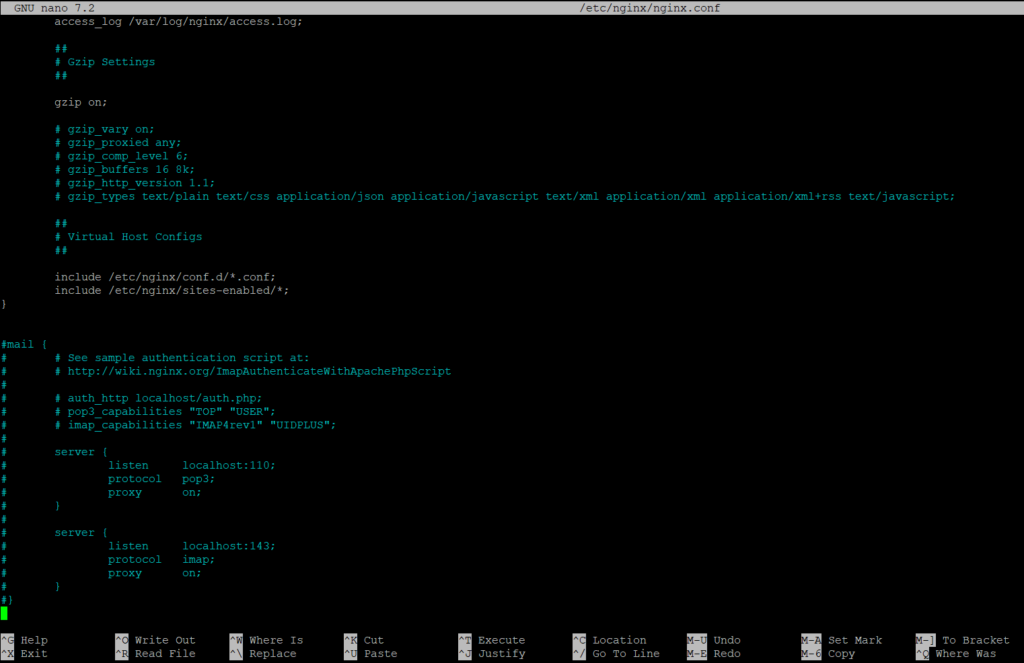
- nginx: Configurations to set up load balancing.
sudo nano /etc/nginx/nginx.conf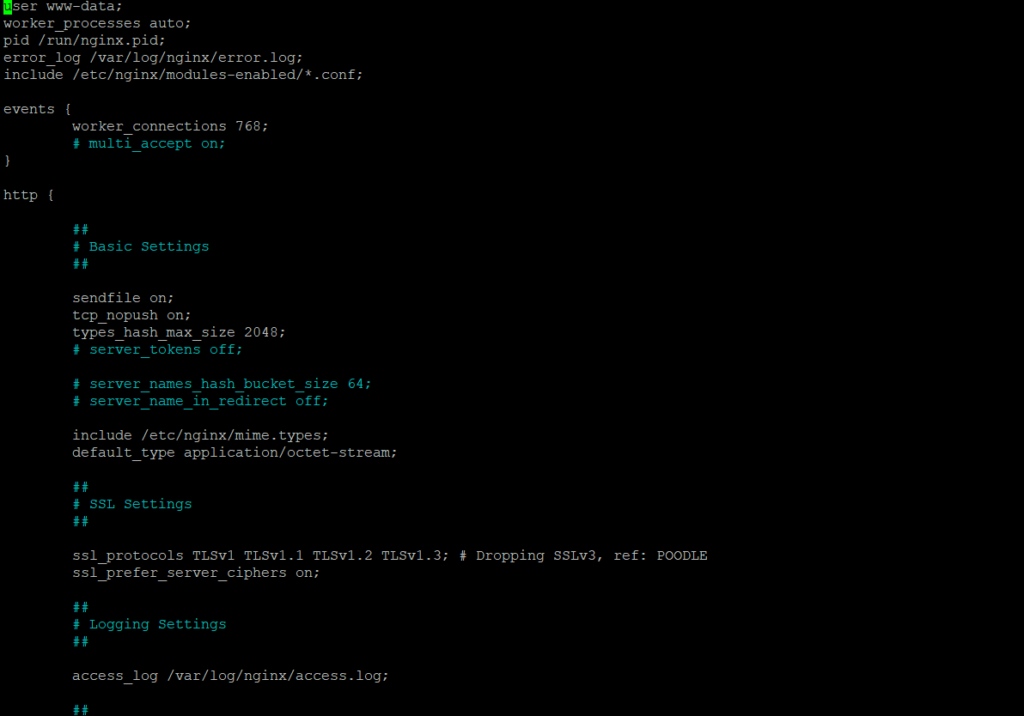
2. haproxy: High availability proxy for load balancing.
sudo nano /etc/haproxy/haproxy.cfg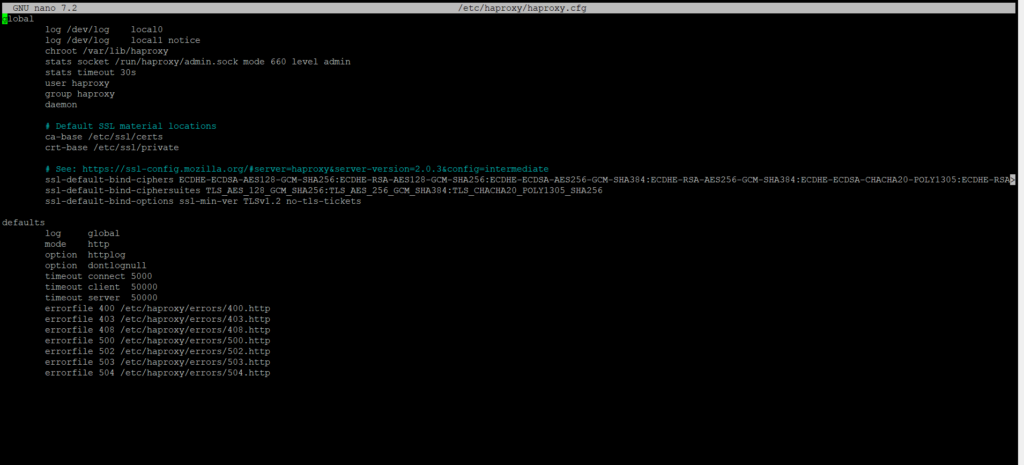
7. Kernel Tuning
Definition: Kernel tuning involves adjusting parameters to improve the performance and efficiency of the Linux kernel.
How it works: Kernel parameters control various low-level behaviors like networking, memory management, and disk I/O.
Syntax Examples:
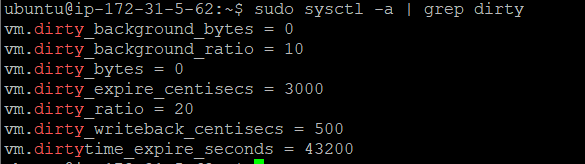
1.sysctl: Display or set kernel parameters.
sudo sysctl -a | grep dirty
2. cat /proc/sys/net/: View network kernel parameters. To view the value of the ip_forward parameter in the ipv4 subdirectory:
cat /proc/sys/net/ipv4/ip_forward
8. Application Tuning
Definition: Application tuning improves the efficiency and performance of specific applications running on Linux.
How it works: By modifying application configurations, query optimizations, or connection settings.
Syntax Examples:
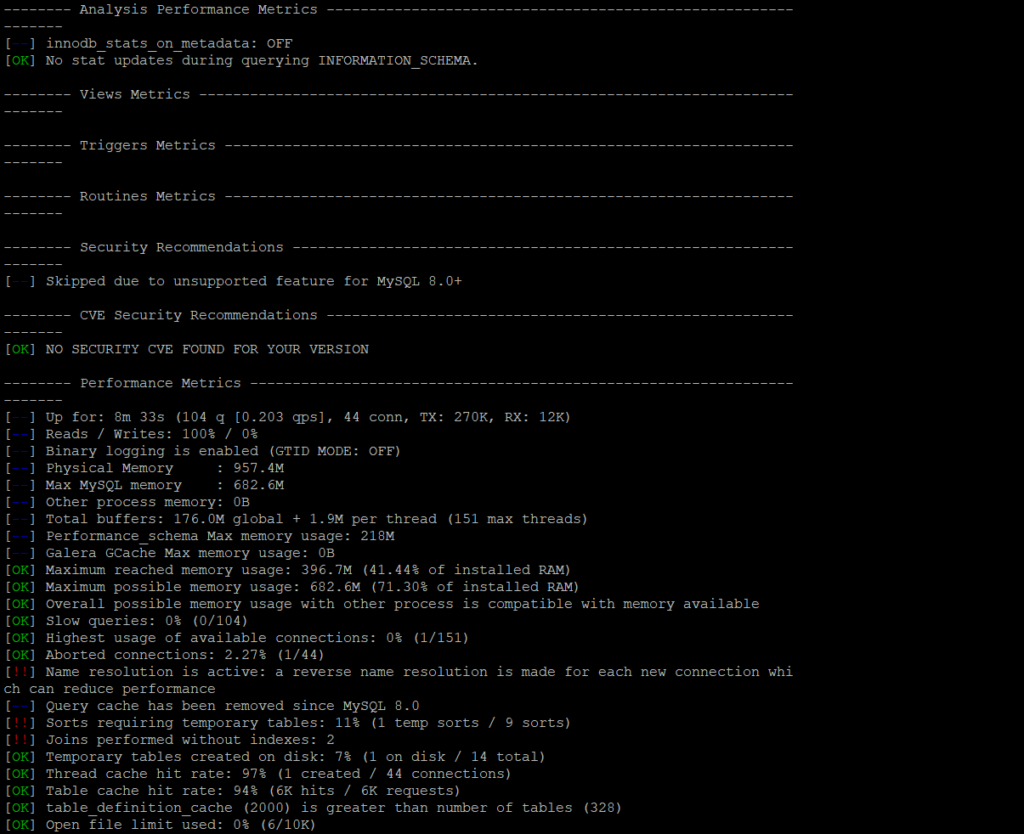
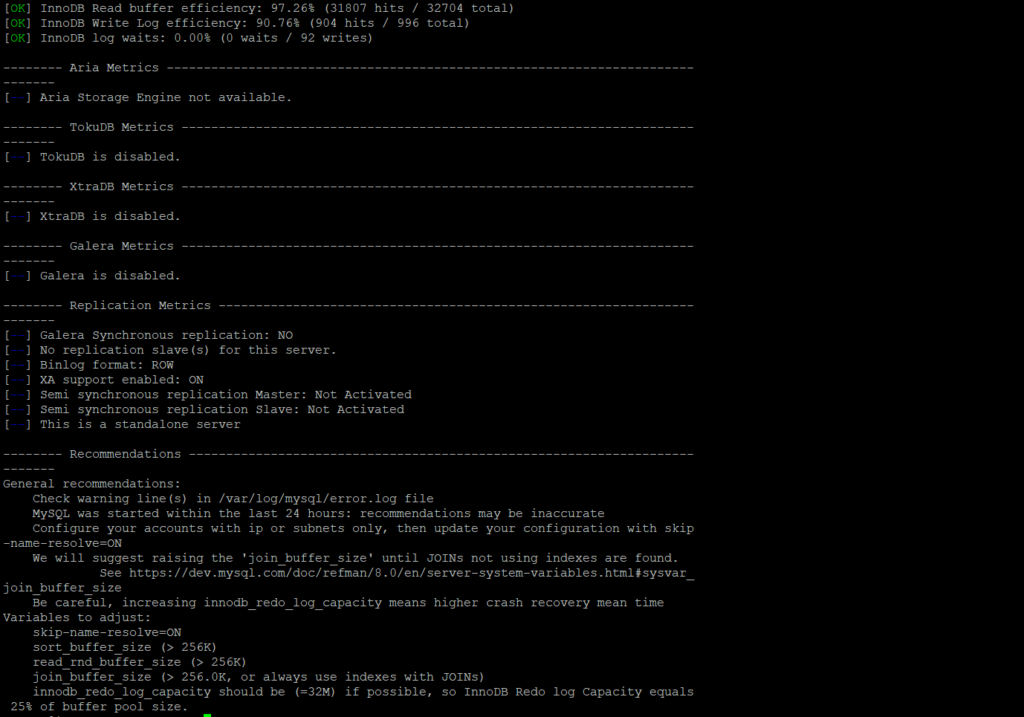
- mysqltuner: Checks MySQL configurations and performance.
sudo mysqltuner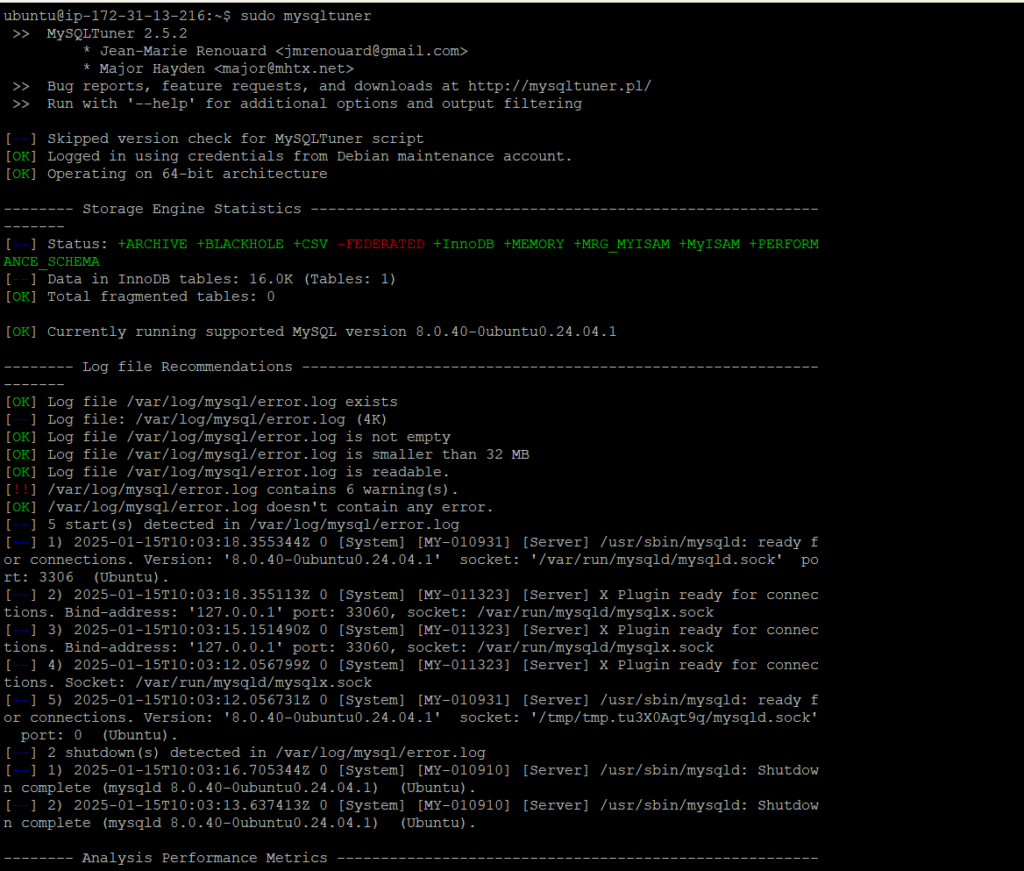
9. Persistent Performance Monitoring
Definition: Tools for continuous and long-term monitoring to detect performance issues early.
How it works: Collects performance data over time and alerts based on predefined thresholds.
Syntax Examples:
- munin: Networked resource monitoring tool.
sudo apt install munin
2. collectd: Collects data from system resources for later analysis.
sudo systemctl enable collectd
10. Backup & Recovery
Definition: Ensuring data integrity and system recovery in case of failures.
How it works: Backups can be full, incremental, or differential, and recovery involves restoring data from backups.
Syntax Examples:
- rsync: Backup and synchronize files.
sudo rsync -av /backup/config/ /etc/

11. Security Optimization
Definition: Security tuning hardens the Linux server by configuring firewalls, disabling unnecessary services, and setting up secure access.
How it works: Configuring firewalld and iptables ensures that unauthorized access is blocked.
Syntax Examples:
- firewalld: Manages firewall rules.
sudo firewall-cmd --list-all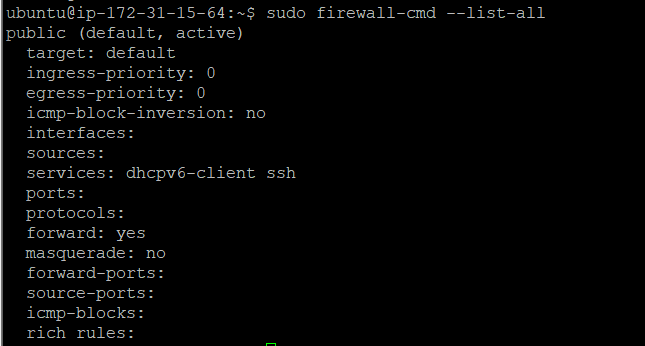
2. iptables: Network filtering and packet manipulation.
sudo iptables -L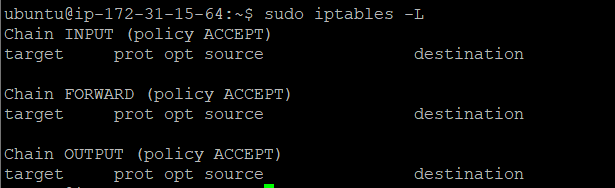
Interview Questions and Answers on performance tuning for Linux Servers
1. How can you optimize disk performance?
- Use faster disks (e.g., SSDs).
- Implement RAID for redundancy or performance.
- Tune file systems (e.g.,
ext4,xfs). - Check disk usage with
df -handdu.
2. How do you manage high-memory-consuming processes?
- Identify them with
toporps. - Restart, limit resources, or optimize the application.
3. How can you improve server performance?
- Use caching (e.g.,
memcached,Redis). - Optimize kernel parameters (via
/etc/sysctl.conf). - Balance load using
nginx,HAProxy, etc. - Upgrade hardware if needed.
4. How do you identify processes consuming the most resources?
Use top, htop, or ps aux --sort=-%mem to list processes sorted by CPU or memory usage.
5. What tools can you use to monitor system performance in real-time?
- CPU and memory:
top,htop,vmstat. - Disk I/O:
iotop,iostat. - Network:
iftop,nload,vnstat. - Comprehensive monitoring:
nmon,glances.
6. How do you tune the kernel for better performance?
Modify kernel parameters using sysctl:
- Increase file descriptors:
fs.file-max. - Tune TCP settings:
net.core.somaxconn,net.ipv4.tcp_tw_reuse. - Reduce swapping:
vm.swappiness.
Apply changes in /etc/sysctl.conf and reload with sysctl -p.
7. How do you handle a server running out of memory?
- Identify memory-intensive processes with
toporfree. - Add swap space using
mkswapandswapon. - Restart or optimize processes.
- Consider adding more physical RAM.
8. How do you analyze application performance issues?
- Check application logs in
/var/log. - Use
straceorlsofto trace system calls and open files. - Use APM tools like New Relic or Prometheus for detailed monitoring.
9. How can you limit resource usage for specific processes?
Use cgroups or systemd to set limits on CPU, memory, and disk I/O.
Example: cpulimit to cap CPU usage.
10. How do you find and resolve disk space issues?
- Check usage:
df -h. - Identify large files:
du -sh /path/*. - Clean logs: Remove or rotate logs with
logrotate. - Remove unnecessary files or use tools like
ncdu.
11. How do you identify and resolve network bottlenecks?
- Analyze network traffic with
iftop,nload, ortcpdump. - Check open connections with
netstatorss. - Optimize MTU, TCP window sizes, and enable jumbo frames if supported.
12. How can you ensure consistent performance under heavy load?
- Use load balancers like
HAProxyornginx. - Implement caching (e.g.,
Varnish,Redis). - Optimize database queries and indexes.
- Scale horizontally by adding more servers.
13. How do you troubleshoot high disk I/O?
- Use
iotoporiostatto identify high I/O processes. - Check for fragmented filesystems.
- Optimize database writes and indexes.
- Use SSDs for faster read/write speeds.
14. What is swap, and how can you optimize its usage?
Swap is disk space used as virtual memory when RAM is full.
- Check swap usage with
free -m. - Reduce
vm.swappinessto prioritize RAM usage. - Add swap space with
mkswapandswapon.
15. How do you measure server startup time?
Use systemd-analyze to check boot time and systemd-analyze blame to identify slow services.
Conclusion:
In this article we have covered Performance Tuning for Linux servers with Examples.
Related Articles: