In this article, we will cover How to calculate .NET API availability monitoring using OpenTelemetry, Prometheus, and Grafana.
In today’s cloud-native world, ensuring the availability and reliability of APIs is essential. Observability tools like OpenTelemetry, Prometheus, and Grafana offer powerful solutions to monitor performance, track errors, and visualize trends.
This guide walks you through deploying a .NET Core API to an AWS EC2 instance and integrating it with OpenTelemetry for metrics, Prometheus for collection, and Grafana for visualization. By the end, you’ll have a real-time dashboard tracking API availability, response codes, and usage patterns.
Table of Contents
Prerequisites
- AWS Account with Ubuntu 24.04 LTS EC2 Instance.
- Basic Knowledge of ASP.Net, Prometheus, Grafana.
Step #1:Install .NET SDK on Ubuntu
Update and upgrade the package list to ensure you’re installing the latest version.
sudo apt update && sudo apt upgrade -y
We’ll install the .NET 9 SDK using Microsoft’s official script. Download the .NET installation script
wget https://dot.net/v1/dotnet-install.sh -O dotnet-install.sh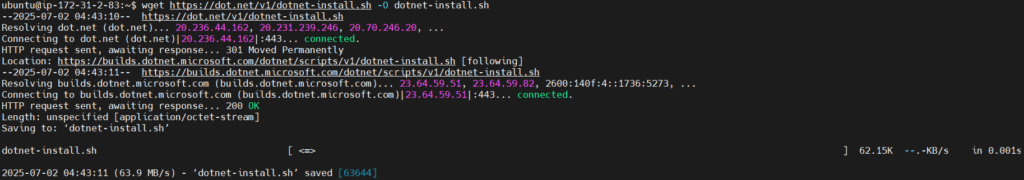
Make the script executable.
chmod +x dotnet-install.sh
Install .NET 9 SDK. This will install the SDK to your user’s home directory.
./dotnet-install.sh --channel 9.0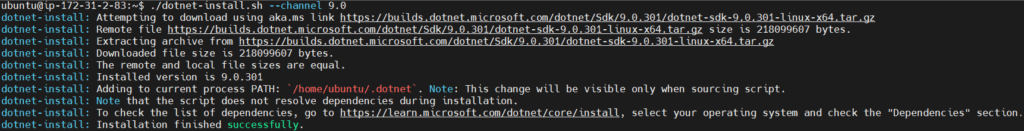
Make dotnet command available globally, add it to your shell’s PATH.
echo 'export PATH=$PATH:$HOME/.dotnet' >> ~/.bashrc
source ~/.bashrc
Verify installation.
dotnet --version
Step #2:Create and Configure .NET Core API
Create a new minimal web API project.
dotnet new web -o TodoApi
Navigate to it.
cd TodoApi
Add necessary NuGet packages for API, telemetry, and documentation.
dotnet add package Microsoft.EntityFrameworkCore.InMemory
dotnet add package Microsoft.AspNetCore.Diagnostics.EntityFrameworkCore
dotnet add package NSwag.AspNetCore
dotnet add package OpenTelemetry.Exporter.Prometheus.AspNetCore --prerelease
dotnet add package OpenTelemetry.Extensions.Hosting --prerelease
dotnet add package OpenTelemetry.Instrumentation.AspNetCore --prerelease
dotnet add package OpenTelemetry.Instrumentation.Runtime --prerelease
dotnet add package OpenTelemetry.Exporter.Console --prerelease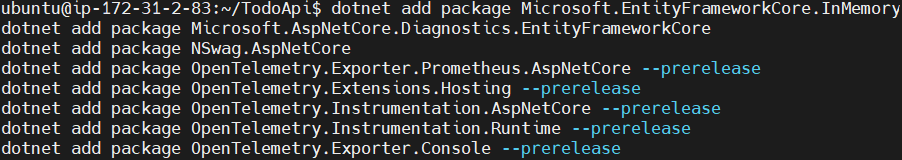
Create the model, database context, and DTO files.
nano Todo.cs
Paste the following content into the file.
namespace TodoApi
{
    public class Todo
    {
        public int Id { get; set; }
        public string? Name { get; set; }
        public bool IsComplete { get; set; }
        public string? Secret { get; set; }
    }
}
Explanation of the code:
This code defines a Todo model class in the TodoApi namespace. It’s used to represent a to-do item with the following properties:
Id: An integer that uniquely identifies the to-do item (primary key).Name: A nullable string that holds the task name or description.IsComplete: A boolean that indicates whether the task is completed.Secret: A nullable string that might store sensitive or optional information related to the task (not typically exposed in public APIs).
This model is used for storing and processing to-do items in the API.
nano TodoDb.cs
Paste the following content into the file.
using Microsoft.EntityFrameworkCore;

namespace TodoApi
{
    class TodoDb : DbContext
    {
        public TodoDb(DbContextOptions<TodoDb> options)
            : base(options) { }

        public DbSet<Todo> Todos => Set<Todo>();
    }
}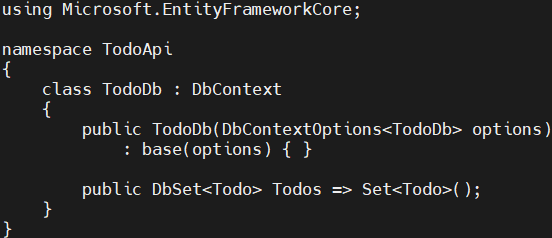
Explanation of the code:
This code defines the TodoDb class, which is a database context used by Entity Framework Core.
- It inherits from
DbContext, enabling interaction with the database. - The constructor accepts
DbContextOptions<TodoDb>to configure the context (e.g., in-memory or SQL database). DbSet<Todo> Todosrepresents a table ofTodoitems in the database, allowing CRUD operations on theTodomodel.
This class is essential for managing data persistence in the ASP.NET Core API.
nano TodoItemDTO.cs
Paste the following content into the file.
namespace TodoApi
{
    public class TodoItemDTO
    {
        public int Id { get; set; }
        public string? Name { get; set; }
        public bool IsComplete { get; set; }

        public TodoItemDTO() { }
        public TodoItemDTO(Todo todoItem) =>
        (Id, Name, IsComplete) = (todoItem.Id, todoItem.Name, todoItem.IsComplete);
    }
}
Explanation of the code:
This code defines a Data Transfer Object (DTO) named TodoItemDTO in the TodoApi namespace.
- It contains only selected properties:
Id,Name, andIsComplete, omitting sensitive fields likeSecret. - The parameterless constructor is used for serialization/deserialization.
- The second constructor maps values from a
Todoobject to this DTO, making it useful for safely sending only necessary data in API responses.
This helps in exposing clean and secure data to clients.
Now, replace the content of the default Program.cs file with your Minimal API logic, including the new OpenTelemetry configuration for metrics and logging.
nano Program.cs
Replace the existing content with the following code.
using Microsoft.EntityFrameworkCore;
using TodoApi; // Ensure this matches your project's namespace
using OpenTelemetry.Metrics;
using OpenTelemetry.Logs;
using Microsoft.Extensions.Logging;
using System.Diagnostics.Metrics;
using OpenTelemetry.Exporter.Prometheus; // Specific using for Prometheus exporter methods
using OpenTelemetry.Exporter; // Keep this for AddConsoleExporter
var builder = WebApplication.CreateBuilder(args);
// Configure in-memory database
builder.Services.AddDbContext<TodoDb>(opt => opt.UseInMemoryDatabase("TodoList"));
// --- OpenTelemetry Configuration ---
var appMeter = new Meter("TodoApi.Metrics"); // Define a Meter for custom metrics (optional for this tutorial, but good practice)
builder.Services.AddOpenTelemetry()
.WithMetrics(metrics => metrics
.AddAspNetCoreInstrumentation() // Captures HTTP request metrics (duration, count)
.AddRuntimeInstrumentation() // Captures .NET runtime metrics (CPU, memory, etc.)
.AddPrometheusExporter()); // Exposes metrics at /metrics endpoint
builder.Logging.AddOpenTelemetry(logging => logging
.AddConsoleExporter()); // Sends logs to console (which Systemd captures)
// --- End OpenTelemetry Configuration ---
// Configure Swagger/OpenAPI
builder.Services.AddEndpointsApiExplorer();
builder.Services.AddOpenApiDocument(config =>
{
config.DocumentName = "TodoAPI";
config.Title = "TodoAPI v1";
config.Version = "v1";
});
var app = builder.Build();
// Enable Swagger UI always for testing purposes
app.UseOpenApi();
app.UseSwaggerUi(config =>
{
config.DocumentTitle = "TodoAPI";
config.Path = "/swagger";
config.DocumentPath = "/swagger/{documentName}/swagger.json";
config.DocExpansion = "list";
});
// --- ADDED: Expose Prometheus metrics endpoint ---
// This needs to be called AFTER app.Build() and before app.Run()
app.UseOpenTelemetryPrometheusScrapingEndpoint();
// --- END ADDED SECTION ---
// Define a route group for todo items to reduce repetition
RouteGroupBuilder todoItems = app.MapGroup("/todoitems");
// Define API endpoints using TypedResults and DTOs
todoItems.MapGet("/", GetAllTodos);
todoItems.MapGet("/complete", GetCompleteTodos);
todoItems.MapGet("/{id}", GetTodo);
todoItems.MapPost("/", CreateTodo);
todoItems.MapPut("/{id}", UpdateTodo);
todoItems.MapDelete("/{id}", DeleteTodo);
app.Run();
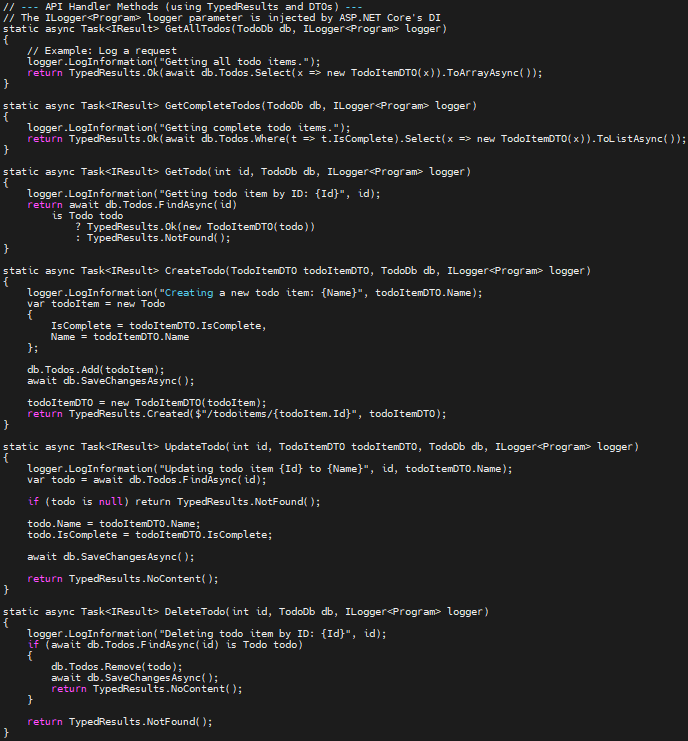
// --- API Handler Methods (using TypedResults and DTOs) ---
// The ILogger<Program> logger parameter is injected by ASP.NET Core's DI
static async Task<IResult> GetAllTodos(TodoDb db, ILogger<Program> logger)
{
// Example: Log a request
logger.LogInformation("Getting all todo items.");
return TypedResults.Ok(await db.Todos.Select(x => new TodoItemDTO(x)).ToArrayAsync());
}
static async Task<IResult> GetCompleteTodos(TodoDb db, ILogger<Program> logger)
{
logger.LogInformation("Getting complete todo items.");
return TypedResults.Ok(await db.Todos.Where(t => t.IsComplete).Select(x => new TodoItemDTO(x)).ToListAsync());
}
static async Task<IResult> GetTodo(int id, TodoDb db, ILogger<Program> logger)
{
logger.LogInformation("Getting todo item by ID: {Id}", id);
return await db.Todos.FindAsync(id)
is Todo todo
? TypedResults.Ok(new TodoItemDTO(todo))
: TypedResults.NotFound();
}
static async Task<IResult> CreateTodo(TodoItemDTO todoItemDTO, TodoDb db, ILogger<Program> logger)
{
logger.LogInformation("Creating a new todo item: {Name}", todoItemDTO.Name);
var todoItem = new Todo
{
IsComplete = todoItemDTO.IsComplete,
Name = todoItemDTO.Name
};
db.Todos.Add(todoItem);
await db.SaveChangesAsync();
todoItemDTO = new TodoItemDTO(todoItem);
return TypedResults.Created($"/todoitems/{todoItem.Id}", todoItemDTO);
}
static async Task<IResult> UpdateTodo(int id, TodoItemDTO todoItemDTO, TodoDb db, ILogger<Program> logger)
{
logger.LogInformation("Updating todo item {Id} to {Name}", id, todoItemDTO.Name);
var todo = await db.Todos.FindAsync(id);
if (todo is null) return TypedResults.NotFound();
todo.Name = todoItemDTO.Name;
todo.IsComplete = todoItemDTO.IsComplete;
await db.SaveChangesAsync();
return TypedResults.NoContent();
}
static async Task<IResult> DeleteTodo(int id, TodoDb db, ILogger<Program> logger)
{
logger.LogInformation("Deleting todo item by ID: {Id}", id);
if (await db.Todos.FindAsync(id) is Todo todo)
{
db.Todos.Remove(todo);
await db.SaveChangesAsync();
return TypedResults.NoContent();
}
return TypedResults.NotFound();
}
Explanation of the code:
usingDirectives: These import necessary namespaces.- App Builder and Services Configuration
var builder = WebApplication.CreateBuilder(args);:Creates a temporary database stored in memory (no external DB server).builder.Services.AddDbContext(opt => opt.UseInMemoryDatabase("TodoList"));:TodoDbis your customDbContext(likely containsDbSet<Todo>).
- OpenTelemetry Configuration:
var appMeter = new Meter("TodoApi.Metrics");: Defines a Meter (optional), used for custom metrics tracking if needed.- Register OpenTelemetry:
AddAspNetCoreInstrumentation: Tracks HTTP request duration, status, etc.AddRuntimeInstrumentation: CPU, memory, GC metrics.AddPrometheusExporter: Exposes metrics in Prometheus format.
- Logging via OpenTelemetry:
builder.Logging.AddOpenTelemetry(logging => logging.AddConsoleExporter());: Captures logs and writes them to the console (can be picked by systemd/journald, etc.)
- Swagger Setup:
builder.Services.AddEndpointsApiExplorer();builder.Services.AddOpenApiDocument(…);- Enables Swagger UI and API documentation generation using NSwag.
- Build the App and Configure Middlewares:
- Build: var app = builder.Build();
- Swagger Middleware:
- app.UseOpenApi(); // Serves swagger.json
- app.UseSwaggerUi(…); // UI config
- Prometheus Endpoint: app.UseOpenTelemetryPrometheusScrapingEndpoint();
- Exposes
/metricsendpoint. - Prometheus scrapes this endpoint to gather metrics.
- Exposes
- Minimal API Route Group:
RouteGroupBuilder todoItems = app.MapGroup("/todoitems");- define endpoints under this group
- handlers follow RESTful CRUD operations.
- API Handler Methods:
- All methods use
TypedResults(for better performance/type safety) and are asynchronous. GetAllTodos(): Fetch all itemsGetCompleteTodos(): OnlyIsComplete == trueGetTodo(id): Returns item or404if not found.CreateTodo(dto): Creates a new item.UpdateTodo(id, dto): Updates existing.DeleteTodo(id): Deletes item if found.
- All methods use
Now, publish your application directly on the EC2 instance to create a self-contained deployment. Ensure you are in the ~/TodoApi directory.
dotnet publish -c Release -o ./publish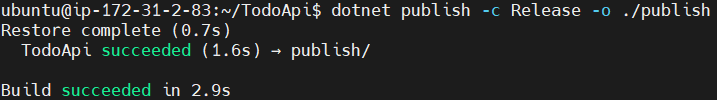
Step #3:Configure as a systemd Service
Create a systemd service to run the API.
sudo nano /etc/systemd/system/todoapi.service
Paste the following content into the file.
[Unit]
Description=ASP.NET Core Minimal API
[Service]
WorkingDirectory=/home/ubuntu/TodoApi/publish
ExecStart=/home/ubuntu/.dotnet/dotnet /home/ubuntu/TodoApi/publish/TodoApi.dll
Restart=always
RestartSec=10
SyslogIdentifier=todoapi
User=ubuntu
Environment=ASPNETCORE_ENVIRONMENT=Production
Environment=ASPNETCORE_URLS=http://0.0.0.0:5000
[Install]
WantedBy=multi-user.target
Explanation of the code:
This is a Systemd service unit file used to run an ASP.NET Core Minimal API as a background service on a Linux system.
[Unit]section describes the service purpose (Description).[Service]sets:WorkingDirectory: Path where the app is published.ExecStart: Command to run the .NET app.Restart=always: Automatically restarts if it crashes.SyslogIdentifier: Used for logging under a unique name.User: Runs under theubuntuuser.Environment: Sets environment variables like the environment (Production) and the port (5000).
[Install]tells Systemd to start this service at boot (multi-user.target).
This allows the .NET API to run persistently and restart on failure.
Reload systemd then enable and start the API service.
sudo systemctl daemon-reload
sudo systemctl enable todoapi
sudo systemctl start todoapi
Check its status to verify if its running or not.
sudo systemctl status todoapi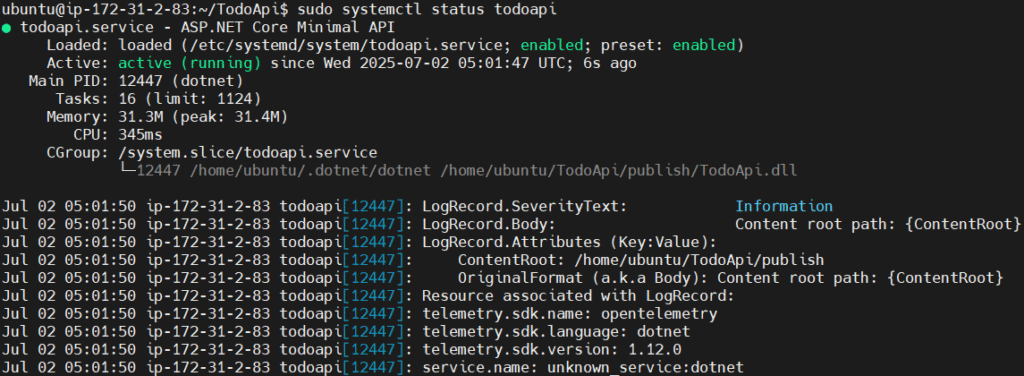
Navigate back to home directory.
cd
Step #4:Install and Configure Prometheus
Create Prometheus user.
sudo useradd --no-create-home --shell /bin/false prometheus
Create necessary directories.
sudo mkdir /etc/prometheus /var/lib/prometheus
Download the latest Prometheus binary.
wget https://github.com/prometheus/prometheus/releases/download/v3.4.2/prometheus-3.4.2.linux-amd64.tar.gz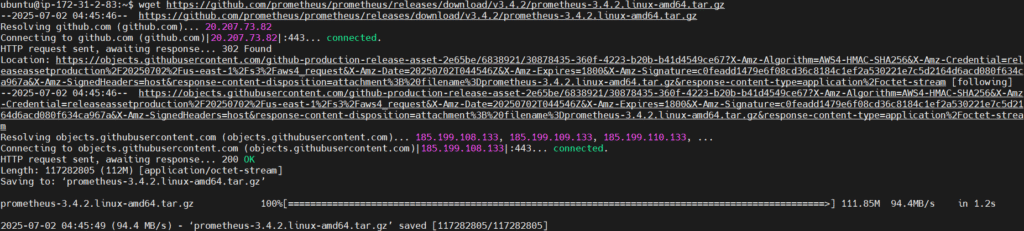
Extract the archive.
tar -xvf prometheus-3.4.2.linux-amd64.tar.gz
Navigate into the extracted Prometheus directory.
cd prometheus-3.4.2.linux-amd64
Move the Prometheus binaries to /usr/local/bin.
sudo mv prometheus promtool /usr/local/bin/
Set ownership for the binaries.
sudo chown prometheus:prometheus /usr/local/bin/prometheus /usr/local/bin/promtool
Navigate back to home directory.
cd
Set ownership for the binaries.
sudo chown -R prometheus:prometheus /etc/prometheus /var/lib/prometheus
Create and configure Prometheus config file.
sudo nano /etc/prometheus/prometheus.yml
Paste the following content into the file.
global:
  scrape_interval: 15s

scrape_configs:
  - job_name: 'todoapi'
    static_configs:
- targets: ['localhost:5000'] 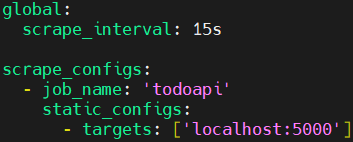
Set ownership for the config file.
sudo chown prometheus:prometheus /etc/prometheus/prometheus.yml
Create a systemd service for Prometheus.
sudo nano /etc/systemd/system/prometheus.service
Paste the following content into the file.
[Unit]
Description=Prometheus
Wants=network-online.target
After=network-online.target

[Service]
User=prometheus
Group=prometheus
ExecStart=/usr/local/bin/prometheus \
  --config.file=/etc/prometheus/prometheus.yml \
  --storage.tsdb.path=/var/lib/prometheus \
  --web.listen-address=:9090

Restart=always
RestartSec=10
SyslogIdentifier=prometheus

[Install]
WantedBy=multi-user.target
Explanation of the code:
This is a Systemd service unit file for running Prometheus as a background Linux service.
[Unit]section ensures Prometheus starts after the network is online.[Service]defines how the service runs:- Runs as
prometheususer and group. - Executes the Prometheus binary with:
--config.file: path to its config file.--storage.tsdb.path: directory for storing time-series data.--web.listen-address=:9090: exposes Prometheus on port 9090.
Restart=always: restarts Prometheus if it crashes.RestartSec=10: waits 10 seconds before restarting.SyslogIdentifier: logs under the name “prometheus”.
- Runs as
[Install]ensures Prometheus starts automatically on boot (multi-user.target).
This setup allows Prometheus to run continuously and reliably as a system service.
Reload, enable and start Prometheus.
sudo systemctl daemon-reload
sudo systemctl enable prometheus
sudo systemctl start prometheus
Step #5:Install and Start Grafana
Install dependencies for Grafana.
sudo apt-get install -y apt-transport-https software-properties-common wget
Add Grafana’s GPG key.
sudo mkdir -p /etc/apt/keyrings/
sudo wget -q -O /etc/apt/keyrings/grafana.key https://apt.grafana.com/gpg.key
Add the Grafana APT repository.
echo "deb [signed-by=/etc/apt/keyrings/grafana.key] https://apt.grafana.com stable main" | sudo tee -a /etc/apt/sources.list.d/grafana.list
Update apt cache.
sudo apt-get update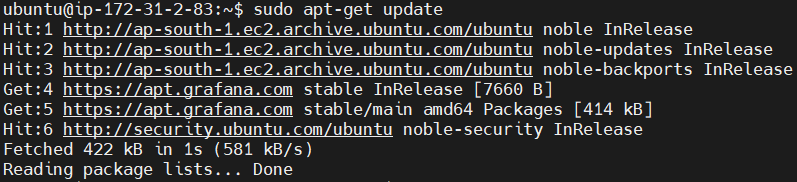
Install Grafana.
sudo apt-get install grafana -y
Enable and start Grafana service.
sudo systemctl enable grafana-server
sudo systemctl start grafana-server
Step #6:Test the Deployed .Net API
To access API, navigate to http://<EC2-Public-IPv4-Address>/swagger

Interact with your API (POST, GET, PUT, DELETE etc.) to generate some traffic. This will produce metrics and logs.
We’ll use a JSON payload to interact with the API endpoints.
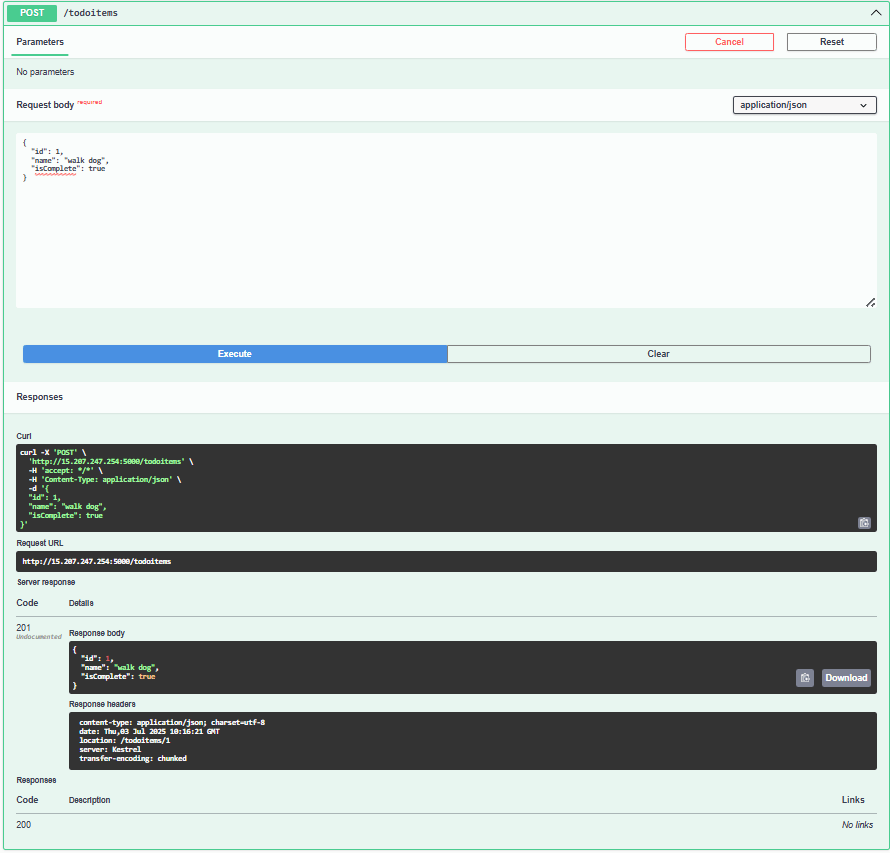
In POST/todoitems paste the following in Request body and execute it. It will Add a New Todo Item.
{
  "id": 1,
  "name": "walk dog",
  "isComplete": true
}
You should receive a 201 Created response.
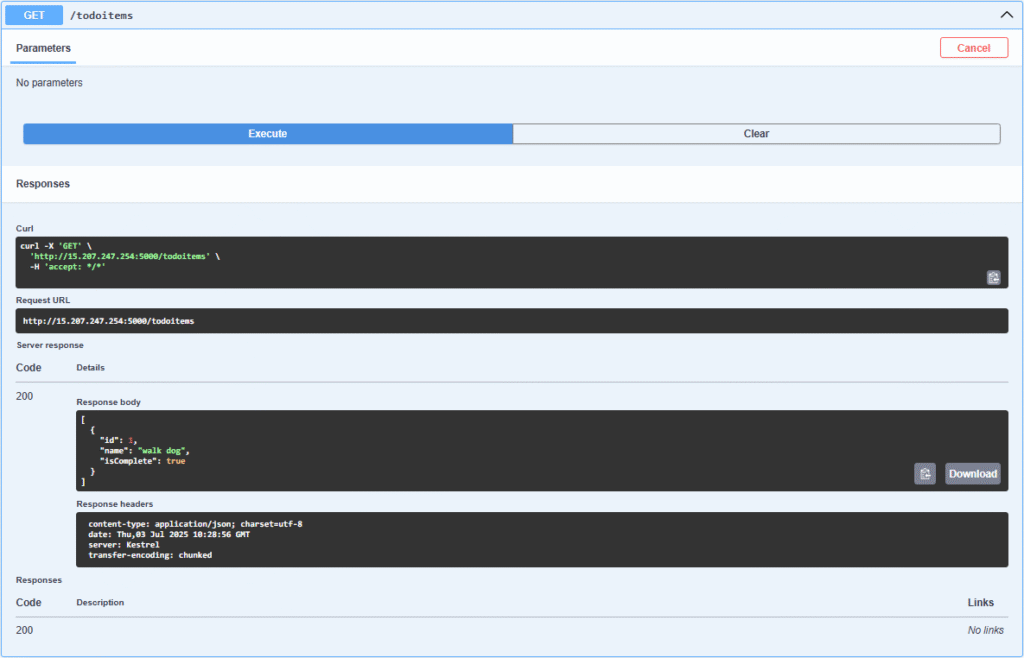
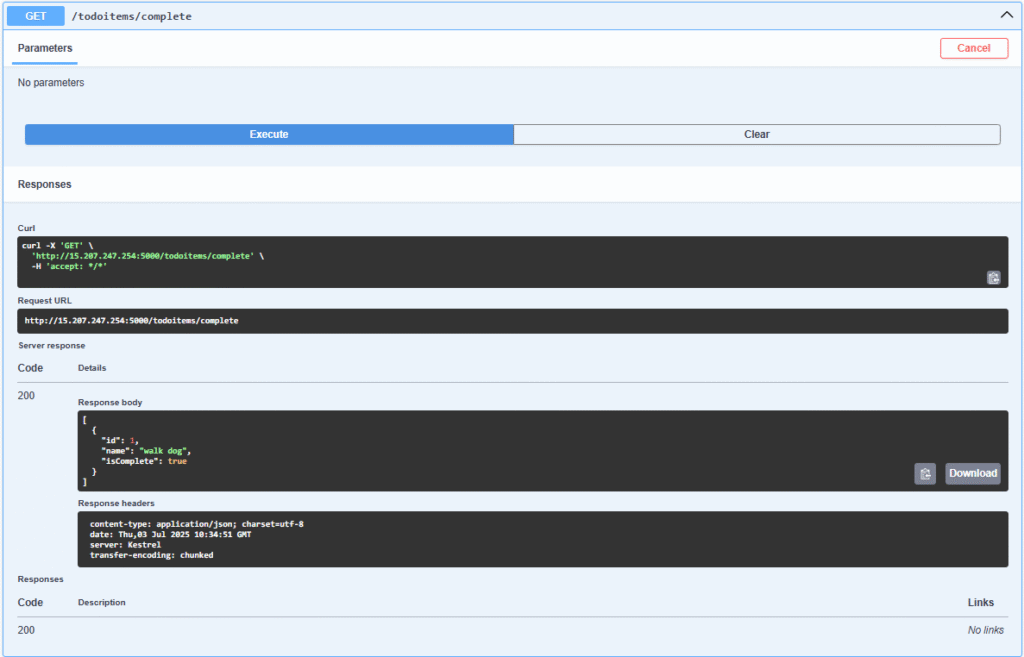
GET: Retrieve All Todo Items. Click Try it out and Execute.
You should receive a 200 response. Expected Response.
[
  {
    "id": 1,
    "name": "walk dog",
    "isComplete": true
  }
]
GET/todoitem/complete: Retrieve All Completed Todo Items
This should return only those items where isComplete is true. If its false it will not return it.
You should receive a 200 response. Expected Response.
[
  {
    "id": 1,
    "name": "walk dog",
    "isComplete": true
  }
]
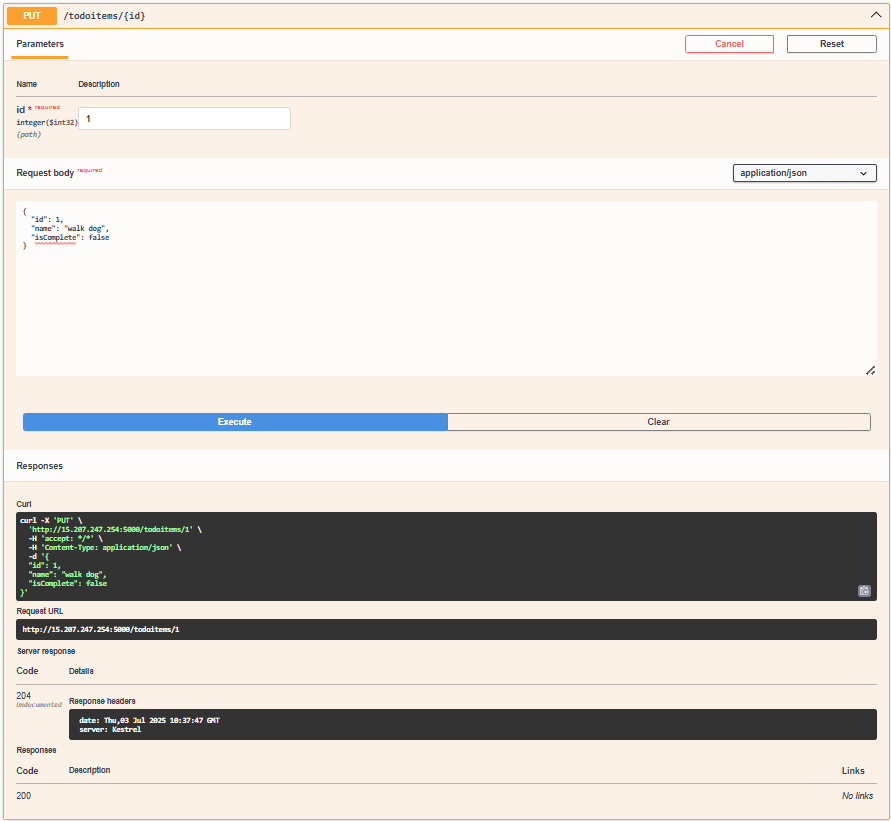
PUT: Update an Existing Todo Item. First enter the id e.g. 1. Update the isComplete to false of the todo item.
Expected Response: HTTP status 204. It will change isComplete to false from true.
GET/todoitem/id. Enter the id if request e.g. 1 and it will return the requested body of that id.

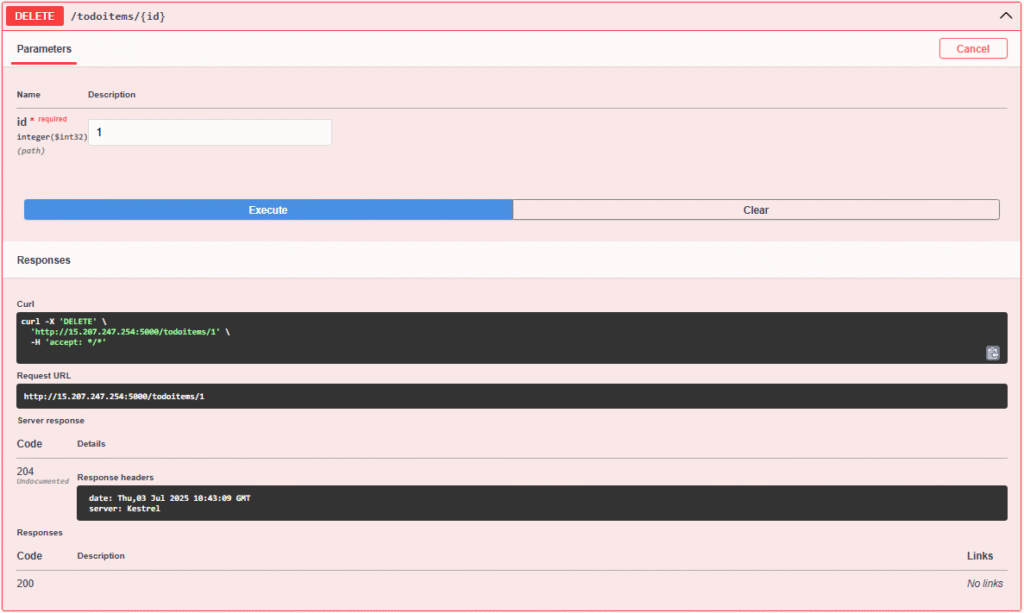
DELETE: Remove a Todo Item. Enter the id e.g. 1. and click execute and json body will be deleted.
We will also generate some error to see.
curl http://localhost:5000/invalid-endpoint
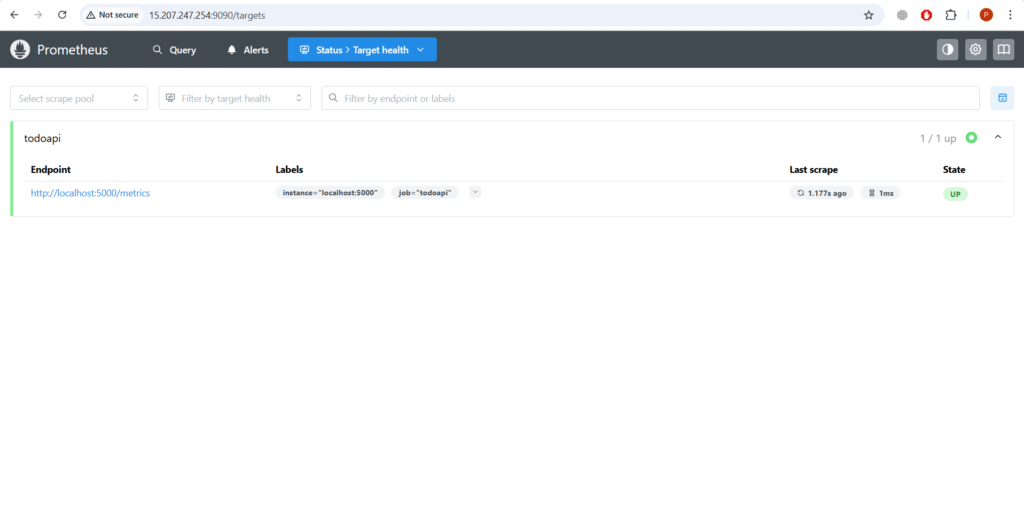
Step #7:Test the Prometheus Deployment
Navigate to http://<EC2-Public-IPv4-Address>:9090

Go to “Status” -> “Target health”.
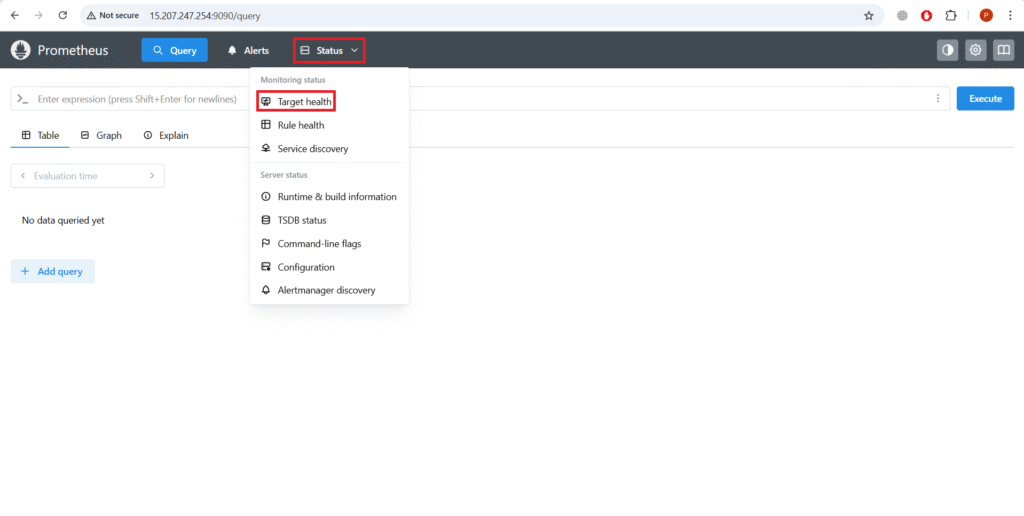
You should see todoapi target with state UP.
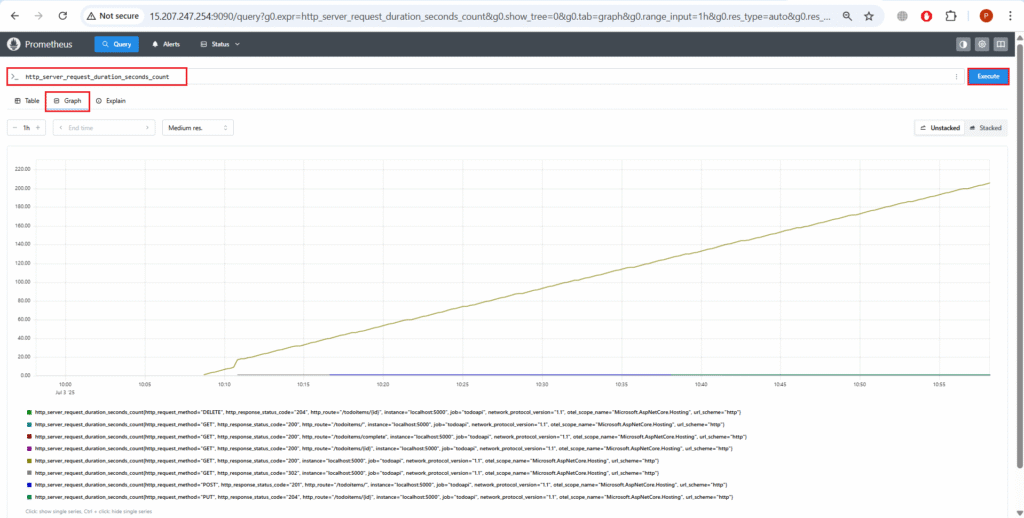
Go back and then to “Graph” and try querying some metrics,
e.g., http_server_request_duration_seconds_count and Execute it.
Step #8:Test the Grafana Deployment
Navigate to http://<EC2-Public-IPv4-Address>:3000
The default login is Username : admin, Password: admin.
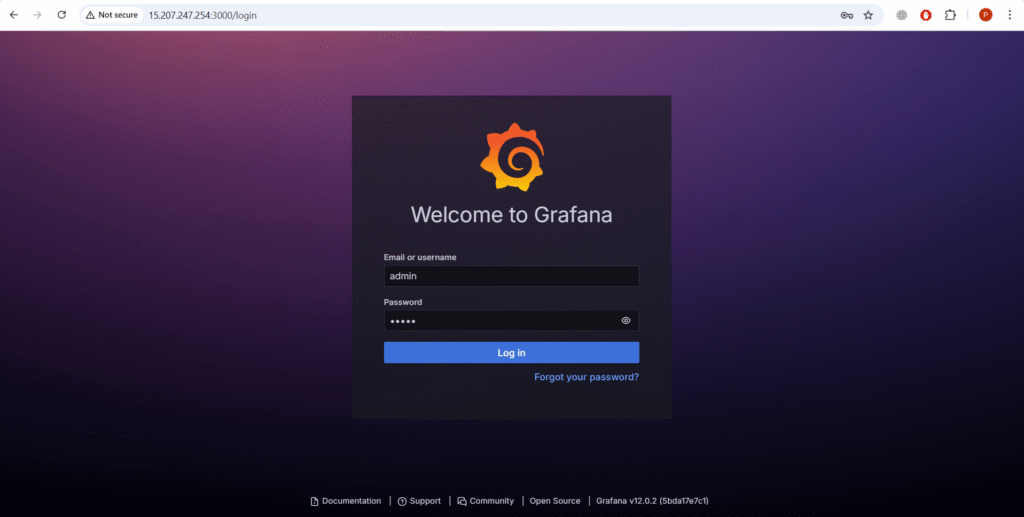
You will be prompted to change the password on first login. You can change it or just skip it.

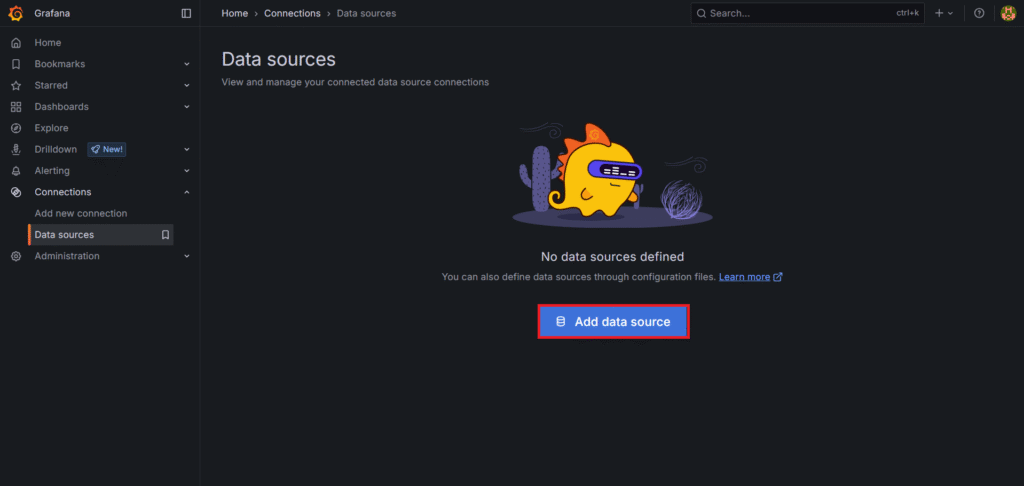
Now go to Connections from the left sidebar then go to Data sources.
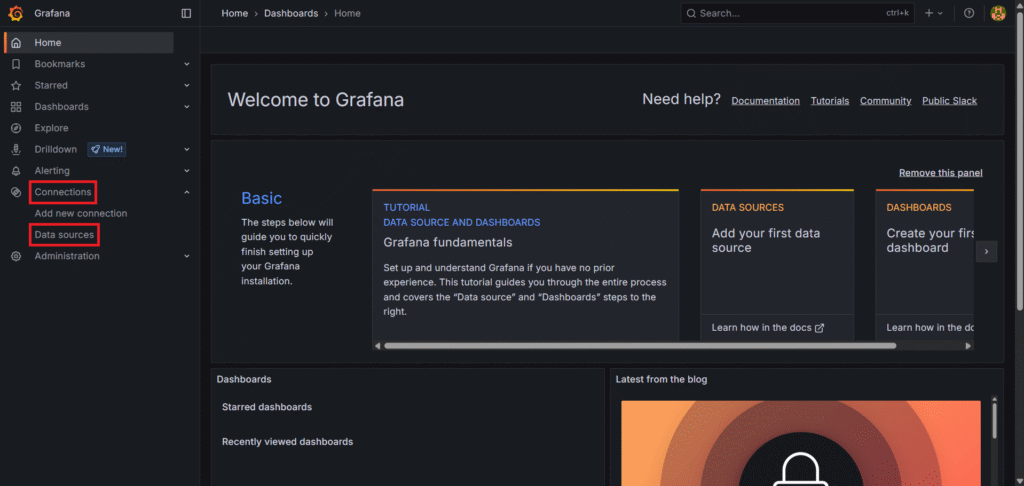
Click Add Data Source
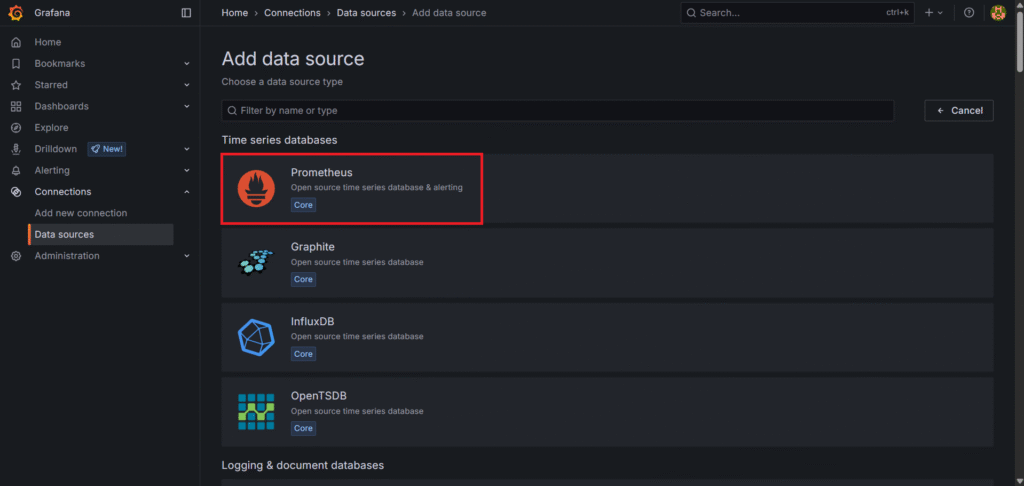
Choose Prometheus as a Data source
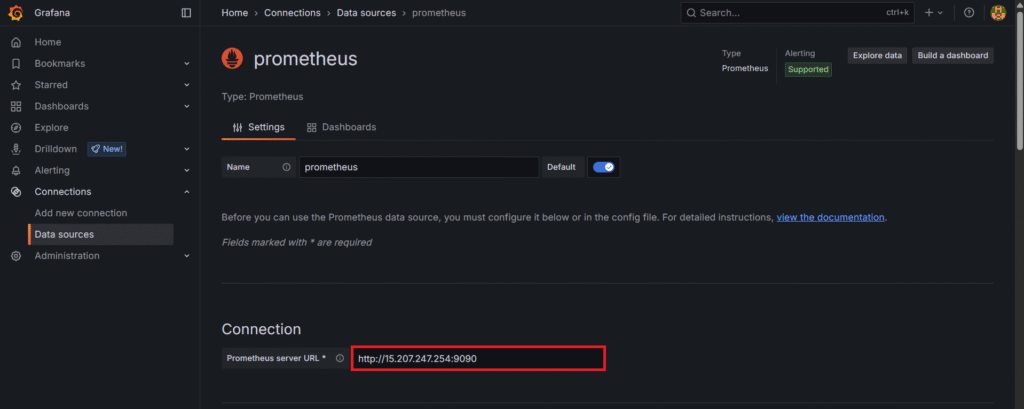
Set URL: http://<EC2-Public-IPv4-Address>:9090
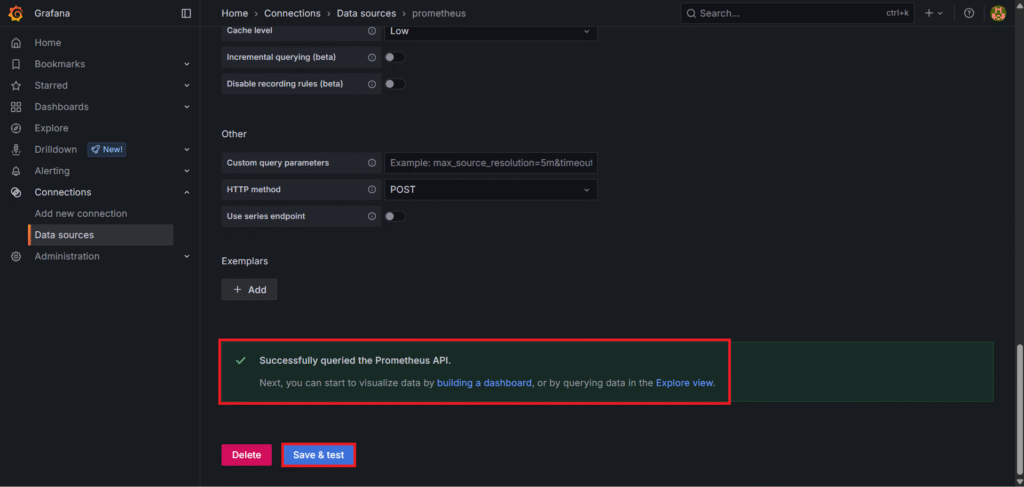
Click Save & Test. It should say “Successfully queried the Prometheus API“.
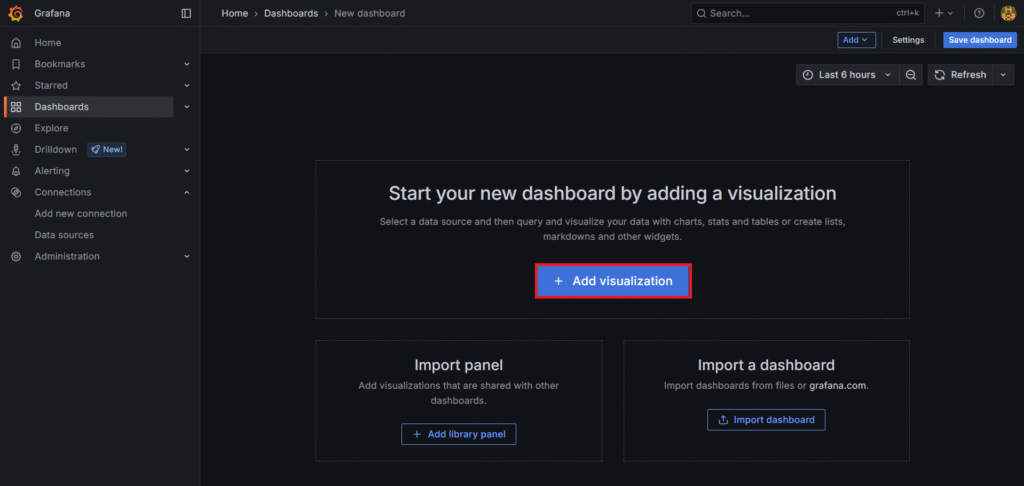
Click “+ ” icon -> New Dashboard at the top-right corner.

Click Add visualization.
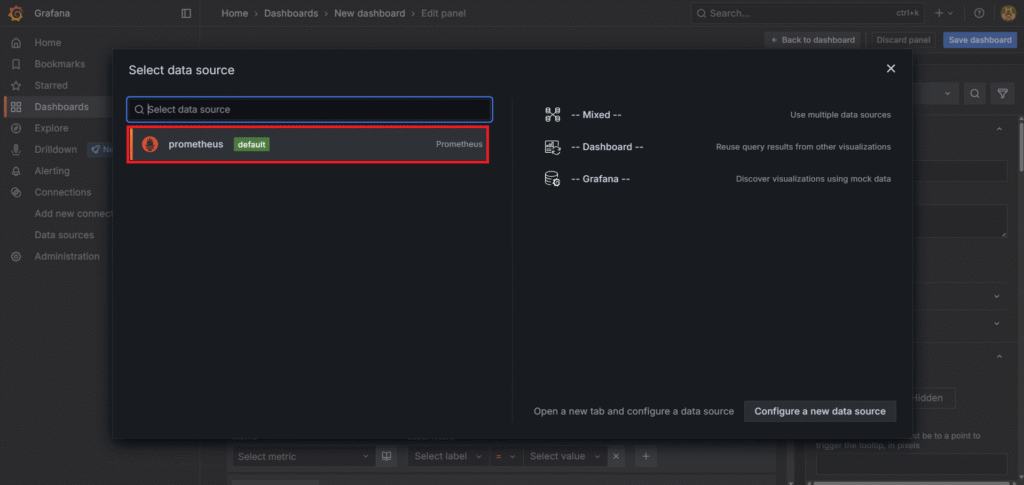
Select Prometheus as a date source.
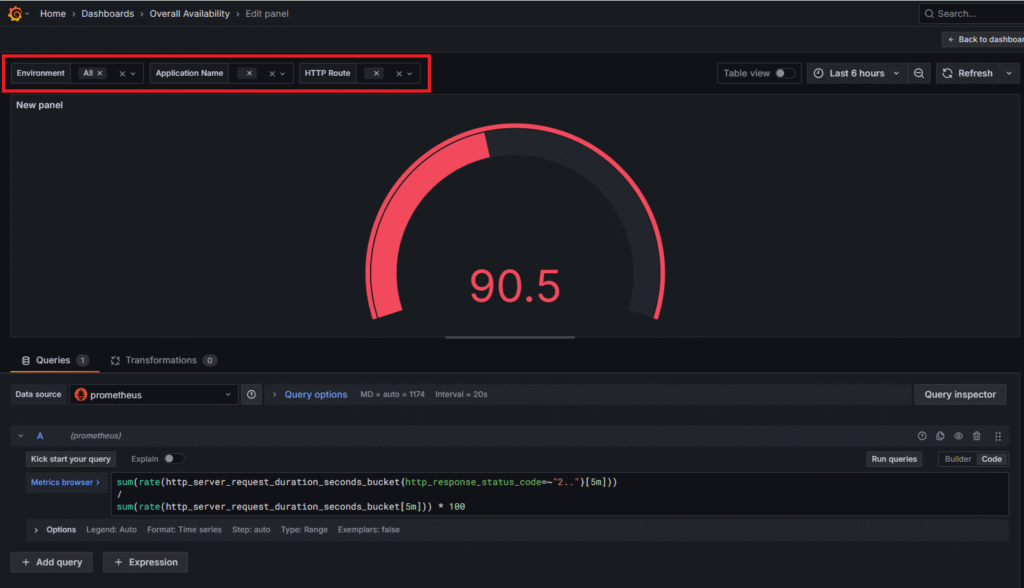
Select Gauge as a visualization. Enter a below Promql query in the Metrics browser. Click on Run queries. Then click on Save dashboard.
sum(rate(http_server_request_duration_seconds_bucket{http_response_status_code=~"2.."}[5m]))
/
sum(rate(http_server_request_duration_seconds_bucket[5m])) * 100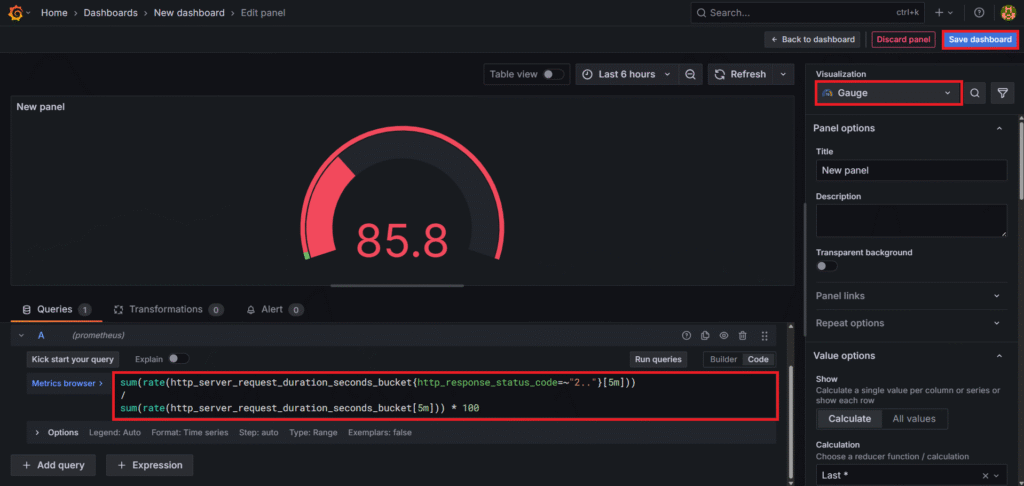
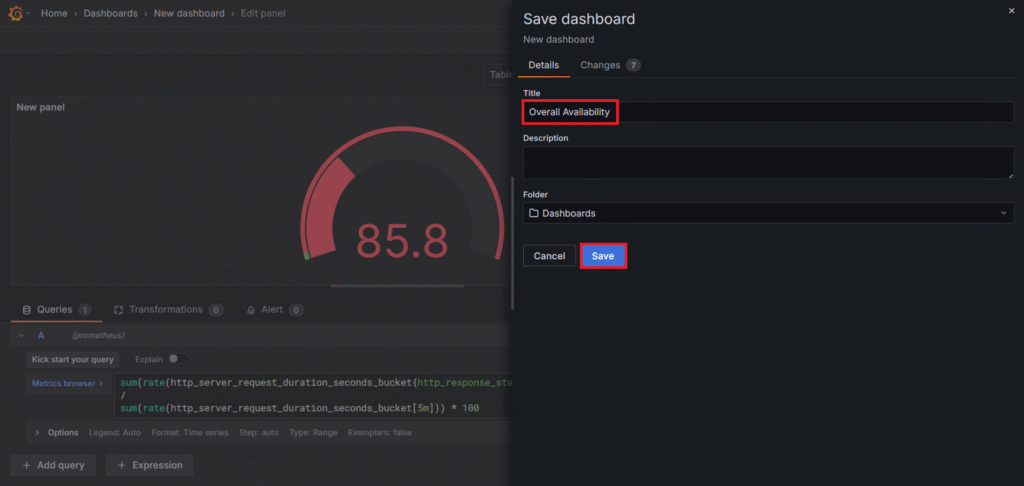
Enter the Title like Overall Availability and click on Save.
Now go to Add and click on Visualization to add another panel in it.

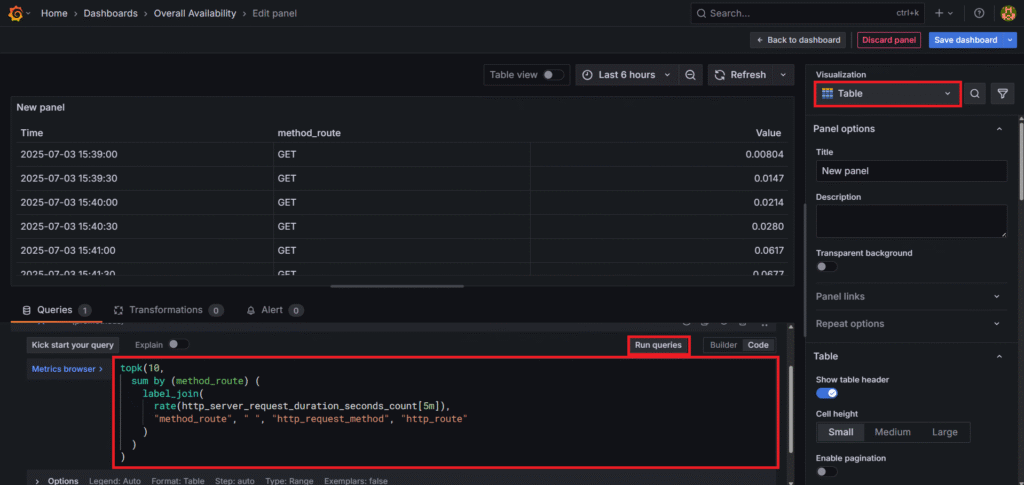
Select Table as a visualization. Enter a below Promql query in the Metrics browser.
topk(10,
  sum by (http_request_method, http_route) (
    rate(http_server_request_duration_seconds_count[5m])
  )
)
This shows the top 10 most requested endpoints (GET, POST, PUT etc.) and how many times each was hit. Click on Run queries.
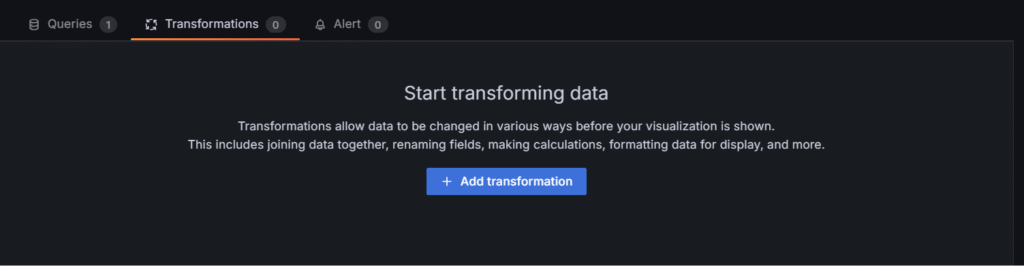
Go to Transformations and click on Add transformation.
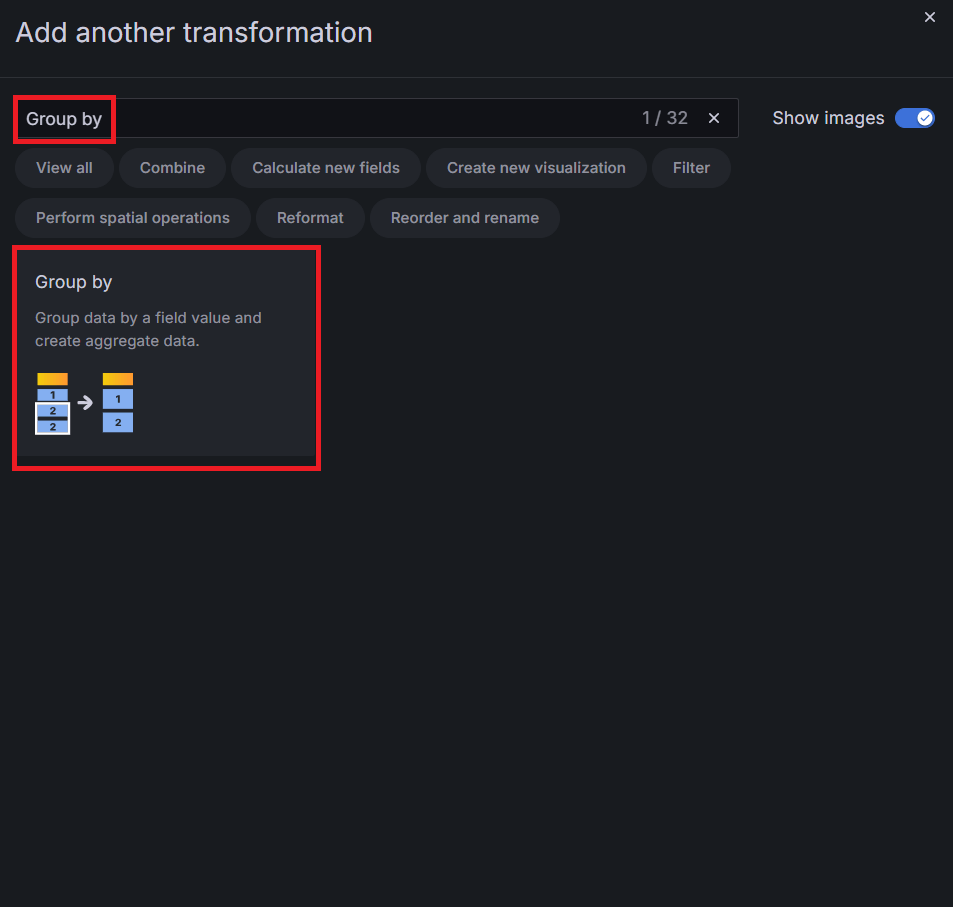
Search for Group by and select it.
Keep time as Ignored, method_route : Group by and Value : Calculate – Total

Now click on Save Dashboard to save it. as you can see it has Grouped methoud_route like GET POST and calculate their value.
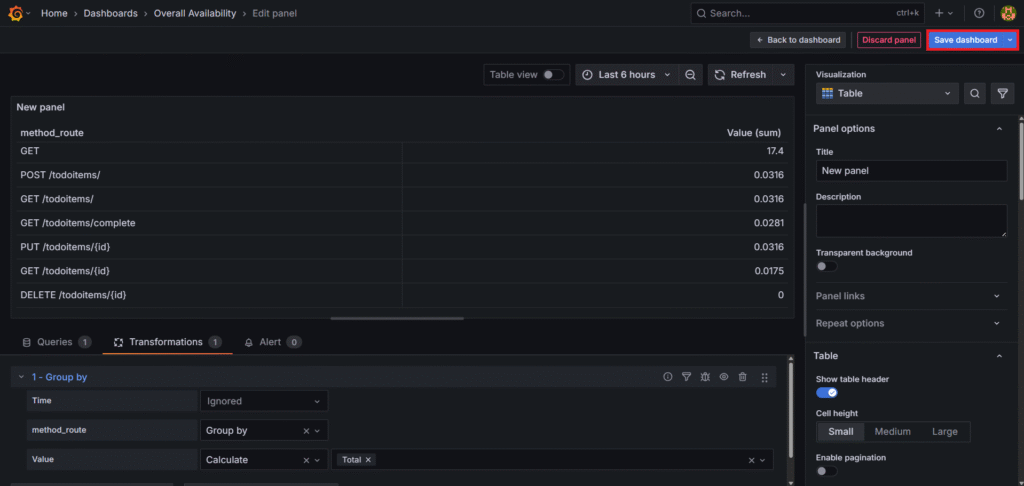
Now our dashboard will look like this.

Step #9:Add Custom Dropdowns in Grafana
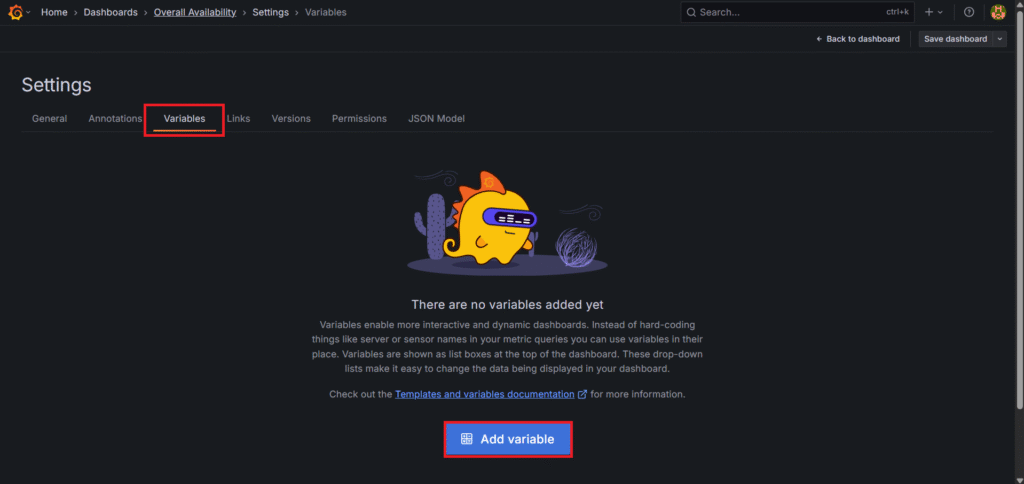
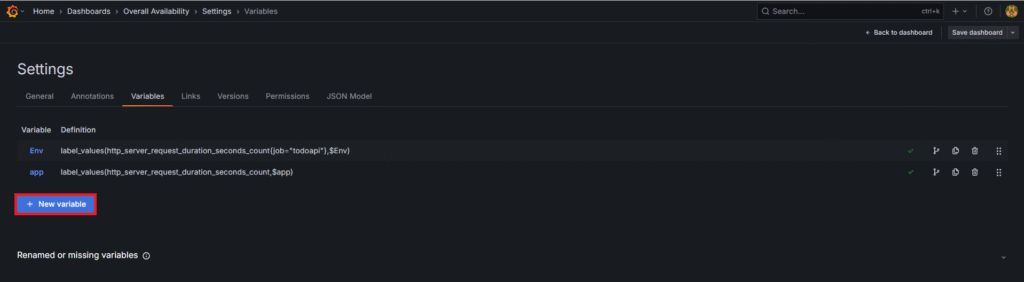
Go to Settings at top-right corner.
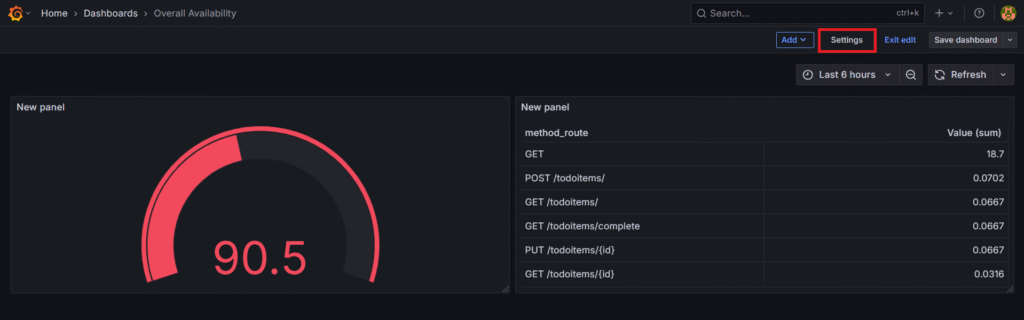
Then Go to Variables. Click on Add variable.
Enter
- Name: Env
- Label: Environment
- Query type: Label values
- Label: $Env
- Metric: http_server_request_duration_seconds_count
- Label filters: job : todoapi
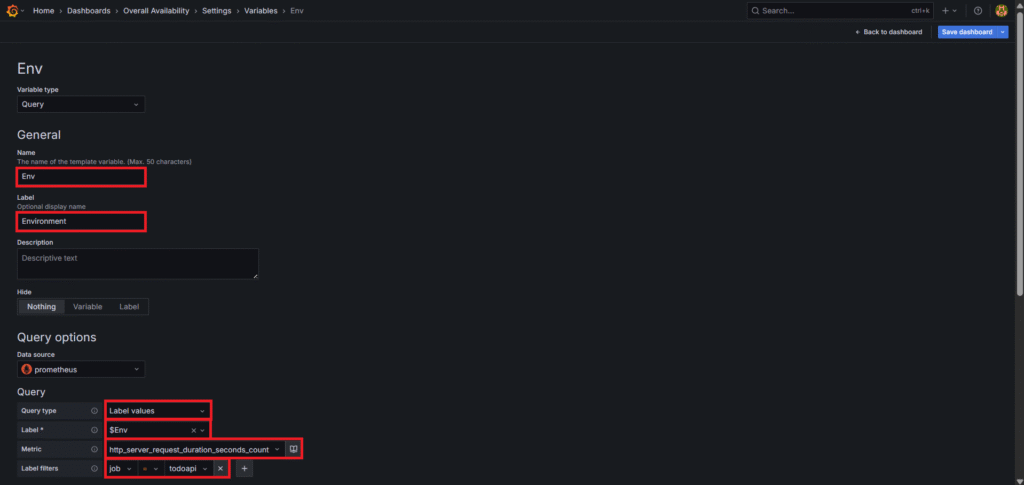
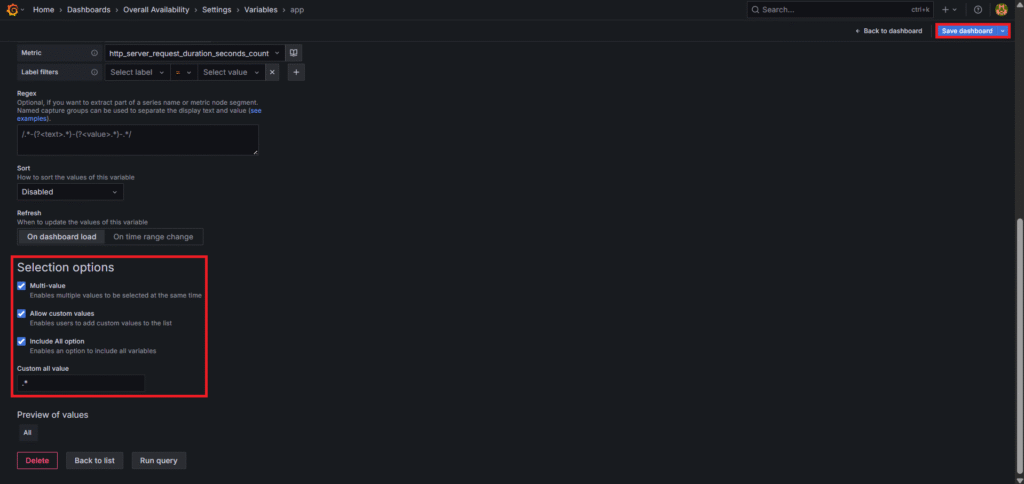
In selection option Select Multi-value and Include all option and custome of value : .* Click on Save dashboard

Go back to variables and click on New variable.

Enter
- Name: app
- Label: Application Name
- Query type: Label values
- Label: $app
- Metric: http_server_request_duration_seconds_count
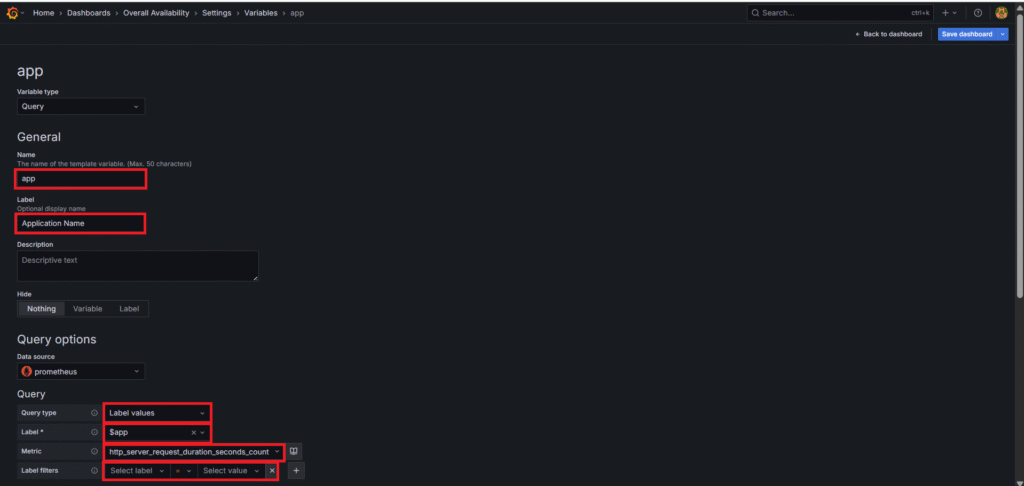
In selection option Select Multi-value and Include all option and custome of value : .* Click on Save dashboard
Go back to variables and click on New variable.
Enter
- Name: Routes
- Label: HTTP Route
- Query type: Label values
- Label: http_route
- Metric: http_server_request_duration_seconds_count
- Label filters: job : todoapi

In selection option Select Multi-value and Include all option and custome of value : .* Click on Save dashboard.

Now go back to your dashboard and go to any panel.
You will see the custom dropdown boxes are added.
Conclusion:
With OpenTelemetry, Prometheus and Grafana in place, you gain full visibility into your .NET API’s behavior and availability. You can now monitor live traffic, understand endpoint usage, detect errors early, and ensure SLA compliance. This setup is scalable, customizable, and works seamlessly across environments. By adopting this observability stack, you empower your development and DevOps teams with real-time, actionable insights. It’s a major step forward in building resilient and production-ready .NET applications.
Related Articles:
Install SonarQube on Ubuntu 24.04 LTS
Reference: