We will explain OpenTelemetry Instrumentation in a simple and beginner-friendly way.
Table of Contents
What is Instrumentation?
Instrumentation is the process of enabling an application to emit telemetry data about its behavior and performance.
In simple words : Instrumentation makes your application “observable”.
What Happens During Instrumentation?
• Code or tools are added
• Telemetry signals are generated
• Data is sent for monitoring and analysis
• Without instrumentation, observability is not possible.
Problems Without Instrumentation
• Hard to debug production issues
• No visibility into performance bottlenecks
• Difficult root cause analysis
Benefits of Instrumentation
• Faster debugging
• Better performance monitoring
• Improved system reliability
• Better user experience
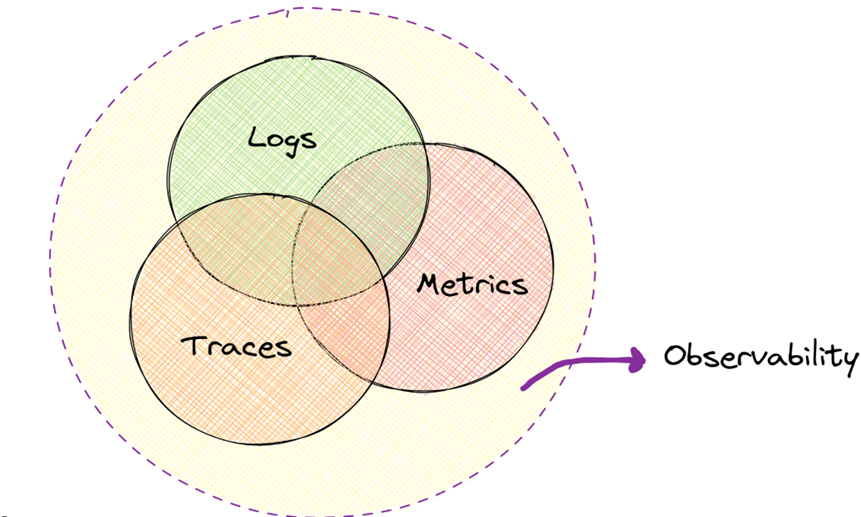
Telemetry Signals
Traces
• Show the end-to-end flow of a request
• Help identify where time is spent
• Made up of spans
Example: User → API → Service → Database
Metrics
• Numeric measurements over time
Examples:
• Response time
• Request count
• Error rate
• CPU/memory usage
• Used for: Dashboards & Alerts
Logs
• Detailed event records
• Errors, warnings, informational messages
• Help understand what exactly happened
Together – Traces + Metrics + Logs give a complete system view
What is OpenTelemetry?
OpenTelemetry is an open-source observability framework for collecting telemetry data.
Why OpenTelemetry?
• Vendor-neutral
• Language-agnostic
• Standardized approach
Key Idea
• Instrument once, export anywhere
You can send data to tools like:
• Jaeger
• Prometheus
• Grafana
• Datadog New Relic
How OpenTelemetry Enables Instrumentation
OpenTelemetry provides:
• APIs → define what to collect
• SDKs → process and export data
• Auto-instrumentation tools → zero-code setup
It simplifies:
• Telemetry generation
• Data consistency
• Integration with backends
OpenTelemetry enables instrumentation in the following ways :
• Zero-code
• Code-based
• Libraries
Code-based Instrumentation
Developers manually add OpenTelemetry code using APIs and SDKs.
Code-based Instrumentation means manually adding OpenTelemetry code inside your application.
What It Captures
• Custom business logic
• Important application flows
• Domain-specific operations
You explicitly tell OpenTelemetry:
• When to start tracking
• What to track
• When to stop tracking
How Code-based Instrumentation Works
Step-by-step Flow
• Developer adds OpenTelemetry API calls
• Creates custom spans
• Adds attributes and events
• SDK processes telemetry
• Data is exported via Collector
Example (Conceptual)
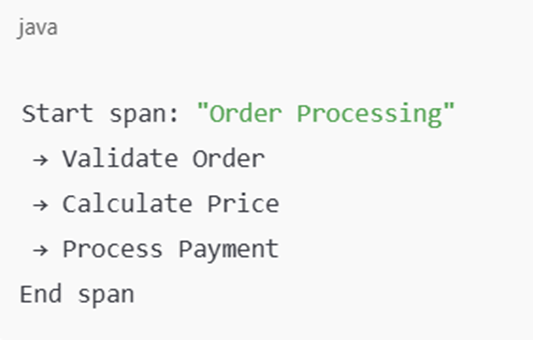
This level of visibility is usually not possible with auto-instrumentation alone” (more accurate)
What Code-based Instrumentation Captures
🔹 Business Logic
• Order processing
• Payment flow
• User validation
• Custom calculations
🔹 Custom Events
• Success / failure points
• Decision branches
• Retry attempts
🔹 Rich Context
• User ID
• Order ID
• Transaction ID
• Custom tags
Advantages of Code-based Instrumentation
✅ Deep Visibility
Full insight into application behavior
✅ Business-Level Tracing
Understand why something failed, not just where
✅ Fine Control
Decide:
Which logic to trace
How much data to collect
What is important
Limitations of Code-based Instrumentation
❌ Requires Code Changes
Development effort
Code reviews required
❌ Higher Maintenance
Instrumentation must be maintained
Needs updates with logic changes
❌ Risk if Overused
Too many spans can impact performance
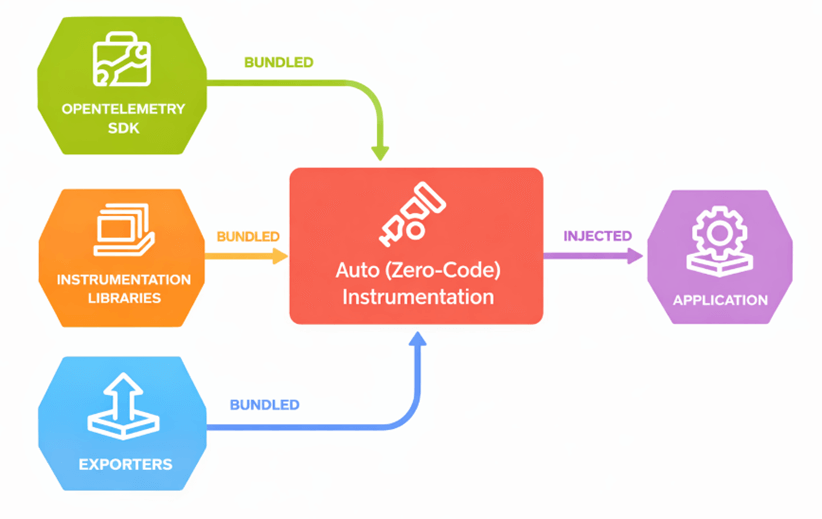
Zero-code (Auto) Instrumentation
Zero-code (or Auto) Instrumentation means adding observability to an application without changing its source code.
👉 You do not touch:
• Application logic
• Business code
• Existing deployments
Instead, you attach OpenTelemetry agents or auto-instrumentation libraries at runtime.
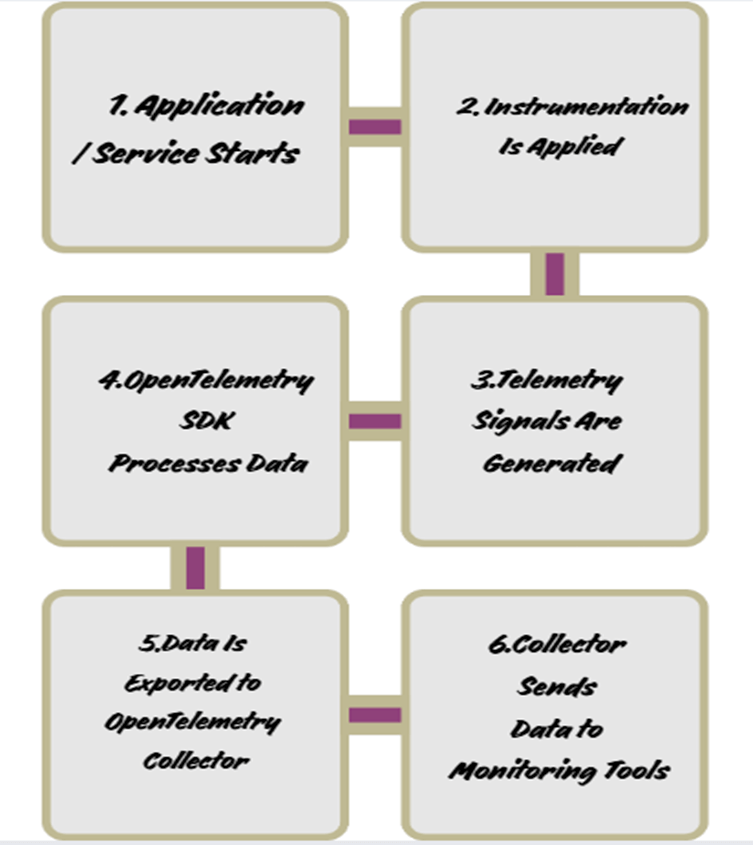
How Zero-code Instrumentation Works
Step-by-step Flow
An agent or auto-instrumentation tool is attached to the application
1.The agent:
1.Intercepts framework calls
2.Hooks into libraries at runtime
2.Telemetry data is generated automatically
3.Data is sent to OpenTelemetry SDK / Collector
4.Collector exports it to monitoring tools
How Agents Work (Very Important)
Agents:
• Run alongside your application
• Observe function calls internally
• Do not change your actual code
Example:
• Java → opentelemetry-javaagent
• Python → opentelemetry-instrument
• Node.js → auto-instrumentation packages
Automatically Instruments Common Frameworks
Auto-instrumentation already knows how popular frameworks work.
Examples
Web Frameworks
• Spring Boot
• Express.js
• Flask
• FastAPI
Database Libraries
• JDBC
• MySQL / PostgreSQL drivers
• MongoDB
Messaging & RPC
• Kafka
• gRPC
• RabbitMQ
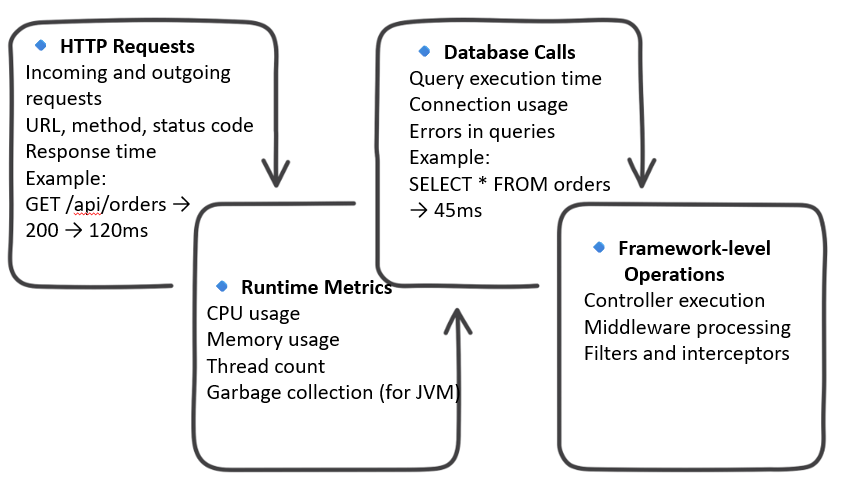
What Zero-code Instrumentation Captures
Advantages of Zero-code Instrumentation
• Fast to Set Up
• Takes minutes, not days
• Ideal for quick visibility
• No Code Changes
• Safe for production
• No risk of breaking functionality
• Ideal for Legacy Systems
• Works even if:
• Code is old
• Source code is unavailable
• Application is third-party
• Standardized Telemetry
• Same format across applications
• Easy to compare services
Limitations of Zero-code Instrumentation
❌ Limited Customization
• You cannot decide what business logic to track
• You get what the agent provides
❌ No Business-level Insights
• You cannot answer questions like:
• Which step in order processing is slow?
• Why did payment validation fail?
• How long does discount calculation take?
❌ Generic View Only
• Focused on:
–Frameworks
–Infrastructure
–Libraries
Not focused on domain logic.
Code-based vs Zero-code Instrumentation
| Aspect | Code-based Instrumentation | |
| Setup | Manual | Automatic |
| Business Logic | ✅ Yes | ❌ No |
| Setup speed | Slower | Very fast |
| Customization | High | Limited |
Why Combine Them?
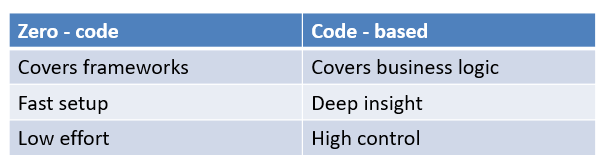
Zero-code instrumentation provides quick, framework-level visibility, while code-based instrumentation delivers deep, business-specific insights—together they form complete observability.
Library Instrumentation
What is Library Instrumentation?
• Instrumentation built inside libraries using OpenTelemetry APIs
• Libraries emit traces, metrics, and logs automatically
• Users don’t need to add custom hooks or logging
Why It Matters
• Better observability by default
• Consistent telemetry across applications
• Improved developer experience
Key Benefits
• Correlated library + application telemetry
• Standardized data across languages & tools
• No dependency on custom logging frameworks
Best Practices for Library Instrumentation
Follow Semantic Conventions
• Use standard span names & attributes
• Enables consistency across tools and vendors
• Makes telemetry easy to understand and query
Instrument What Users Care About
• Public APIs & logical operations
• Long-running or failure-prone actions
• Avoid duplicating auto-instrumented network calls
Important Guidelines
• Libraries should depend only on OpenTelemetry API
• Use spans for logic, logs/events for verbosity
• Avoid over-instrumentation
OpenTelemetry Instrumentation Flow
Application → OTel API/Agent → OTel SDK → Collector → Backends (Jaeger / Prometheus / Grafana)
Real-world Use Cases
• Debugging production issues
• Performance monitoring
• Root cause analysis
• Microservices visibility
• User experience improvement
• Capacity planning
• QA & testing support
• Third-party dependency monitoring
Challenges and Best Practices
Challenges
• Data noise
• Performance overhead
• Lack of business context
• Maintenance effort
Best Practices
• Start with auto-instrumentation
• Focus on critical paths
• Use sampling
• Add business context
Conclusion
What We Learned
• Instrumentation is essential for observability
• OpenTelemetry standardizes instrumentation
• Telemetry includes:
–Traces
–Metrics
–Logs
Key Points to Remember
• Two instrumentation approaches:
– Zero-code (auto)
– Code-based (manual)
• Zero-code gives fast, broad visibility
• Code-based gives deep, business-level insights
• Best results come from combining both
Good instrumentation turns system behavior into actionable insights, enabling faster debugging, better performance, and reliable applications.