In this tutorial I am going to demonstrate to setup end to end Monitoring environment using Prometheus AlertManager and Grafana, setup TLS/SSL for alertmanager.

Table of Contents
Prerequisites
You need have one Linux servers installed with internet connectivity. I will be using Ubuntu 18.04 server for this demonstration.
IP – 192.168.56.107
Hostname – ubuntu-server1/ubuntu-server1.example.com
OS version – Ubuntu 18.04.4 LTS
Before we start practical demonstrations lets first understand what are these technologies.
What is Prometheus?
As per official documentation:
Prometheus is an open-source systems monitoring and alerting toolkit originally built at SoundCloud. Since its inception in 2012, many companies and organizations have adopted Prometheus, and the project has a very active developer and user community. It is now a standalone open source project and maintained independently of any company.
Prometheus is a monitoring tool which uses time-series database to record the various real time metrices. It is open-source and written in Go language. The Prometheus metrics are collected using HTTP pulls, allowing for higher performance and scalability.
Main Features of Prometheus
Prometheus’s main features are:
- A multi-dimensional data model with time series data identified by metric name and key/value pairs
- No reliance on distributed storage; single server nodes are autonomous
- Time series collection happens via a pull model over HTTP
- Pushing time series is supported via an intermediary gateway
- Targets are discovered via service discovery or static configuration
- Multiple modes of graphing and dashboarding support
Following are the tools which makes Prometheus complete monitoring solution:
- Exporters: Libraries that help with exporting metrics from third-party systems as Prometheus metrics.
- PromQL: Also known as Prometheus Query Language, this allows you to filter multi-dimensional time series data.
What is AlertManager ?
The Alertmanager handles alerts sent by client applications such as the Prometheus server. It takes care of deduplicating, grouping, and routing them to the correct receiver integrations such as email, PagerDuty, or MS Teams. It also takes care of silencing and inhibition of alerts.
What is Grafana ?
Grafana is open source visualization and analytics software. It allows you to query, visualize, alert on, and explore your metrics no matter where they are stored. In plain English, it provides you with tools to turn your time-series database (TSDB) data into beautiful graphs and visualizations.
Prometheus Installation
Follow the step by step procedure described below to install Prometheus.
Update package repositories
root@ubuntu-server1:~# apt-get update
Install few required packages
root@ubuntu-server1:~# apt-get -y install wget curl vim
Create Prometheus system group
root@ubuntu-server1:~# groupadd --system prometheus
As a Linux user you should know that the GID < 1000 is a system group.
Create Prometheus system user and assign primary group created in last step
root@ubuntu-server1:~# useradd -s /sbin/nologin --system -g prometheus prometheus
Create data & configs directories for Prometheus
Prometheus stores its data on local system. I will need some directory to do the same. We will create this under /var/lib/prometheus.
root@ubuntu-server1:~# mkdir /var/lib/prometheus
Main configuration files of Prometheus will reside under /etc/prometheus/ and it will have some sub-directories as well:
root@ubuntu-server1:~# mkdir -p /etc/prometheus/{rules,rules.d,files_sd}
root@ubuntu-server1:~# cd /etc/prometheus/
root@ubuntu-server1:/etc/prometheus# ls
files_sd  rules  rules.d
Download Prometheus binary
We will be downloading the latest release of Prometheus archive and extract it to get binary files. Latest releases can be found at – Prometheus releases Github page or https://prometheus.io/download/.
root@ubuntu-server1:/opt# wget https://github.com/prometheus/prometheus/releases/download/v2.22.1/prometheus-2.22.1.linux-amd64.tar.gzor to always download without mentioning the exact release/version number use following command –
root@ubuntu-server1:/opt# curl -s https://api.github.com/repos/prometheus/prometheus/releases/latest | grep browser_download_url | grep linux-amd64 | cut -d '"' -f 4 | wget -qi -Extract the Prometheus binary file
root@ubuntu-server1:/opt# tar -xvzf prometheus-2.22.1.linux-amd64.tar.gz

root@ubuntu-server1:/opt# ls
app.py  app.pyc  prometheus-2.22.1.linux-amd64  prometheus-2.22.1.linux-amd64.tar.gz  VBoxGuestAdditions-6.1.10
Move binary files to /usr/local/bin/ directory
root@ubuntu-server1:/opt/prometheus-2.22.1.linux-amd64# ls
console_libraries  consoles  LICENSE  NOTICE  prometheus  prometheus.yml  promtool
root@ubuntu-server1:/opt/prometheus-2.22.1.linux-amd64# mv prometheus promtool /usr/local/bin/
That’s all! You are done with installation.
Verify the installed version
root@ubuntu-server1:~# prometheus --version
prometheus, version 2.22.1 (branch: HEAD, revision: 00f16d1ac3a4c94561e5133b821d8e4d9ef78ec2)
  build user:       root@516b109b1732
  build date:       20201105-14:02:25
  go version:       go1.15.3
  platform:         linux/amd64
Move Prometheus template file and consoles and console_libraries to /etc/prometheus directory:*
root@ubuntu-server1:/opt/prometheus-2.22.1.linux-amd64# mv prometheus.yml /etc/prometheus/prometheus.yml
root@ubuntu-server1:/opt/prometheus-2.22.1.linux-amd64# mv consoles/ console_libraries/ /etc/prometheus/
root@ubuntu-server1:/opt/prometheus-2.22.1.linux-amd64# cd /etc/prometheus/
root@ubuntu-server1:/etc/prometheus# ls
console_libraries  consoles  files_sd  prometheus.yml  rules  rules.d
Prometheus Configuration
It’s time to configure Prometheus. Open and start editing the configuration file for Prometheus – /etc/prometheus/prometheus.yml.
Here is default Prometheus template file. The file is written in YAML format.
root@ubuntu-server1:/etc/prometheus# cat prometheus.yml
# my global config
global:
  scrape_interval:     15s # Set the scrape interval to every 15 seconds. Default is every 1 minute.
  evaluation_interval: 15s # Evaluate rules every 15 seconds. The default is every 1 minute.
  # scrape_timeout is set to the global default (10s).

# Alertmanager configuration
alerting:
  alertmanagers:
  - static_configs:
    - targets:
      # - alertmanager:9093

# Load rules once and periodically evaluate them according to the global 'evaluation_interval'.
rule_files:
  # - "first_rules.yml"
  # - "second_rules.yml"

# A scrape configuration containing exactly one endpoint to scrape:
# Here it's Prometheus itself.
scrape_configs:
  # The job name is added as a label `job=<job_name>` to any timeseries scraped from this config.
  - job_name: 'prometheus'

    # metrics_path defaults to '/metrics'
    # scheme defaults to 'http'.

    static_configs:
    - targets: ['localhost:9090']
This file can be configured as per our requirements. For now we will leave it as is.
Lets now understand the parameters of this file to get a clear cut understanding of Prometheus.
global The global configuration specifies parameters that are valid in all other configuration contexts. They also serve as defaults for other configuration sections.
scrape_configs
A scrape_config section specifies a set of targets and parameters describing how to scrape them. In the general case, one scrape configuration specifies a single job. In advanced configurations, this may change.
Targets may be statically configured via the static_configs parameter or dynamically discovered using one of the supported service-discovery mechanisms.
alerting
Alerting specifies settings related to the Alertmanager.
For now this is enough to cover the default template file. We will explore other parameters later in this tutorial.
Create a Prometheus systemd Service unit file
root@ubuntu-server1:/etc/prometheus# cat /etc/systemd/system/prometheus.service
[Unit]
Description=Prometheus
Documentation=https://prometheus.io/docs/introduction/overview/
Wants=network-online.target
After=network-online.target

[Service]
Type=simple
User=prometheus
Group=prometheus
ExecReload=/bin/kill -HUP $MAINPID
ExecStart=/usr/local/bin/prometheus   --config.file=/etc/prometheus/prometheus.yml   --storage.tsdb.path=/var/lib/prometheus   --web.console.templates=/etc/prometheus/consoles   --web.console.libraries=/etc/prometheus/console_libraries   --web.listen-address=0.0.0.0:9090   --web.external-url=

SyslogIdentifier=prometheus
Restart=always

[Install]
WantedBy=multi-user.target
Change directory permissions
Change the ownership of Prometheus data and config directories to Prometheus system user and group.
root@ubuntu-server1:/etc/prometheus# for i in rules rules.d files_sd; do sudo chown -R prometheus:prometheus /etc/prometheus/${i}; done
root@ubuntu-server1:/etc/prometheus# for i in rules rules.d files_sd; do sudo chmod -R 775 /etc/prometheus/${i}; done
root@ubuntu-server1:/etc/prometheus# chown -R prometheus:prometheus /var/lib/prometheus/
Start Prometheus Service
First reload the systemd daemon:
root@ubuntu-server1:/etc/prometheus# systemctl daemon-reloadStart and enable the service.
root@ubuntu-server1:/etc/prometheus# systemctl start prometheus
root@ubuntu-server1:/etc/prometheus# systemctl enable prometheus
Created symlink /etc/systemd/system/multi-user.target.wants/prometheus.service → /etc/systemd/system/prometheus.service.
Check the status of service running.
root@ubuntu-server1:/etc/prometheus# systemctl status prometheus.service
● prometheus.service - Prometheus
   Loaded: loaded (/etc/systemd/system/prometheus.service; enabled; vendor preset: enabled)
   Active: active (running) since Tue 2020-11-10 10:31:55 UTC; 36s ago
     Docs: https://prometheus.io/docs/introduction/overview/
 Main PID: 13564 (prometheus)
    Tasks: 8 (limit: 2344)
   CGroup: /system.slice/prometheus.service
           └─13564 /usr/local/bin/prometheus --config.file=/etc/prometheus/prometheus.yml --storage.tsdb.path=/var/lib/prometheus --web.console

Nov 10 10:31:55 ubuntu-server1 prometheus[13564]: level=info ts=2020-11-10T10:31:55.421Z caller=head.go:642 component=tsdb msg="Replaying on-di
Nov 10 10:31:55 ubuntu-server1 prometheus[13564]: level=info ts=2020-11-10T10:31:55.421Z caller=head.go:656 component=tsdb msg="On-disk memory
Nov 10 10:31:55 ubuntu-server1 prometheus[13564]: level=info ts=2020-11-10T10:31:55.421Z caller=head.go:662 component=tsdb msg="Replaying WAL,
Nov 10 10:31:55 ubuntu-server1 prometheus[13564]: level=info ts=2020-11-10T10:31:55.421Z caller=head.go:714 component=tsdb msg="WAL segment loa
Nov 10 10:31:55 ubuntu-server1 prometheus[13564]: level=info ts=2020-11-10T10:31:55.421Z caller=head.go:719 component=tsdb msg="WAL replay comp
Nov 10 10:31:55 ubuntu-server1 prometheus[13564]: level=info ts=2020-11-10T10:31:55.422Z caller=main.go:732 fs_type=EXT4_SUPER_MAGIC
Nov 10 10:31:55 ubuntu-server1 prometheus[13564]: level=info ts=2020-11-10T10:31:55.422Z caller=main.go:735 msg="TSDB started"
Nov 10 10:31:55 ubuntu-server1 prometheus[13564]: level=info ts=2020-11-10T10:31:55.422Z caller=main.go:861 msg="Loading configuration file" fi
Nov 10 10:31:55 ubuntu-server1 prometheus[13564]: level=info ts=2020-11-10T10:31:55.423Z caller=main.go:892 msg="Completed loading of configura
Nov 10 10:31:55 ubuntu-server1 prometheus[13564]: level=info ts=2020-11-10T10:31:55.423Z caller=main.go:684 msg="Server is ready to receive web
Enable firewall ports
If your ubuntu server has is configured to use firewall service, you’ll need to open port 9090.
root@ubuntu-server1:/etc/prometheus# ufw allow 9090/tcp
Rules updated
Rules updated (v6)
Access the Prometheus UI at port 9090
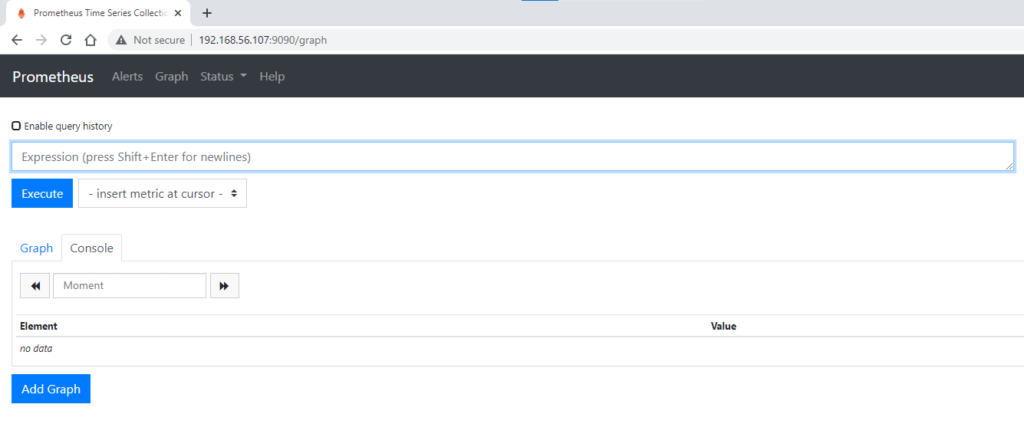
Configure Prometheus with secure reverse proxy
Install nginx and configure it.
root@ubuntu-server1:/etc/prometheus# apt-get install nginx
Now generate self-signed certificates. To do this, log into your server and issue the following command:
root@ubuntu-server1:/etc/nginx/ssl# openssl req -x509 -nodes -days 365 -newkey rsa:2048 -keyout /etc/nginx/ssl/ubuntu-server1.key -out /etc/nginx/ssl/ubuntu-server1.pem
Can't load /root/.rnd into RNG
140342748676544:error:2406F079:random number generator:RAND_load_file:Cannot open file:../crypto/rand/randfile.c:88:Filename=/root/.rnd
Generating a RSA private key
..............................................+++++
.................................+++++
writing new private key to '/etc/nginx/ssl/ubuntu-server1.key'
-----
You are about to be asked to enter information that will be incorporated
into your certificate request.
What you are about to enter is what is called a Distinguished Name or a DN.
There are quite a few fields but you can leave some blank
For some fields there will be a default value,
If you enter '.', the field will be left blank.
-----
Country Name (2 letter code) [AU]:IN
State or Province Name (full name) [Some-State]:Karnataka
Locality Name (eg, city) []:Bangalore
Organization Name (eg, company) [Internet Widgits Pty Ltd]:Fosstechnix
Organizational Unit Name (eg, section) []:DevOps
Common Name (e.g. server FQDN or YOUR name) []:ubuntu-server1
Email Address []:
Create nginx configuration file for Prometheus.
root@ubuntu-server1:/etc/nginx/sites-enabled# pwd
/etc/nginx/sites-enabled

root@ubuntu-server1:/etc/nginx/sites-enabled# cat ubuntu-server1.conf
upstream ubuntu-server1 {
server localhost:9090;
}
server {
server_name ubuntu-server1.example.com;
listen 80;
access_log /var/log/nginx/sites/$server_name.http.log;
rewrite ^ https://$server_name$request_uri? permanent;
}
server {
server_name ubuntu-server1.example.com;
listen 443 ssl;
access_log /var/log/nginx/sites/$server_name.https.log;
ssl_certificate /etc/nginx/ssl/ubuntu-server1.pem;
ssl_certificate_key /etc/nginx/ssl/ubuntu-server1.key;
charset utf-8;
client_max_body_size 16m;
keepalive_timeout 70;
client_body_timeout 10;
client_header_timeout 10;
client_header_buffer_size 128;
location / {
proxy_set_header X-Real-IP $remote_addr;
proxy_set_header Host $http_host;
proxy_set_header X-Forwarded-For $proxy_add_x_forwarded_for;
proxy_set_header X-Forwarded-Proto $scheme;
proxy_pass http://ubuntu-server1;
}
}
Update Nginx main configuration file at the end to include files under sites-enabled directory.
root@ubuntu-server1:/etc/nginx/sites-enabled# cat /etc/nginx/nginx.conf
include /etc/nginx/sites-enabled/*.conf;
Allow though ufw
root@ubuntu-server1:/etc/nginx/sites-enabled# ufw allow 'Apache Full'
root@ubuntu-server1:/etc/nginx/sites-enabled# ufw allow 'Apache Secure'

root@ubuntu-server1:/etc/nginx/sites-enabled# ufw status
Status: active

To                         Action      From
--                         ------      ----
9090/tcp                   ALLOW       Anywhere
Apache Full                ALLOW       Anywhere
Apache Secure              ALLOW       Anywhere
9090/tcp (v6)              ALLOW       Anywhere (v6)
Apache Full (v6)           ALLOW       Anywhere (v6)
Apache Secure (v6)         ALLOW       Anywhere (v6)
Verify the Nginx config and restart the service.
root@ubuntu-server1:/etc/nginx/sites-enabled# nginx -t
nginx: the configuration file /etc/nginx/nginx.conf syntax is ok
nginx: configuration file /etc/nginx/nginx.conf test is successful

root@ubuntu-server1:/etc/nginx/sites-enabled# systemctl restart nginx

root@ubuntu-server1:/etc/nginx/sites-enabled# journalctl -f -u nginx.service
-- Logs begin at Thu 2020-04-02 09:59:29 UTC. --
Nov 10 11:09:27 ubuntu-server1 systemd[1]: Started nginx - high performance web server.
Nov 10 11:10:05 ubuntu-server1 systemd[1]: Stopping nginx - high performance web server...
Nov 10 11:10:05 ubuntu-server1 systemd[1]: Stopped nginx - high performance web server.
Nov 10 11:10:05 ubuntu-server1 systemd[1]: Starting nginx - high performance web server...
Nov 10 11:10:05 ubuntu-server1 systemd[1]: Started nginx - high performance web server.
Nov 10 11:15:58 ubuntu-server1 systemd[1]: Stopping nginx - high performance web server...
Nov 10 11:15:58 ubuntu-server1 systemd[1]: Stopped nginx - high performance web server.
Nov 10 11:15:58 ubuntu-server1 systemd[1]: Starting nginx - high performance web server...
Nov 10 11:15:58 ubuntu-server1 systemd[1]: nginx.service: Can't open PID file /var/run/nginx.pid (yet?) after start: No such file or directory
Nov 10 11:15:58 ubuntu-server1 systemd[1]: Started nginx - high performance web server.
Verify on the browser – Access it at https://192.168.56.107/ or https://ubuntu-server1.example.com/
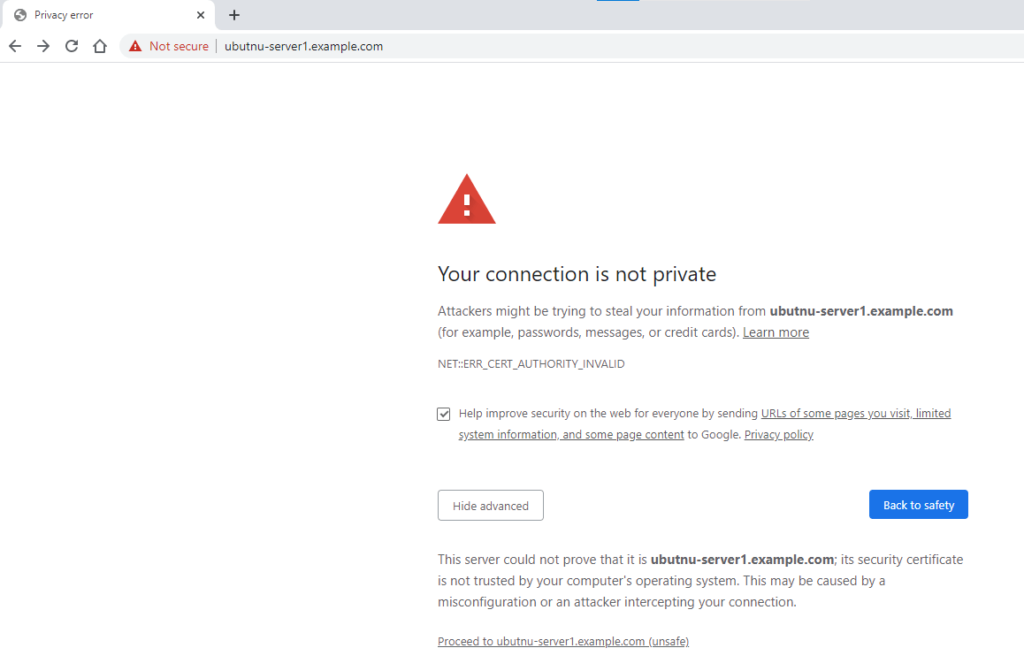
Proceed to access the server.
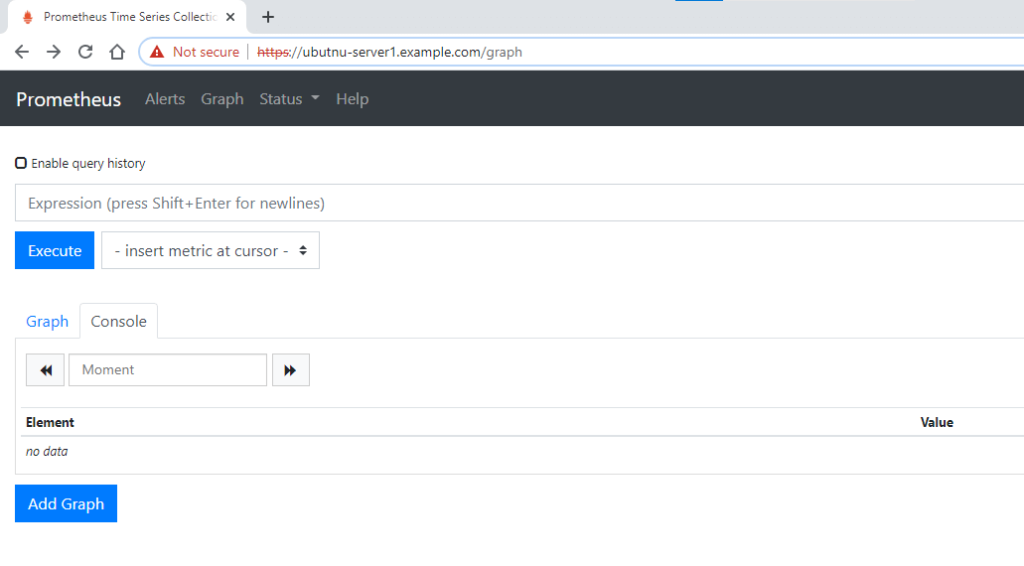
The https icon red out and crossed means it isn’t signed by one of the root CA certificates that the browser implicitly trusts and that’s fine.
Till now we are done with configuring Prometheus.
Install and Configure Alert Manager
In this part, we are going to take a look at the AlertManager installation and configuration with Prometheus.
Alertmanager runs as a standalone server aside from Prometheus though its part of the Prometheus stack.
AlertManager also will be configured as one of the targets with Prometheus configuration and Prometheus will take care of sending alerts directly to the AlertManager.
In case you use different clients then Prometheus itself, the AlertManager exposes a set of REST endpoints that you can use to fire alerts to users via various mediums.
Follow the step by step procedure described below to install AlertManager.
Download the AlertManager
root@ubuntu-server1:/opt# curl -s https://api.github.com/repos/prometheus/alertmanager/releases/latest | grep browser_download_url | grep linux-amd64 | cut -d '"' -f 4 | wget -qi -

root@ubuntu-server1:/opt# ls
alertmanager-0.21.0.linux-amd64.tar.gz  prometheus-2.22.1.linux-amd64.tar.gz  prometheus-2.22.1.linux-amd64
Extract the tarball
root@ubuntu-server1:/opt# tar -xvzf alertmanager-0.21.0.linux-amd64.tar.gzroot@ubuntu-server1:/opt# cd alertmanager-0.21.0.linux-amd64
root@ubuntu-server1:/opt/alertmanager-0.21.0.linux-amd64# ls
alertmanager alertmanager.yml amtool LICENSE NOTICEIn the folder where you extracted your files, you should find the following entries:
- amtool: amtool binary allows you to view or to modify the current state of the AlertManager and helps in silence alerts, expire silences, as well as import silences or query them.
- alertmanager: the executable for the alertmanager. This is the executable that you will run in order to start an AlertManager server on your instance.
- alertmanager.yml: This is the configuration file for the AlertManager and defines some example routes, but I will create our own alert file.
Move binary files to /usr/local/bin/ directory
root@ubuntu-server1:/opt/alertmanager-0.21.0.linux-amd64# mv amtool alertmanager /usr/local/bin/Verify the installed version
root@ubuntu-server1:/opt/alertmanager-0.21.0.linux-amd64# alertmanager --version
alertmanager, version 0.21.0 (branch: HEAD, revision: 4c6c03ebfe21009c546e4d1e9b92c371d67c021d)
  build user:       root@dee35927357f
  build date:       20200617-08:54:02
  go version:       go1.14.4
Alertmanager Configuration
Create a user for our AlertManager service
root@ubuntu-server1:~# useradd -rs /bin/false alertmanagerCreate AlertManager data and config directories
root@ubuntu-server1:~# mkdir -p /etc/alertmanager
root@ubuntu-server1:~# mkdir -p /data/alertmanager
Move AlertManager template config file to config directory created above
root@ubuntu-server1:/opt/alertmanager-0.21.0.linux-amd64# cp alertmanager.yml /etc/alertmanager/Change the ownerships of above directories
root@ubuntu-server1:~# chown -R alertmanager:alertmanager /data/alertmanager /etc/alertmanager/*Create an AlertManager systemd Service unit file
root@ubuntu-server1:/etc/prometheus# cat /etc/systemd/system/alertmanager.service
[Unit]
Description=Alert Manager
Wants=network-online.target
After=network-online.target

[Service]
Type=simple
User=alertmanager
Group=alertmanager
ExecStart=/usr/local/bin/alertmanager \
  --config.file=/etc/alertmanager/alertmanager.yml \
  --storage.path=/data/alertmanager

Restart=always

[Install]
WantedBy=multi-user.target
Start and enable the alertmanager service
root@ubuntu-server1:~# systemctl start alertmanager.service
root@ubuntu-server1:~# systemctl status alertmanager.service
● alertmanager.service - Alert Manager
   Loaded: loaded (/etc/systemd/system/alertmanager.service; enabled; vendor preset: enabled)
   Active: active (running) since Wed 2020-11-11 05:29:46 UTC; 4s ago
 Main PID: 14680 (alertmanager)
    Tasks: 9 (limit: 2344)
   CGroup: /system.slice/alertmanager.service
           └─14680 /usr/local/bin/alertmanager --config.file=/etc/alertmanager/alertmanager.yml --storage.path=/data/alertmanager

Nov 11 05:29:46 ubuntu-server1 systemd[1]: Started Alert Manager.
Nov 11 05:29:46 ubuntu-server1 alertmanager[14680]: level=info ts=2020-11-11T05:29:46.572Z caller=main.go:216 msg="Starting Alertmanager" versi
Nov 11 05:29:46 ubuntu-server1 alertmanager[14680]: level=info ts=2020-11-11T05:29:46.574Z caller=main.go:217 build_context="(go=go1.14.4, user
Nov 11 05:29:46 ubuntu-server1 alertmanager[14680]: level=info ts=2020-11-11T05:29:46.578Z caller=cluster.go:161 component=cluster msg="setting
Nov 11 05:29:46 ubuntu-server1 alertmanager[14680]: level=info ts=2020-11-11T05:29:46.592Z caller=cluster.go:623 component=cluster msg="Waiting
Nov 11 05:29:46 ubuntu-server1 alertmanager[14680]: level=info ts=2020-11-11T05:29:46.614Z caller=coordinator.go:119 component=configuration ms
Nov 11 05:29:46 ubuntu-server1 alertmanager[14680]: level=info ts=2020-11-11T05:29:46.614Z caller=coordinator.go:131 component=configuration ms
Nov 11 05:29:46 ubuntu-server1 alertmanager[14680]: level=info ts=2020-11-11T05:29:46.616Z caller=main.go:485 msg=Listening address=:9093
Nov 11 05:29:48 ubuntu-server1 alertmanager[14680]: level=info ts=2020-11-11T05:29:48.593Z caller=cluster.go:648 component=cluster msg="gossip
root@ubuntu-server1:~# systemctl enable alertmanager
Created symlink /etc/systemd/system/multi-user.target.wants/alertmanager.service → /etc/systemd/system/alertmanager.service.Configure AlertManager with secure reverse proxy
Creating proxy configuration file for alertmanager
root@ubuntu-server1:/etc/nginx/sites-enabled# touch alertmanager.conf
Generate self-signed certificates
This time we will use another method (with certtool) to create self signed certs.
root@ubuntu-server1:/etc/nginx/ssl# apt-get install gnutls-binroot@ubuntu-server1:/etc/nginx/ssl# certtool --generate-self-signed --load-privkey alertmanager-private-key.pem --outfile alertmanager-cert.pemGenerating a self signed certificate...
Please enter the details of the certificate's distinguished name. Just press enter to ignore a field.
Common name: Alertmanager cert
UID:
Organizational unit name: DevOps
Organization name: Fosstechnix
Locality name: Bangalore
State or province name: Karnataka
Country name (2 chars): IN
Enter the subject's domain component (DC):
This field should not be used in new certificates.
E-mail:
Enter the certificate's serial number in decimal (default: 6893737989104015219):
Activation/Expiration time.
The certificate will expire in (days): 3650
Extensions.
Does the certificate belong to an authority? (y/N): y
Will the certificate be used to sign other certificates? (y/N): y
Will the certificate be used to sign CRLs? (y/N): y
Is the above information ok? (y/N): y
Signing certificate...
root@ubuntu-server1:/etc/nginx/ssl# ls
alertmanager-cert.pem alertmanager-private-key.pem ubuntu-server1.key ubuntu-server1.pemConfigure Nginx file
root@ubuntu-server1:/etc/nginx/sites-enabled# cat alertmanager.conf
upstream ubuntu-server1.example.com {
server localhost:9093;
}

server {
server_name ubuntu-server1.example.com;
listen 3456 ssl;
ssl_certificate /etc/nginx/ssl/alertmanager-cert.pem;
ssl_certificate_key /etc/nginx/ssl/alertmanager-private-key.pem;
charset utf-8;
client_max_body_size 16m;
keepalive_timeout 70;
client_body_timeout 10;
client_header_timeout 10;
client_header_buffer_size 128;
location / {
proxy_set_header X-Real-IP $remote_addr;
proxy_set_header Host $http_host;
proxy_set_header X-Forwarded-For $proxy_add_x_forwarded_for;
proxy_set_header X-Forwarded-Proto $scheme;
proxy_pass http://ubuntu-server1.example.com;
}
}
Test nginx configuration and restart the service
root@ubuntu-server1:/etc/nginx/sites-enabled# nginx -t
nginx: the configuration file /etc/nginx/nginx.conf syntax is ok
nginx: configuration file /etc/nginx/nginx.conf test is successful

root@ubuntu-server1:/etc/nginx/sites-enabled# systemctl restart nginx

root@ubuntu-server1:/etc/nginx/sites-enabled# journalctl -f -u nginx.service
Configure firewall to allow connections on port 3456/9093
root@ubuntu-server1:/etc/nginx/sites-enabled# ufw allow 3456
Rule added
Rule added (v6)
root@ubuntu-server1:/etc/nginx/sites-enabled# ufw allow 9093
Rule added
Rule added (v6)
Modify alertmanager service
Add the following parameter – –web.external-url=https://localhost:3456
root@ubuntu-server1:/etc/nginx/sites-enabled# cat /etc/systemd/system/alertmanager.service
[Unit]
Description=Alert Manager
Wants=network-online.target
After=network-online.target

[Service]
Type=simple
User=alertmanager
Group=alertmanager
ExecStart=/usr/local/bin/alertmanager \
  --config.file=/etc/alertmanager/alertmanager.yml \
  --storage.path=/data/alertmanager \
  --web.external-url=https://localhost:3456

Restart=always

[Install]
WantedBy=multi-user.target
Reload the systemd daemon and restart alertmanager service
root@ubuntu-server1:/etc/nginx/sites-enabled# systemctl daemon-reload
root@ubuntu-server1:/etc/nginx/sites-enabled# systemctl restart alertmanager
root@ubuntu-server1:/etc/nginx/sites-enabled# cat /var/log/syslog | grep -i alert
Nov 11 05:29:46 ubuntu-server1 systemd[1]: Started Alert Manager.Verify the access
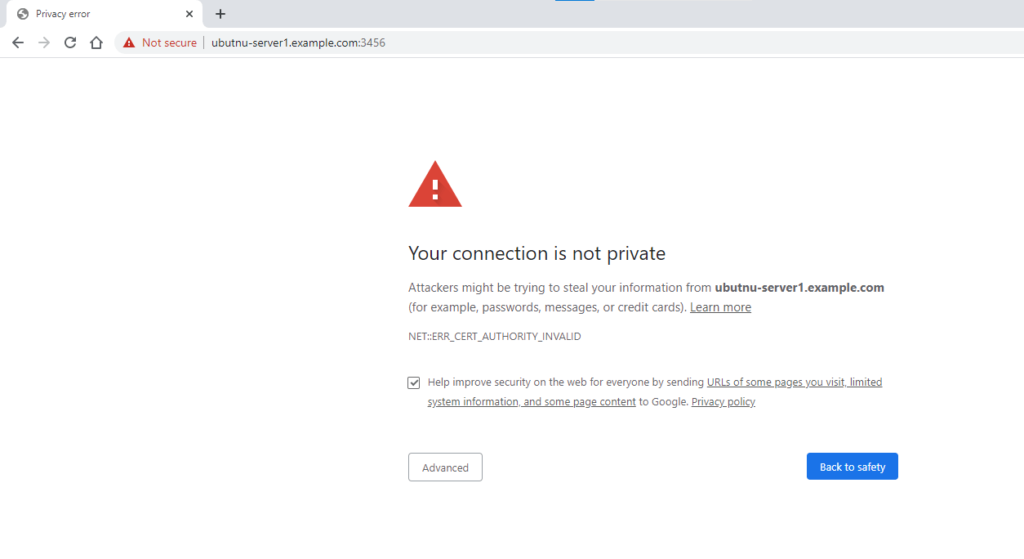
Go to advanced and proceed with https url.
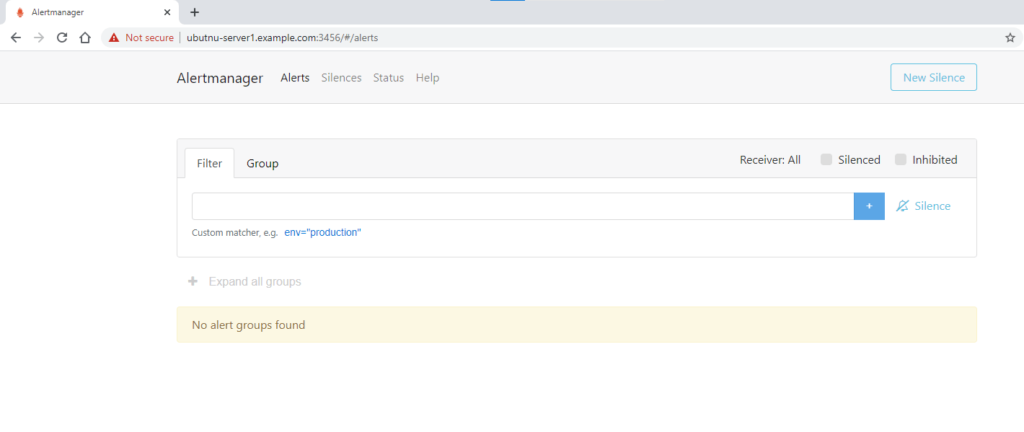
Great! Its working as expected and we are able to access the AlertManager UI.
Binding AlertManager with Prometheus
It’s time to bind AlertManager with Prometheus to do that go to your Prometheus configuration directory, and make following changes in /etc/prometheus/prometheus.yml file.
# Alertmanager configuration
alerting:
  alertmanagers:
  - scheme: https
    static_configs:
    - targets:
       - ubuntu-server1.example.com
Restart Prometheus server and verify if everything is working fine.
root@ubuntu-server1:/etc/prometheus# systemctl restart prometheus.serviceMonitor alertmanager instance (in Our case its on the same host) with prometheus
Update prometheus.yml file and add following section of code under scrape_configs:
- file_sd_configs:
    - files:
      - /etc/prometheus/files_sd/alertmanager.yml
    job_name: alertmanager
Here we have introduced another Prometheus config file parameter that is file_sd_configs. Lets understand that.
file_sd_config
File-based service discovery provides a more generic way to configure static targets and serves as an interface to plug in custom service discovery mechanisms.
It reads a set of files containing a list of zero or more <static_config>s. Changes to all defined files are detected via disk watches and applied immediately. Files may be provided in YAML or JSON format. Only changes resulting in well-formed target groups are applied.
Create alertmanager.yml target file under files_sd directory
root@ubuntu-server1:/etc/prometheus/files_sd# ls
alertmanager.yml
root@ubuntu-server1:/etc/prometheus/files_sd# cat alertmanager.yml
- targets:
  - ubuntu-server1.example.com:9093
Restart the Prometheus service
root@ubuntu-server1:/etc/prometheus# systemctl restart prometheus.service
Verify the status over UI
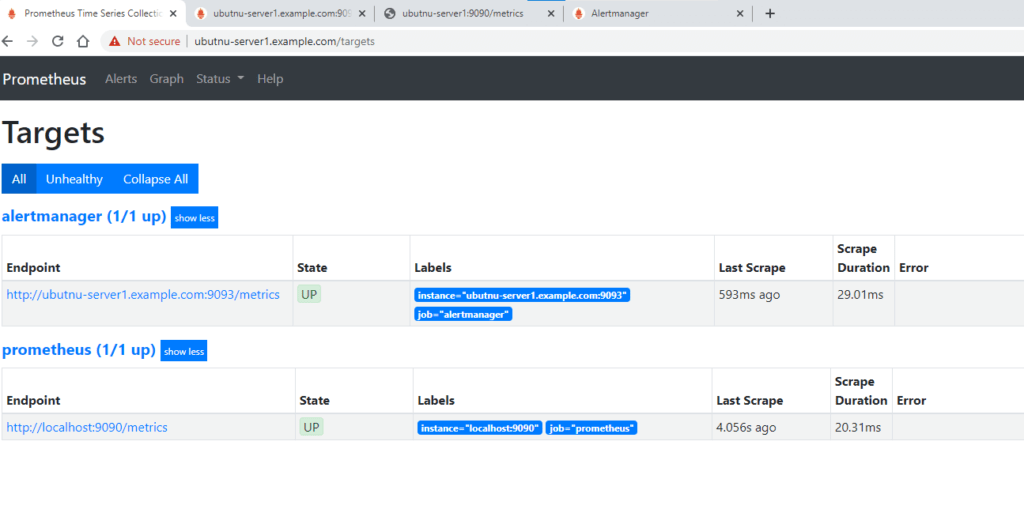
We can clearly see a new target has been added to our monitoring list.
Verify the metrices scrapped
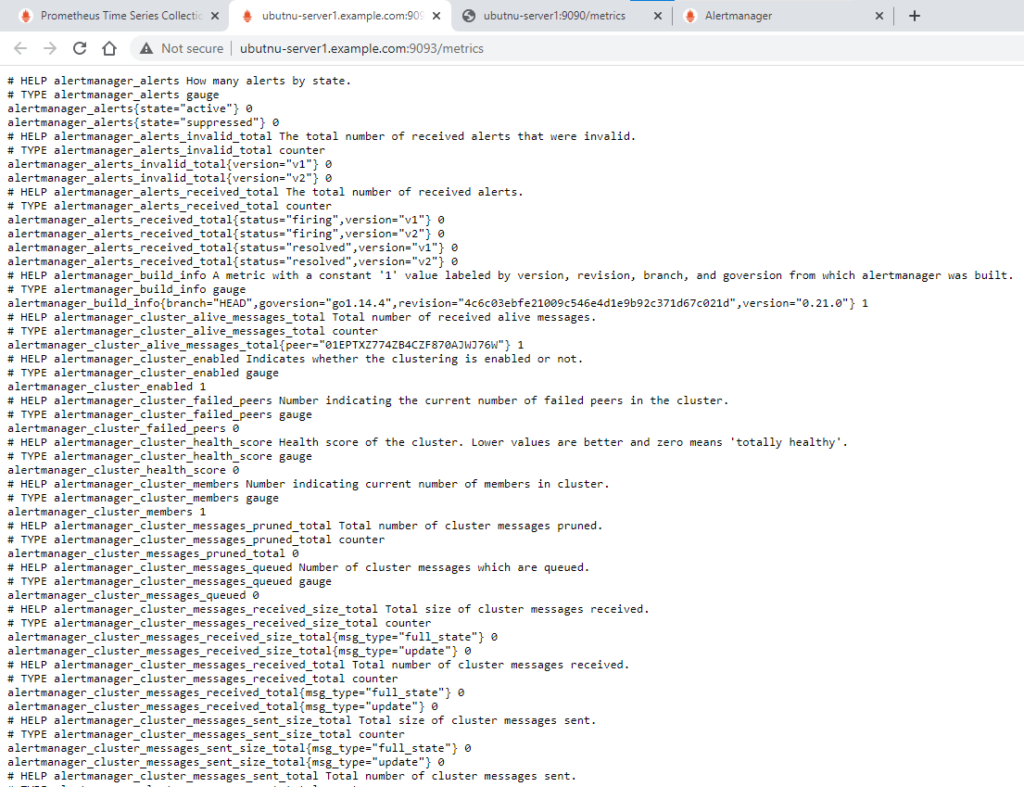
Till now we are done with setting up the AlertManager with Prometheus.
Install and Configure Grafana
Follow the step by step procedure described below to install Grafana.
Update the package repo
root@ubuntu-server1:~# apt-get update
root@ubuntu-server1:~# apt-get install -y apt-transport-https
root@ubuntu-server1:~# apt-get install -y software-properties-common wget
Add the gpg key to install signed packages
root@ubuntu-server1:~# wget -q -O - https://packages.grafana.com/gpg.key | apt-key add -
OK
Add this repository for stable releases:
For OSS release –
root@ubuntu-server1:~# echo "deb https://packages.grafana.com/oss/deb stable main" | sudo tee -a /etc/apt/sources.list.d/grafana.list
deb https://packages.grafana.com/oss/deb stable main
For Enterprise version –
root@ubuntu-server1:~# echo "deb https://packages.grafana.com/enterprise/deb stable main" | sudo tee -a /etc/apt/sources.list.d/grafana.list
deb https://packages.grafana.com/enterprise/deb stable main
Update repositories again and install Grafana
root@ubuntu-server1:~# apt-get update
root@ubuntu-server1:~# apt-get install grafana -y
Verify the version
root@ubuntu-server1:~# grafana-server -v
Version 7.3.1 (commit: 6668161a88, branch: HEAD)
Verify the Grafana systemd service file
root@ubuntu-server1:~# cat /usr/lib/systemd/system/grafana-server.service
[Unit]
Description=Grafana instance
Documentation=http://docs.grafana.org
Wants=network-online.target
After=network-online.target
After=postgresql.service mariadb.service mysql.service

[Service]
EnvironmentFile=/etc/default/grafana-server
User=grafana
Group=grafana
Type=simple
Restart=on-failure
WorkingDirectory=/usr/share/grafana
RuntimeDirectory=grafana
RuntimeDirectoryMode=0750
ExecStart=/usr/sbin/grafana-server                                                  \
                            --config=${CONF_FILE}                                   \
                            --pidfile=${PID_FILE_DIR}/grafana-server.pid            \
                            --packaging=deb                                         \
                            cfg:default.paths.logs=${LOG_DIR}                       \
                            cfg:default.paths.data=${DATA_DIR}                      \
                            cfg:default.paths.plugins=${PLUGINS_DIR}                \
                            cfg:default.paths.provisioning=${PROVISIONING_CFG_DIR}


LimitNOFILE=10000
TimeoutStopSec=20
UMask=0027

[Install]
WantedBy=multi-user.target
Understand this file a bit more.
- The Grafana server binary is available at /usr/sbin/grafana-server.
- Environment variables file is located at /etc/default/grafana-server
- CONF_FILE environment variable mention the config file.
- The PID of the file is also determined by the PID_FILE_DIR environment variable.
- Logging, data, plugins and provisioning paths are given by environment variables.
Enable and Start Grafana service
root@ubuntu-server1:~# systemctl enable grafana-server
Synchronizing state of grafana-server.service with SysV service script with /lib/systemd/systemd-sysv-install.
Executing: /lib/systemd/systemd-sysv-install enable grafana-server
Created symlink /etc/systemd/system/multi-user.target.wants/grafana-server.service → /usr/lib/systemd/system/grafana-server.service.

root@ubuntu-server1:~# systemctl start grafana-server

root@ubuntu-server1:~# systemctl status grafana-server
● grafana-server.service - Grafana instance
   Loaded: loaded (/usr/lib/systemd/system/grafana-server.service; enabled; vendor preset: enabled)
   Active: active (running) since Wed 2020-11-11 07:06:47 UTC; 4s ago
     Docs: http://docs.grafana.org
 Main PID: 18505 (grafana-server)
    Tasks: 8 (limit: 2344)
   CGroup: /system.slice/grafana-server.service
           └─18505 /usr/sbin/grafana-server --config=/etc/grafana/grafana.ini --pidfile=/var/run/grafana/grafana-server.pid --packaging=deb cfg

Nov 11 07:06:51 ubuntu-server1 grafana-server[18505]: t=2020-11-11T07:06:51+0000 lvl=info msg="Executing migration" logger=migrator id="create
Nov 11 07:06:51 ubuntu-server1 grafana-server[18505]: t=2020-11-11T07:06:51+0000 lvl=info msg="Executing migration" logger=migrator id="add uni
Nov 11 07:06:51 ubuntu-server1 grafana-server[18505]: t=2020-11-11T07:06:51+0000 lvl=info msg="Executing migration" logger=migrator id="add uni
Nov 11 07:06:51 ubuntu-server1 grafana-server[18505]: t=2020-11-11T07:06:51+0000 lvl=info msg="Executing migration" logger=migrator id="add ind
Nov 11 07:06:51 ubuntu-server1 grafana-server[18505]: t=2020-11-11T07:06:51+0000 lvl=info msg="Executing migration" logger=migrator id="create
Nov 11 07:06:51 ubuntu-server1 grafana-server[18505]: t=2020-11-11T07:06:51+0000 lvl=info msg="Executing migration" logger=migrator id="add uni
Nov 11 07:06:51 ubuntu-server1 grafana-server[18505]: t=2020-11-11T07:06:51+0000 lvl=info msg="Executing migration" logger=migrator id="create
Nov 11 07:06:51 ubuntu-server1 grafana-server[18505]: t=2020-11-11T07:06:51+0000 lvl=info msg="Executing migration" logger=migrator id="add ind
Nov 11 07:06:52 ubuntu-server1 grafana-server[18505]: t=2020-11-11T07:06:52+0000 lvl=info msg="Created default admin" logger=sqlstore user=admi
Nov 11 07:06:52 ubuntu-server1 grafana-server[18505]: t=2020-11-11T07:06:52+0000 lvl=info msg="Starting plugin search" logger=plugins
Allow firewall to access port 3000
root@ubuntu-server1:~# ufw allow 3000
Rule added
Rule added (v6)
Verify the GUI for Grafana
Open the url in browser – http://ubuntu-server1.example.com:3000/login
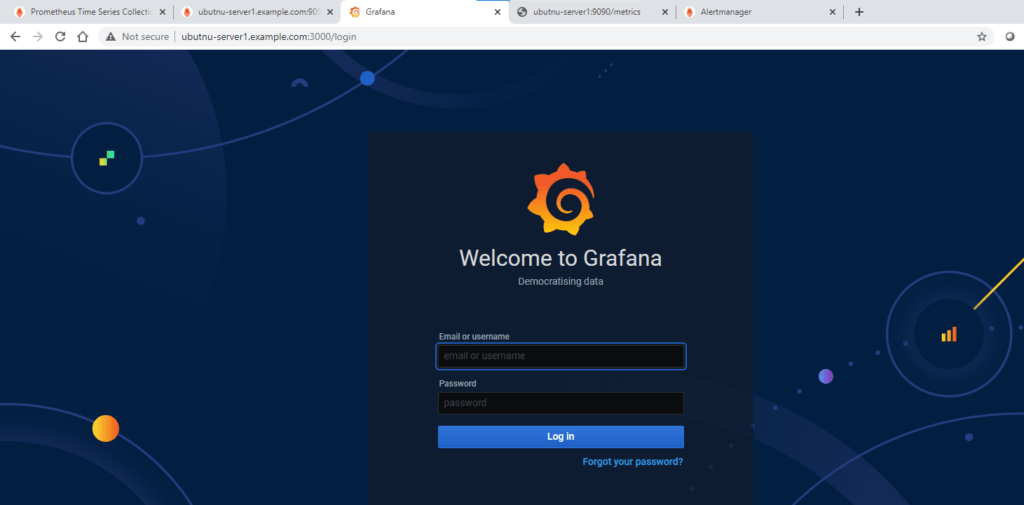
NOTE: The default login for Grafana is ‘admin’ and the default password is also ‘admin’.
After inserting those credentials, you will be asked to change your password.
Add Prometheus Data Source
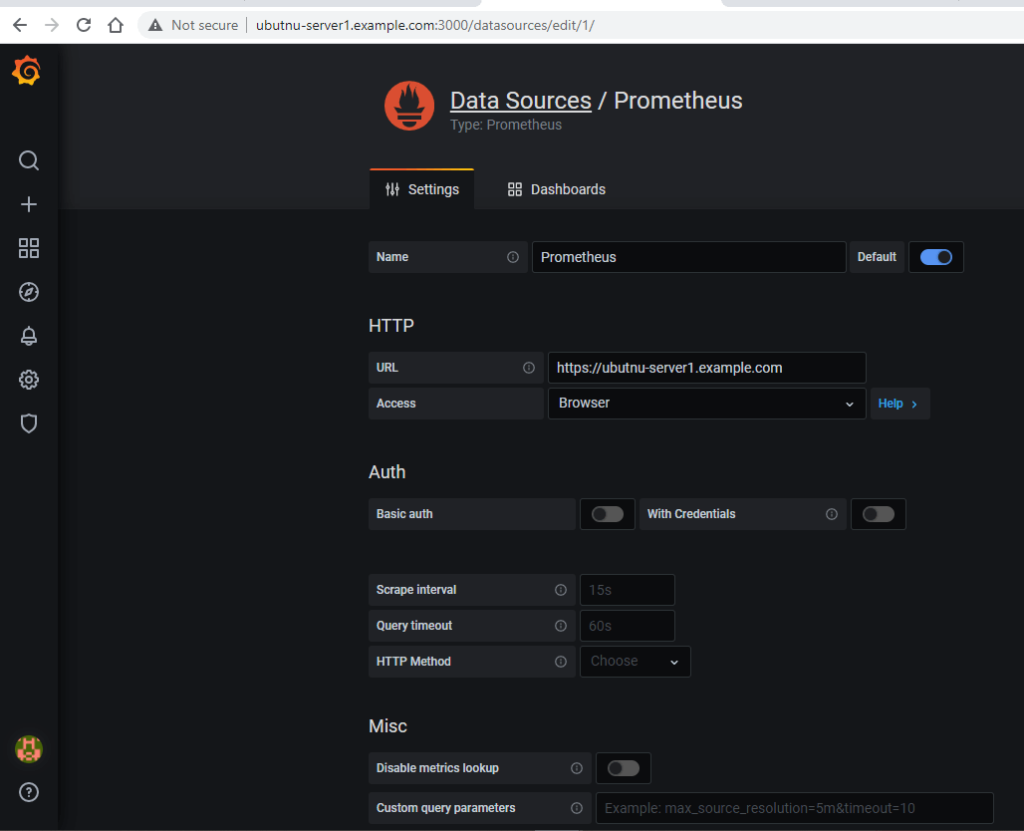
So now that your Grafana server is up and running, you can start playing with it by adding/creating different dashboards.
Lets import some default sample dashboards and visualize the data we are getting from Prometheus server.
We will be importing following two dashboards.
https://grafana.com/grafana/dashboards/3662https://grafana.com/grafana/dashboards/2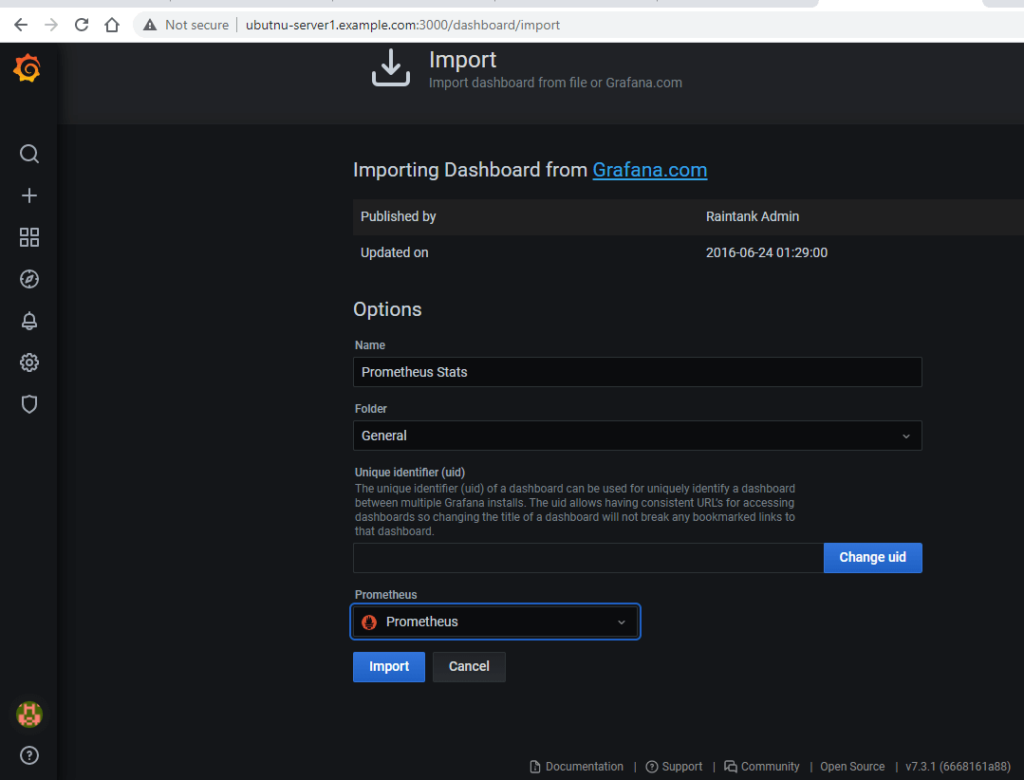
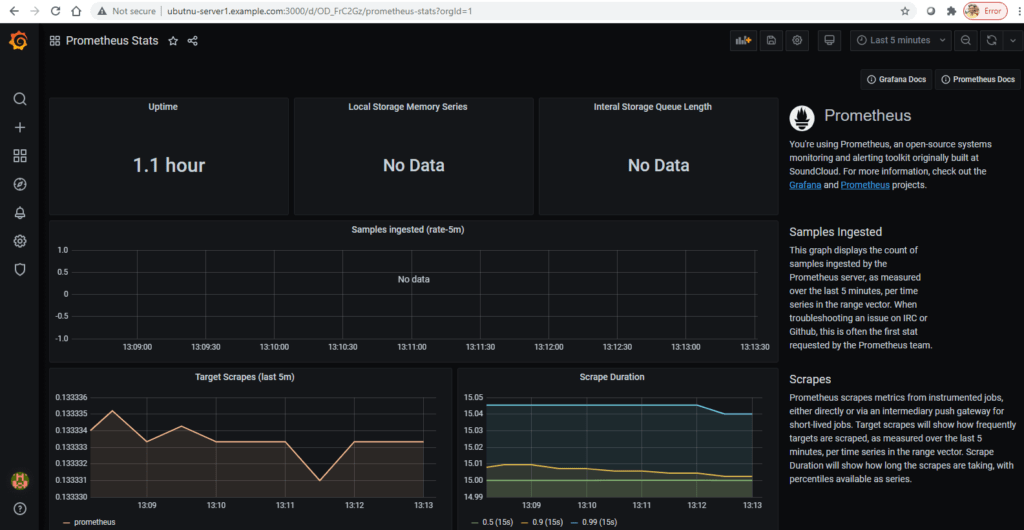
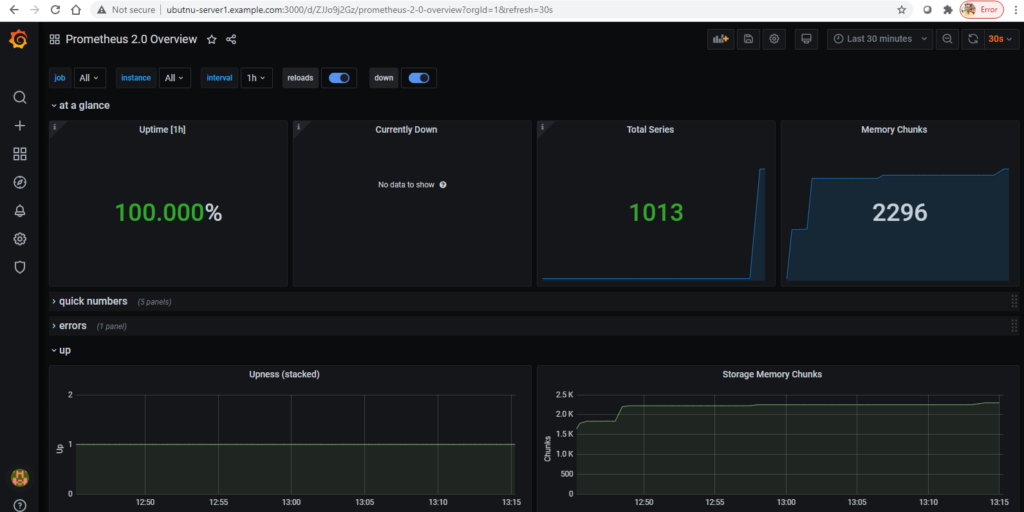
With 3662 dashboard ID Overview of metrics from Prometheus 2.0. Useful for using prometheus to monitor your prometheus.
More dashboards can be found here – https://grafana.com/grafana/dashboards
That’s all!
It’s a bit lengthy article. Isn’t it! But that covers end to end concepts and tools when it comes to monitoring.
In coming articles I will cover how we can monitor Windows servers, Applications, Databases with different Prometheus exporters.
I hope you like the article.
Please let us know your feedback below in the comment section.
Related Articles:
Kubernetes cluster Monitoring with Prometheus and Grafana
Reference:
That’s great documentation. I’m planning to implement this monitoring using this. Thanks for building such a good document during your busy schedule.
Thanks