In this article we are going to learn Prometheus PromQL(Prometheus Query Language) Tutorial with examples,Prometheus Data Types, Prometheus selectors and matchers , Prometheus comparison binary operators.
Table of Contents
What is Prometheus PromQL(Prometheus Query language)
PromQL is a query language for Prometheus monitoring system. It is designed for building powerful yet simple queries for graphs, alerts or derived time series.
PromQL is the querying language that is part of Prometheus. In addition to PromQL, Prometheus provides a scraper that fetches metrics from instances (any application providing metrics) and a time series database, which stores these metrics over time.
The result of an expression can either be shown as a graph, viewed as tabular data in Prometheus’s expression browser, or consumed by external systems via the HTTP API.
Here we can run the expressions
#1.Data Types of PromQL
PromQL uses four data types
- Scalar
- Range vector
- Instant vector
- String
Let’s understand one by one with examples
Scalar : The expressions resulting in a single constant numeric floating number is scalar.
e.g, 11.99
String: The expressions whose output is a string literal is a part of this category. It is currently unused in Prometheus.
e.g, welcome
Instant vectors: These vectors have a single value corresponding to each timestamp in the time series.
Now you can run the below expression on your expression browser
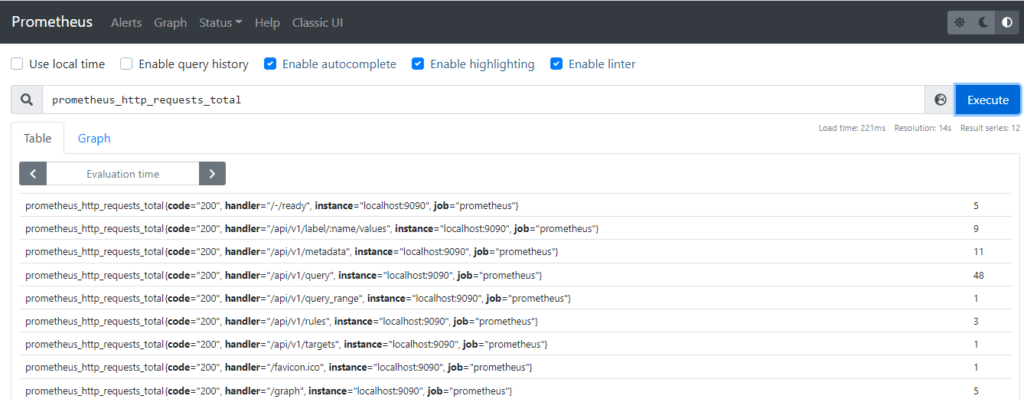
E.g, prometheus_http_requests_total
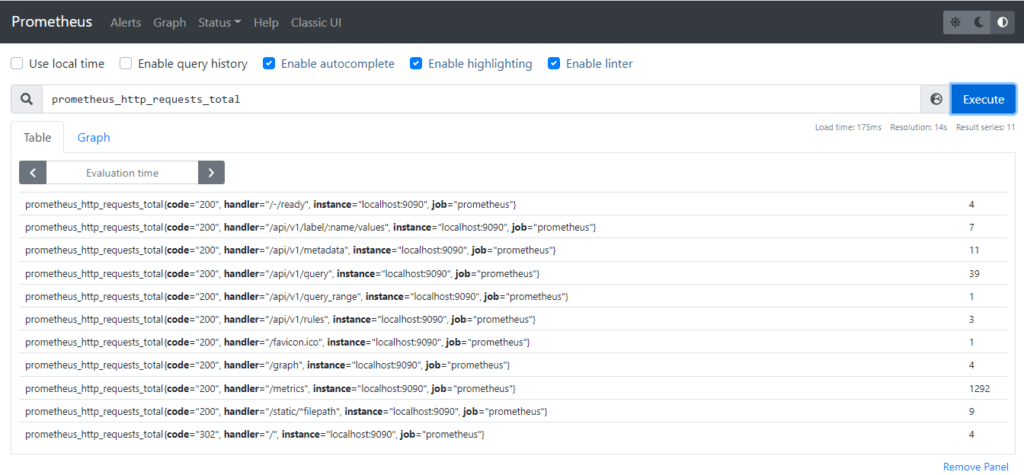
So you can see above image it has return all the time series with the name prometheus_http_request_total and it has return one value of the given time series.
Range Vectors: These vectors have a list of values corresponding to each timestamp in the time series.
Now you can run the below expression on your expression browser
E.g, prometheus_http_requests_total[1m]
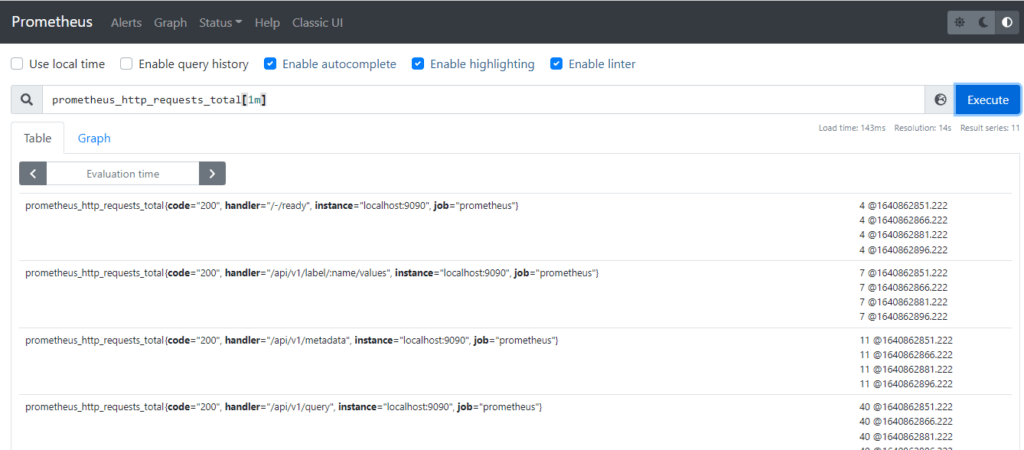
You can see in the above image Range vector can return many samples for each time series. We have four samples for each time series
Time durations are specified as a number, followed immediately by one of the following units:
- ms – milliseconds
- s – seconds
- m – minutes
- h – hours
- d – days – assuming a day has always 24h
- w – weeks – assuming a week has always 7d
- y – years – assuming a year has always 365d
#2.Prometheus Selectors and Matchers
What are Selectors in Prometheus?
Selectors help users to narrow down the results of an expression. For example, prometheus_http_requests_total{handler=”/alerts”} is a selector.
In PromQL there are four types of Matchers
- Equality matcher(=)
- Negative Equality matcher(!=)
- Regular expression matcher(=~)
- Negative Regular expression matcher(!~)
Lets understand one by on with examples
Firstly we will run new expression
process_cpu_seconds_total
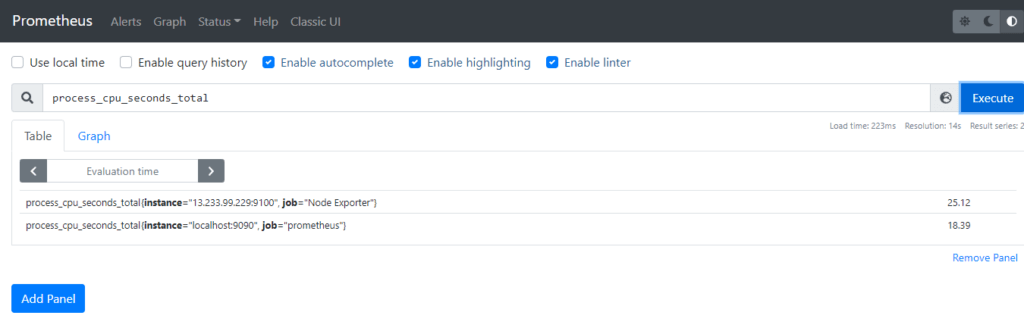
You can see in the above image this expression returns total user and system cpu time on execution. It will return all the time series.
Equality matcher (=) :
Select labels that are exactly equal to the provided string. And it is case sensitive.
Suppose if you are working on any specific target like node exporter and you don’t want to see the metric coming from any target job other than node exporter.
And here we have only 2 target jobs and in real time use cases there are a number of unwanted time series.
In that situation you will always want to narrow down the time series. And you want to see only those instances which you are working on
For filtering time series job node exporter so the query like this
e.g, process_cpu_seconds_total{job="Node Exporter"}
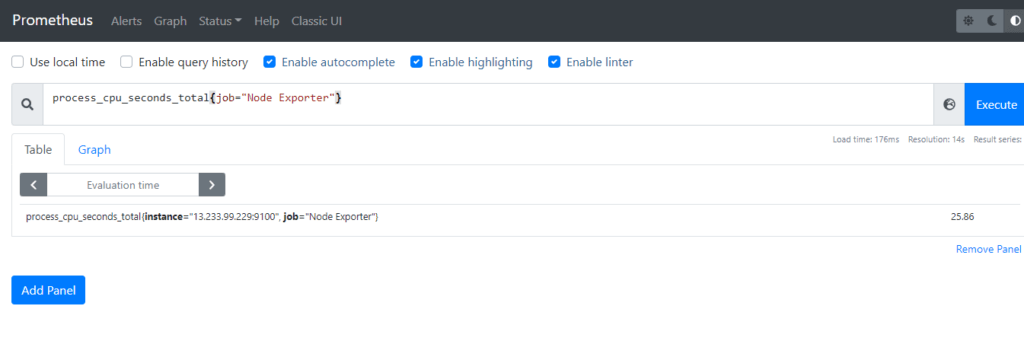
As you can see here only node exporter series show
Negative Equality matcher (!=) :
Select labels that are not equal to the provided string.
In easy language it means if you don’t want to see any specific time series
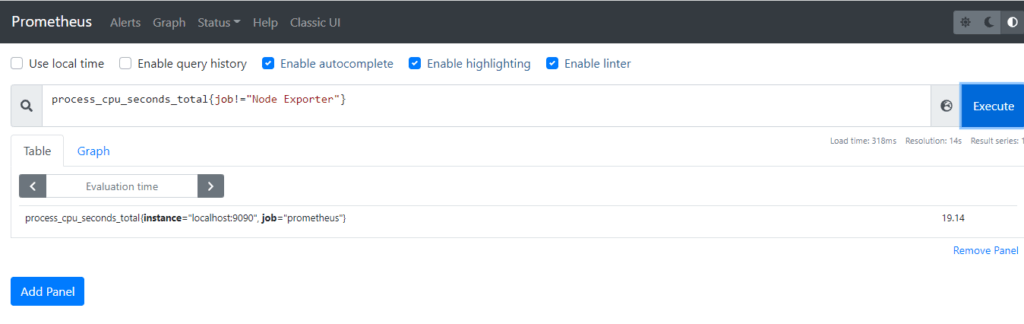
e.g, process_cpu_seconds_total{job!="Node Exporter"}
Here we have only 2 jobs so now I don’t wants to see node exporter series
Regular expression matcher (=~) :
Select labels that regex-match the provided string.
e.g, prometheus_http_requests_total{handler=~"/api.*"}
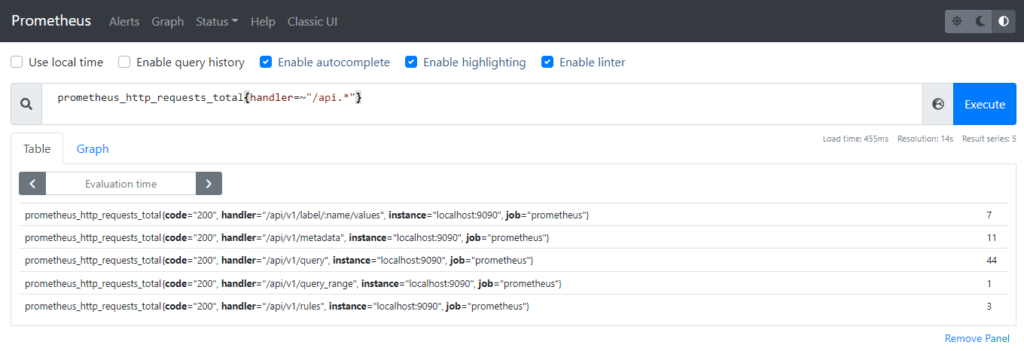
Here .* for after /api there can be any laters
We got an output whose label handle starts with api{handler=~”/api.*”}
Negative Regular expression matcher (!~) :
Select labels that do not regex-match the provided string.
e.g, prometheus_http_requests_total{handler!~"/api.*"}
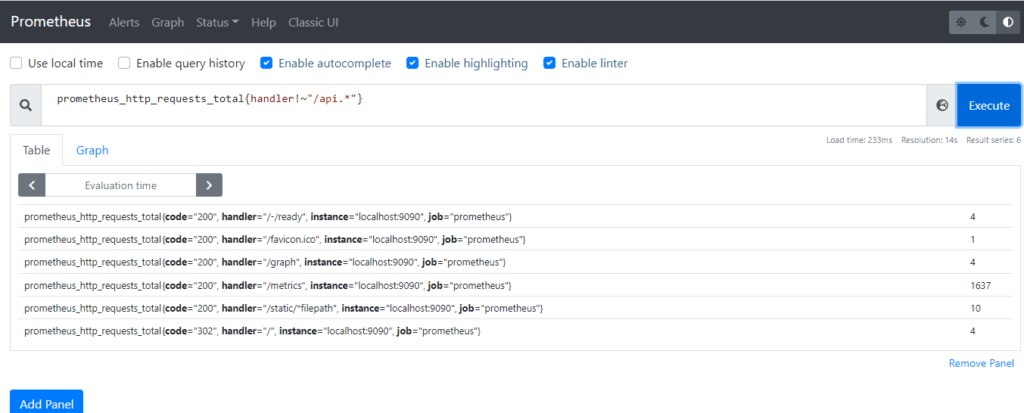
This matcher is totally opposite of Regular expression matcher
And there is no any time series starts with api
#3.Prometheus Operators in PromQL
- Binary Operators
- Aggregation operators
Binary Operators:
Binary Operators are the operators that take two operands and performs the specified calculations on them.
Types of Binary Operators
There are three types of Binary Operators
- Arithmetic binary operators
- Comparison binary operators
- Logical/set binary operators
Arithmetic binary operators
Arithmetic operators are the symbols that represent arithmetic math operations.
The following binary arithmetic operators exist in Prometheus:
- + (addition)
- – (subtraction)
- * (multiplication)
- / (division)
- % (modulo)
- ^ (power/exponentiation)
Binary arithmetic operators are defined between scalar/scalar, vector/scalar, and vector/vector value pairs.
e.g, prometheus_http_requests_total*2
This is a valid example of arithmetic operators between vector data type and scalar data type where prometheus_http_requests_total is vector type and 2 is a scalar.
Before multiply by 2
It is giving this many time series when I multiply this instance vector with 2. And it will multiply all the sample values with 2.
After multiplied by 2
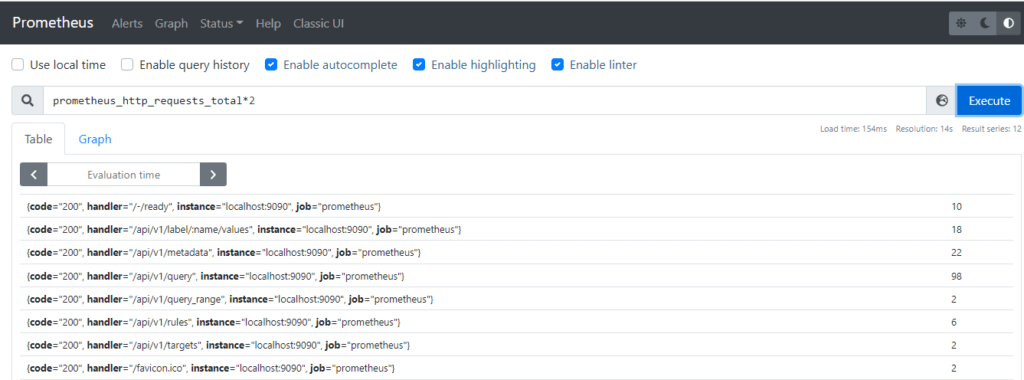
You can use the remaining arithmetical operation in same way.
Prometheus Comparison binary operators
A Comparison operator is a mathematical symbol which is used for comparison
The following binary comparison operators exist in Prometheus:
- == (equal)
- != (not-equal)
- > (greater-than)
- < (less-than)
- >= (greater-or-equal)
- <= (less-or-equal)
Comparison operators are defined between scalar/scalar, vector/scalar, and vector/vector value pairs.
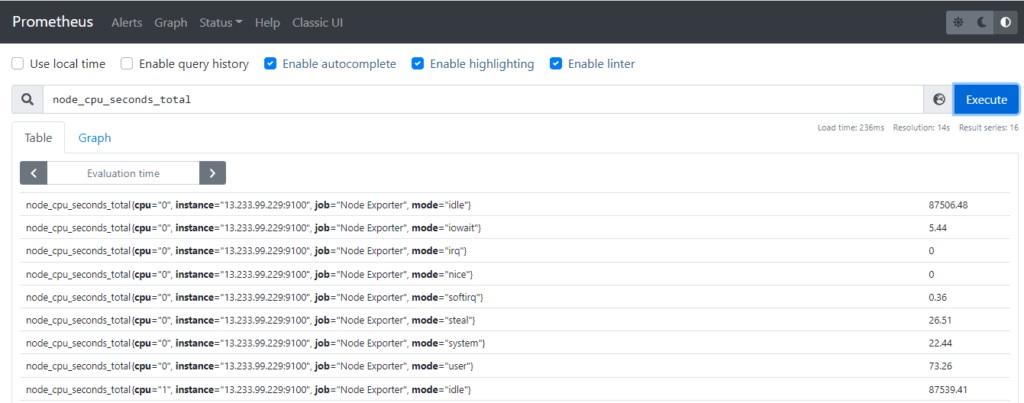
e.g, node_cpu_seconds_total>300
This many time series are giving me time that my CPU spends in each many different mode
Before performing Comparison Operator
Now suppose if you want to get the data in which CPU spending more than 300 sec so for you can use comparison operators like this
e.g, node_cpu_seconds_total>300
After performing comparison operator
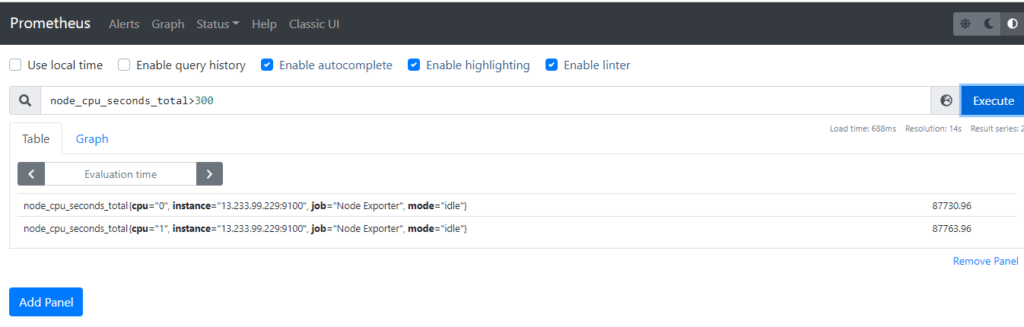
Here we got time series CPU spends more than 300 sec
This comparison operator is used for alert rules so you can generate alerts.
Prometheus Logical/Set Binary Operators:
The logical operators are used to combine simple relational expressions into more complex expressions.
It is only define instant vector
These logical/set binary operators are only defined between instant vectors:
- and (intersection)
- or (union)
- unless (complement)
e.g, vector 1 and vector 2, vector 1 or vector 2, vector 1 unless vector 2
Here let me run two expressions here
prometheus_http_request_total and node_cpu_seconds_total

In this you can see no data because and operator while vector to vector matching.
And here you can see there is no matching.
On execution it will check labels and values of left side and it different so thet’s why there is no data
And it returns a matching time series on the left side.
prometheus_http_request_total or node_cpu_seconds_total

Now for or operator
This operator returns all the non-matching elements of both left or right sides or matching elements of the left side.
Prometheus Aggregation Operators
Aggregation operators calculate mathematical values over a time range.
Types of Aggregation operators :
- sum (calculate sum over dimensions)
- min (select minimum over dimensions)
- max (select maximum over dimensions)
- avg (calculate the average over dimensions)
- group (all values in the resulting vector are 1)
- stddev (calculate population standard deviation over dimensions)
- stdvar (calculate population standard variance over dimensions)
- count (count number of elements in the vector)
- count_values (count number of elements with the same value)
- bottomk (smallest k elements by sample value)
- topk (largest k elements by sample value)
- quantile (calculate φ-quantile (0 ≤ φ ≤ 1) over dimensions)
Let’s start so run expression like this
sum(node_cpu_seconds_total)
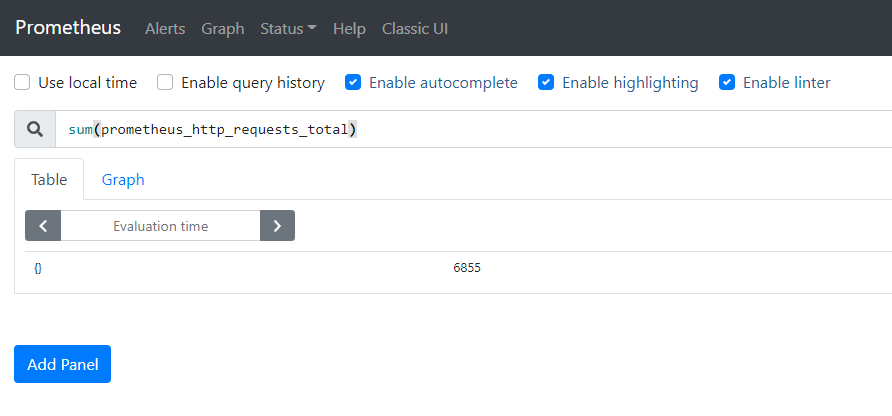
On execution it had added all sample value
Now if you want to see some time series based on labels then you can do it using by keyword like this
sum(prometheus_http_requests_total) by (code)
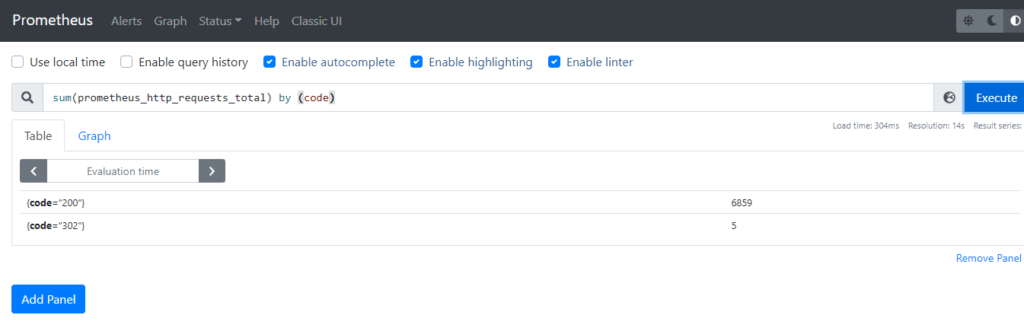
Now the Aggregate time series classified with code labels
Let’s try one more example topk
topk elements returns largest k elements of time series so run below expression
topk(3,sum(node_cpu_seconds_total) by (mode))
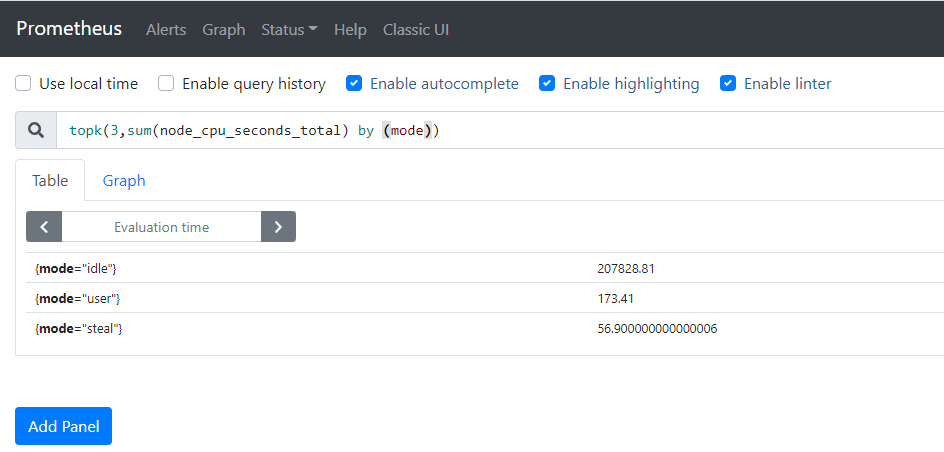
So you can see here top 3 mode that your CPU spending most of the time
Let’s try one more example bottomk
topk elements returns smallest k elements of time series so run below expression
bottomk(3,sum(node_cpu_seconds_total) by (mode))
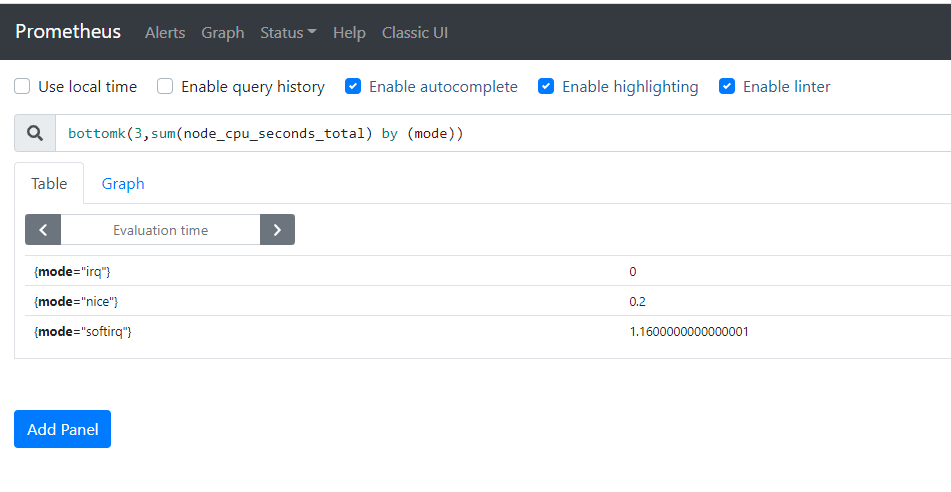
So you can see here top 3 mode that your CPU spending less time
Conclusion:
In this article we have covered Prometheus PromQL( Prometheus Query Language) Tutorial with examples.
Related Articles:
- Install Prometheus and Grafana on Ubuntu 20.04 LTS
- Kubernetes cluster Monitoring with Prometheus and Grafana.
- How to Install Nagios Core on CentOS 7
Reference:
good structured, i wish for more content !